| Installation and Administration | Getting Started | Command Line | Configuration | Eclipse Plugin | Reference Manual |
| Show on single page Show on multiple pages |
|
|
|
|
The Temporal Evolution Chart shows the evolution of one or measures over time. The measure representation is defined
by a renderer
attribute (as explained in the section called “Datasets and Renderers” for more details). It replaces the deprecated Temporal Evolution Bar and Temporal Evolution Line charts, and allows representing more than one data sets on the one chart.
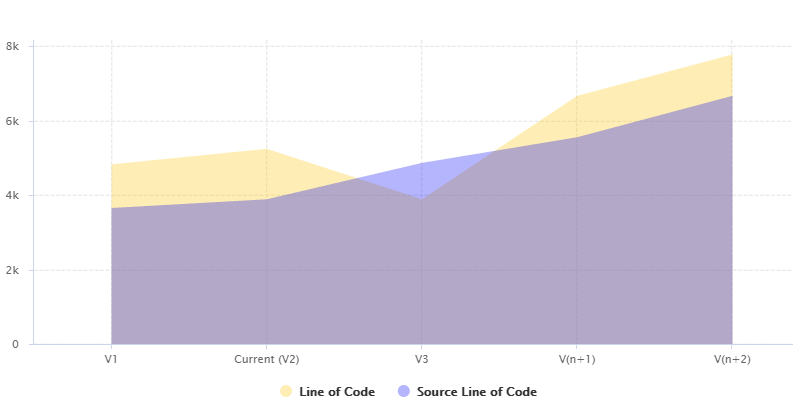
Temporal Evolution Chart using an AREA renderer
<chart type="TEMPORALEVOLUTION"
  id="TEMPORAL_EVOLUTION_AREA_EXAMPLE"
  onlyLast="5"
  renderer="AREA">
	<measure color="BLUE" alpha="75" label="Source Line of Code">SLOC
		<forecast>
			<version value="4865" timeValue="DATE(2014,05,01)" label="V3" />
			<version value="5555" timeValue="DATE(2014,06,01)" />
			<version value="2222+4444" timeValue="DATE(2014,08,01)" />
		</forecast>
	</measure>
	<measure color="ORANGE" alpha="75" label="Line of Code">LC
		<forecast>
			<version value="SLOC" timeValue="DATE(2014,05,01)" label="V3" />
			<version value="6666" timeValue="DATE(2014,06,01)" />
			<version value="3333+4444" timeValue="DATE(2014,08,01)" />
		</forecast>
	</measure>
</chart>
The Temporal Evolution Chart can also be used to draw a bar chart or a line chart, as shown below:
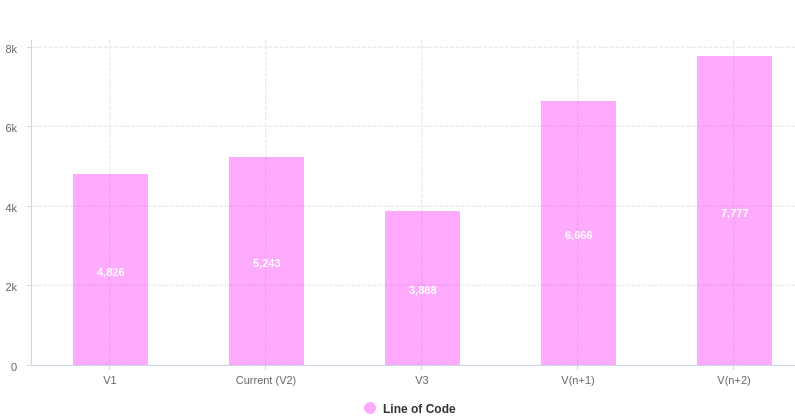
Temporal Evolution Chart using a BAR renderer
<chart type="TEMPORALEVOLUTION"
  id="TEMPORAL_EVOLUTION_BAR"
  renderer="BAR"
  onlyLast="5"
  exclude="VIEWER">
	<measure color="MAGENTA" alpha="85" label="Line of Code">LC
		<forecast>
			<version value="SLOC" timeValue="DATE(2014,05,01)" label="V3" />
			<version value="6666" timeValue="DATE(2014,06,01)" />
			<version value="3333+4444" timeValue="DATE(2014,08,01)" />
		</forecast>
	</measure>
</chart>

Temporal Evolution Chart using a LINE renderer
<chart type="TEMPORALEVOLUTIONBAR"
  id="TEMPORAL_EVOLUTION_LINE_EXAMPLE"
  onlyLast="5"
  isCChart="true">
	<dataset renderer="LINE">
		<measure color="BLUE" label="Source Line of Code">SLOC
			<forecast>
				<version value="4865" timeValue="DATE(2014,05,01)" label="V3" />
				<version value="5555" timeValue="DATE(2014,06,01)" />
				<version value="2222+4444" timeValue="DATE(2014,08,01)" />
			</forecast>
		</measure>
		<measure color="CYAN" label="Line of Code">LC
			<forecast>
				<version value="SLOC" timeValue="DATE(2014,05,01)" label="V4" />
				<version value="6666" timeValue="DATE(2014,06,01)" />
				<version value="3333+4444" timeValue="DATE(2014,08,01)" />
			</forecast>
		</measure>
	</dataset>
</chart>
The chart above is a normal Temporal Evolution Chart where the x-axis uses a regular gap between all versions and uses the version name as the label.
Below is an example of the difference in representation when using the x-axis as a chronological marker.
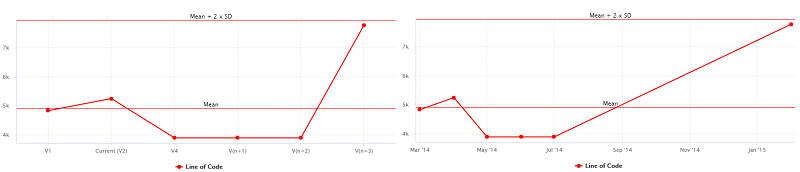
Temporal Evolution Chart with versions distributed evenly on the x-axis, using the version name as the label (left),
or distributed on the x-axis according to the date at which the analysis was carried out.
Labels on the x-axis do to not correspond to the version name this time. (right).
<chart type="TEMPORALEVOLUTIONBAR"
  id="TEMPORAL_EVOLUTION_LINE_EXAMPLE_2"
  onlyLast="5"
  dateFormat="MMM d"
  byTime="true|false"
  isCChart="true">
	<dataset renderer="LINE">
		<measure color="RED" label="Line of Code">LC
			<forecast>
				<version value="SLOC" timeValue="DATE(2014,05,01)" label="V4" />
				<version value="SLOC" timeValue="DATE(2014,06,01)" />
				<version value="SLOC" timeValue="DATE(2014,07,01)" />
				<version value="3333+4444" timeValue="DATE(2014,14,01)" />
			</forecast>
		</measure>
	</dataset>
</chart>
The chart
element may have the following attributes:
isCChart (optional, default: false)
transforms the chart in a C-Chart if set to true. This draws three extra lines to the chart at the following values on the y-axis:
mean
mean + (coefficient * standard deviation)
mean - (coefficient * standard deviation)
coeff
(optional, default: 0)
sets the value of the coefficient used to draw the control lines either side of the mean line when
isCChart
is set to true.
onlyLast
(optional, default: no limit)
defines the number of versions to be displayed, starting from the
one that is currently selected.
byTime
(optional, default: false)
defines whether versions are placed on the x-axis according to their analysis date. When activating this mode,
you can use the advanced options for the x-axis defined in the section called “Time Axis Configuration”.
breakOnMissingData
(optional, default: false)
specifies whether the line is interrupted (true) when a value is missing.
timeMeasure
(optional) is the measure ID (of type DATE) to use as the analysis date for a chart where byTime
is true. If not specified, the real analysis date of the version is used.
displayDate
(optional, default: false)
for all charts that display information about several versions. When set to false,
the version name is displayed in the chart. When set to true, the version date is displayed instead.
dateFormat
(optional, default: yyMM) allows formatting the version date when displayDate is set to
true according to the Java Simple Date Format described at
http://docs.oracle.com/javase/6/docs/api/java/text/SimpleDateFormat.html.
dateStyle
(optional, default: DEFAULT): the date formatting style,
used when the displayType is one of DATE or DATETIME.
timeStyle
(optional, default: DEFAULT): the time formatting style,
used when the displayType is one of DATETIME or TIME. See above for available styles.
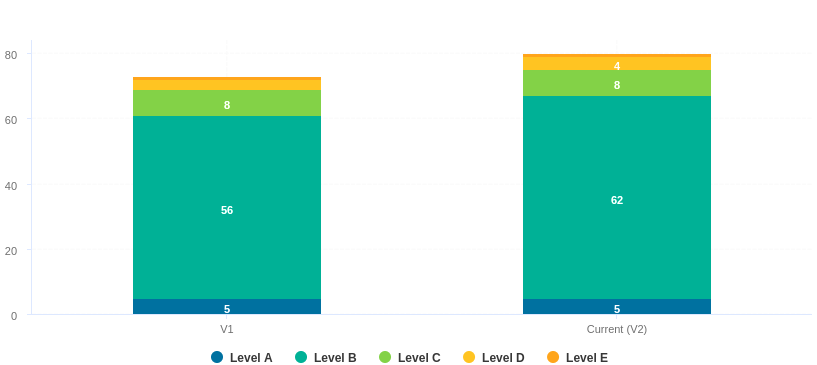
This chart represents the evolution of several measures across several versions. It takes a a minimum of two measures as elements.
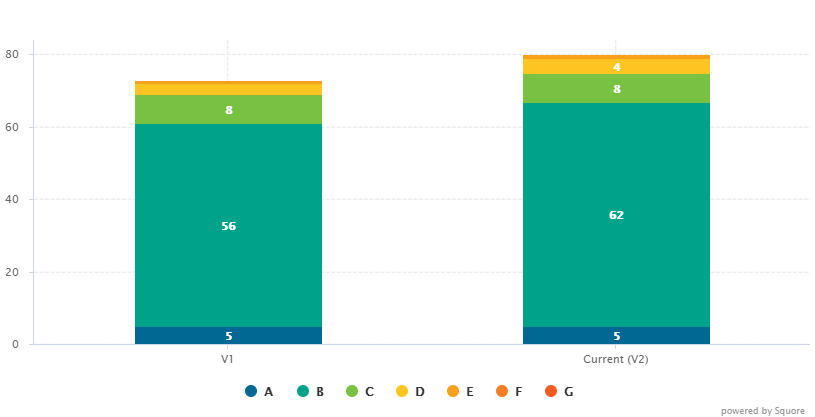
Temporal Optimised Stacked Bar Chart
<chart type="OPTIMIZEDTEMPORALEVOLUTIONSTACKEDBAR"
  id="OPTIMIZED_TEMPORAL_EVOLUTION_STACKED_BAR_EXEMPLE"
  targetArtefactTypes="FILE">
	<measure color="#006893" label="A">A_FILE</measure>
	<measure color="#00a38a" label="B">B_FILE</measure>
	<measure color="#79c142" label="C">C_FILE</measure>
	<measure color="#fec422" label="D">D_FILE</measure>
	<measure color="#f6a01b" label="E">E_FILE</measure>
	<measure color="#f48026" label="F">F_FILE</measure>
	<measure color="#f25b21" label="G">G_FILE</measure>
</chart>
The chart
for the Temporal Optimised Stacked Bar Chart does not have any specific attributes.
This chart represents the evolution of an indicator across the versions. It takes a single indicator as sub element. The values displayed are calculated on the fly. It is therefore sometimes recommended to use an Temporal Optimised Stacked Bar Chart for performance reasons.
Simple Temporal Evolution Stacked Bar
<chart type="SIMPLETEMPORALEVOLUTIONSTACKEDBAR"
  id="SIMPLETEMPORALEVOLUTIONSTACKEDBAR_EXAMPLE"
  targetArtefactTypes="FILE">
	<indicator>ROOT</indicator>
</chart>
The chart
for the Temporal Optimised Stacked Bar Chart does not have any specific attributes.