| Installation and Administration | Getting Started | Command Line | Configuration | Eclipse Plugin | Reference Manual |
| Show on single page Show on multiple pages |
|
|
|
|
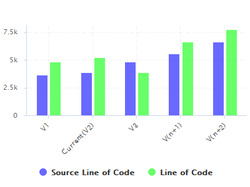
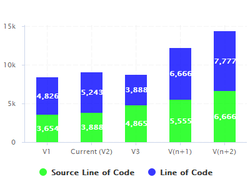
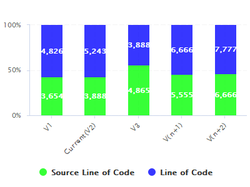
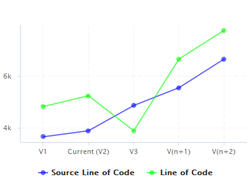
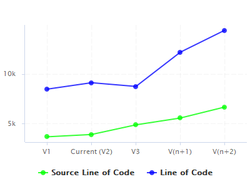
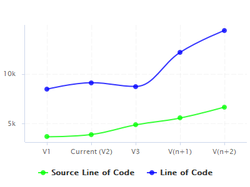
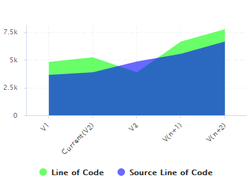
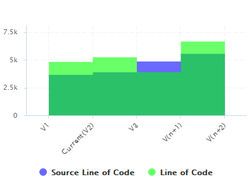
Datasets are used to apply different rendering settings to different sets of measures in a chart. Each dataset can use its own axis configuration.
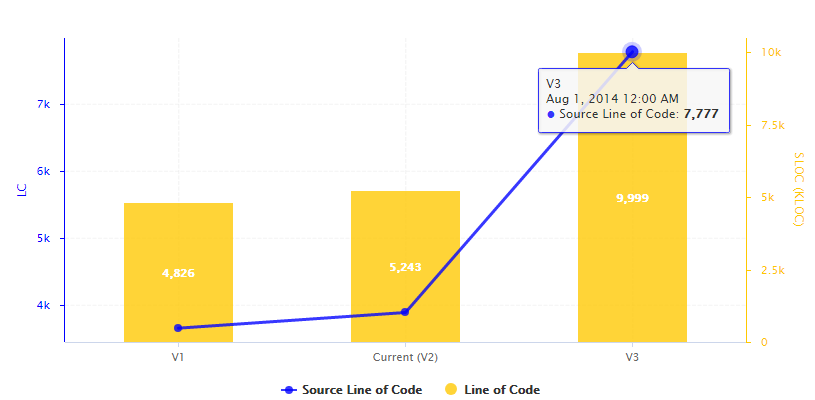
Two metrics styled with two different datasets in the same chart.
<chart type="TE" id="DATASETS_EXAMPLE">
	<dataset renderer="LINE" rangeAxisId="AXIS_RAW">
		<measure color="BLUE" alpha="200" label="Source Line of Code">SLOC
			<forecast>
				<version value="7777" timeValue="DATE(2014,08,01)" label="V3" />
			</forecast>
		</measure>
	</dataset>

	<dataset renderer="BAR" rangeAxisId="AXIS_KLOC">
		<measure color="ORANGE" alpha="200" label="Line of Code">LC
			<forecast>
				<version value="9999" timeValue="DATE(2014,08,01)" label="V3" />
			</forecast>
		</measure>
	</dataset>

	<rangeAxis id="AXIS_RAW" label="LC" color="BLUE" />
	<rangeAxis id="AXIS_KLOC" label="SLOC (KLOC)" color="ORANGE" />
</chart>
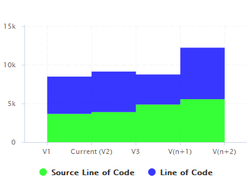
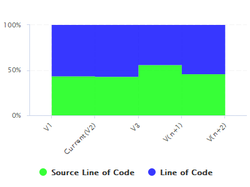
There are 7 basic types of renderers. Each one has can be prefixed with the STACKED_ modifier to stack data series on top of each other, and suffixed with the _100 modifier that displays data series as percentages:
BAR
BAR |
STACKED_BAR |
STACKED_BAR_100 |
LINE
LINE |
STACKED_LINE |
STACKED_LINE_100 |
STEP
STEP |
STACKED_STEP |
STACKED_STEP_100 |
SPLINE (new in 17.0)
SPLINE |
STACKED_SPLINE |
STACKED_SPLINE_100 |
AREA
AREA |
STACKED_AREA |
STACKED_AREA_100 |
AREA_STEP (new in 17.0)
AREA_STEP |
STACKED_AERA_STEP |
STACKED_AREA_STEP_100 |
AREA_SPLINE (new in 17.0)
AREA_SPLINE |
STACKED_AREA_SPLINE |
STACKED_AREA_SPLINE_100 |
The dataset
element accepts the following attributes:
Chart axes can be defined using the rangeAxis
element, which accepts the following attributes:
id
(mandatory) The configuration identifier (referred to by a dataset
element)
label
(optional, default: the measure name) The label to be displayed on the axis
min
(optional, defaults to an automatic value) is the minimum boundary for the axis. This attribute can be specified as a value or as a computation.
max
(optional, defaults to an automatic value) is the maximum boundary for the axis. This attribute can be specified as a value or as a computation.
visible
(new in 17.0) (optional, default: true) allows hiding a vertical axis when set to false
inverted
(optional, default: false) reverses the order of values on the axis when set to true.
location
(optional, default: left for vertical charts, bottom for horizontal charts)
allows defining where around the chart the axis is drawn. Allowed values are: left,
right, bottom and top.
color
(optional, default: automatically assigned) sets the colour used to draw the scale. [colour syntax]
type
(optional, default: number) defines how the scale is represented on the axis.
Use number to display the numerical values or scale to plot the axis with the associated scale levels of an indicator.
scaleId
(mandatory if scale is specified) is the id of the indicator to be used
to plot the axis when using type="scale".
numberFormat
(optional, default: usually number) allows customising the number format
when using type="number". The accepted values are as follows:
NUMBER to display a number (formatted according to the browser's locale)
PERCENT to display a percentage
INTEGER to display a number with no decimals
any other text to specify a display pattern following Java's DecimalFormat, as described on http://docs.oracle.com/javase/6/docs/api/java/text/DecimalFormat.html