| Installation and Administration | Getting Started | Command Line | Configuration | Eclipse Plugin | Reference Manual | API |
| Show on single page Show on multiple pages |
|
|
|
|
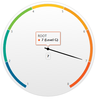
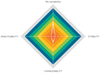
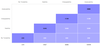
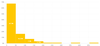
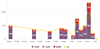
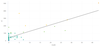
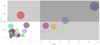
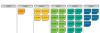
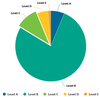
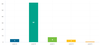
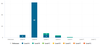
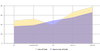
There are many types of charts. The best approach to finding the chart you want to use on your dashboard can be found by answering the following questions:
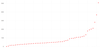
Should my chart display a trend or reflect the data for a single version of my project?
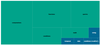
Is the information I want to display abut the current artefact or about its descendants?
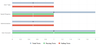
Will my chart display one bit of information or combine several?
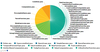
Is the information displayed by my chart quantitative or qualitative?
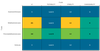
Answering these questions will lead you toward the type of chart you want to use. The table below shows the type of answer offered by each of the charts available in Squore:
Table 7.1. Charts for Single-Version Data Visualisation
| Current Artefact Data | Descendants of the Current Artefact | ||||||
| Quantitative Information | Qualitative Information | Quantitative Information | Qualitative Information | ||||
|
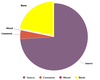
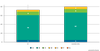
Single Dataset | Multiple Datasets |
Single Dataset | Multiple Datasets |
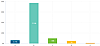
Single Dataset | Multiple Datasets |
Single Dataset | Multiple Datasets |
| N/A | |||||||
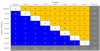
Table 7.2. Charts for Trend-Based Visualisation
| Current Artefact Data | Descendants of the Current Artefact | ||||||
| Quantitative Information | Qualitative Information | Quantitative Information | Qualitative Information | ||||
|
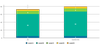
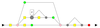
Single Dataset | Multiple Datasets |
Single Dataset | Multiple Datasets |
Single Dataset | Multiple Datasets |
Single Dataset | Multiple Datasets |
| N/A | N/A | N/A | N/A | N/A | |||