| Installation and Administration | Getting Started | Command Line | Configuration | Eclipse Plugin | Reference Manual | API |
| Show on single page Show on multiple pages |
|
|
|
|
The Control Flow Chart is a graphical representation of the logical structure of a function using different-coloured shapes reflecting the type of logical break (if, while, switch...) in the code.
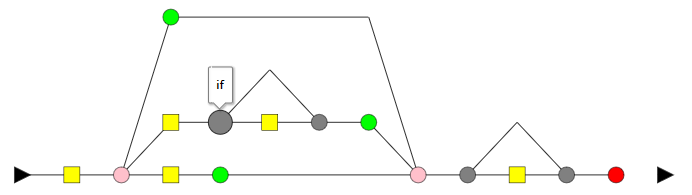
Control Flow Chart
<chart type="CONTROLGRAPH" id="CONTROL_FLOW_GRAPH_EXAMPLE"/>
The chart
for a Control Flow Chart does not have any specific attributes.
The View Source chart is a special chart-like placeholder on a dashboard that allows users to click it to view the source of the current artefact.
Depending on the artefact type, the View Source chart will either display a popup containing the artefact's source code, or will open a link to the artefact's URL. For more information about configuring access to external sources, consult the section called “Links to External Resources”.
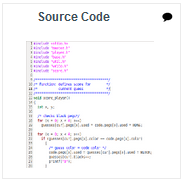
View Source
<chart type="SOURCECODE" id="SOURCE_CODE_EXAMPLE"</chart>
The chart
for the View Source does not have any specific attributes.