| Installation and Administration | Getting Started | Command Line | Configuration | Eclipse Plugin | Reference Manual | API |
| Show on single page Show on multiple pages |
|
|
|
|
Copyright © 2019 Squoring Technologies
Licence
No part of this publication may be reproduced, transmitted, stored in a retrieval system, nor translated into any human or computer language, in any form or by any means, electronic, mechanical, magnetic, optical, chemical, manual or otherwise, without the prior written permission of the copyright owner, Squoring Technologies.
Squoring Technologies reserves the right to revise this publication and to make changes from time to time without obligation to notify authorised users of such changes. Consult Squoring Technologies to determine whether any such changes have been made.
The terms and conditions governing the licensing of Squoring Technologies software consist solely of those set forth in the written contracts between Squoring Technologies and its customers.
All third-party products are trademarks or registered trademarks of their respective companies.
Warranty
Squoring Technologies makes no warranty of any kind with regard to this material, including, but not limited to, the implied warranties of merchantability and fitness for a particular purpose. Squoring Technologies shall not be liable for errors contained herein nor for incidental or consequential damages in connection with the furnishing, performance or use of this material.
Abstract
This edition of the Configuration Guide applies to Squore 18.0.18 and to all subsequent releases and modifications until otherwise indicated in new editions.
Table of Contents
chart
measure and indicator
info
List of Tables
Table of Contents
This document was released by Squoring Technologies.
It is part of the user documentation of the Squore software product edited and distributed by Squoring Technologies.
The Squore Configuration Guide provides a complete reference for the configuration and administration of Squore 18.0.18, with step-by-step instructions to customise the different models that define Squore behaviour.
This manual is intended for Squore administrators. It allows to fine-tune the Squore configuration to fit specific needs or contexts. Note however, that the default parameters work in most cases for most users, and that only experienced and technical-savvy users should try to modify those settings.
If you are already familiar with Squore, you can navigate this manual by looking for what has changed since the previous version. New functionality is tagged with (new in 18.0) throughout this manual. A summary of the new features described in this manual is available in the entry *** What's New in Squore 18.0? of this manual's Index.
For information on how to use and configure Squore, the full suite of manuals includes:
Squore Installation Checklist
Squore Installation and Administration Guide
Squore Getting Started Guide
Squore Command Line Interface
Squore Configuration Guide
Squore Eclipse Plugin Guide
Squore Reference Manual
If the information provided in this manual is erroneous or inaccurate, or if you encounter problems during your installation, contact Squoring Technologies Product Support: https://support.squoring.com/
You will need a valid Squore customer account to submit a support request. You can create an account on the support website if you do not have one already.
For any communication:
support@squoring.com
Squoring Technologies Product Support
76, allées Jean Jaurès / 31000 Toulouse - FRANCE
Approval of this version of the document and any further updates are the responsibility of Squoring Technologies.
The version of this manual included in your Squore installation may have been updated. If you would like to check for updated user guides, consult the Squoring Technologies documentation site to consult or download the latest Squore manuals at https://support.squoring.com/documentation/18.0.18. Manuals are constantly updated and published as soon as they are available.
Table of Contents
This chapter describes how to work with the default configuration and how to build on it to extend Squore.
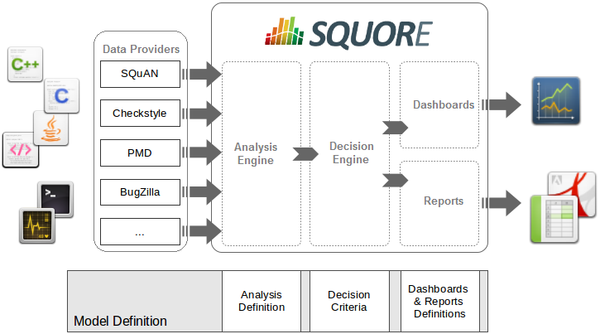
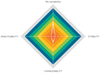
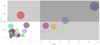
The picture above shows the different components involved in the Squore process.
The main building blocks of the Squore configuration are:
SQuORE parser and other Data Providers are the inputs for the process, providing base measures for the analysis model.
Analysis Models define the transformation between base measures, which are retrieved from Data Providers and derived measures.
Decision models define how to process raw data (i.e. base measures) and analysis data (i.e. derived measures) to raise action items.
Dashboards present the overall results in a convenient way. They are deeply customisable and can show all the information needed in day-to-day usage of Squore.
Reports extract information and present it in a document (PDF, Powerpoint or spreadsheet). They can be used for external reporting, e.g. when there is no access to the Squore interface.
Models define how Squore computes metrics (analysis model), how action items are created (decision model), and how data is displayed (dashboards and reports).
All models are located in the <SQUORE_HOME>/configuration/models directory.
Each folder in <SQUORE_HOME>/configuration/models is a separate model. Each model has
a wizard, i.e. a series of screens where users configure the options available for the model before launching an analysis,
as described in Chapter 8, Understanding Project Wizards.
The Shared folder is different, since it is not a self-contained model, but rather a
collection of components that are meant to be imported by other models in the configuration. This avoids creating redundancy, and redefining
the same metrics or indicators every time.
The Shared Model is located in the same directory as other models: <SQUORE_HOME>/configuration/models.
Its structure is similar to other models, but it does not appear in the user interface.
To understand some of the common measures and rules used across Squore you can take a look at
the common definitions available in <SQUORE_HOME>/configuration/models/Shared/Analysis/product_quality/code, especially:
artefact_rating
call_relation
cloning
complexity
control_flow_analysis
line_counting
rule_checking
stability
Squore is fully customisable and allows you to override the default models and add your own ones. Your modifications to the
default configuration should never be made directly in <SQUORE_HOME>/configuration, but in your own configuration folder which you
will make Squore aware of by editing <SQUORE_HOME>/config.xml. This allows you to create only the files that are needed
for your modifications and minimise the amout of files to add to version control.
In order to add a configuration folder for your modifications:
Create a folder called MyConfiguration
Create two subfolders folder called configuration and addons
Edit Squore Server's <SQUORE_HOME>/config.xml to add MyConfiguration/configuration
and MyConfiguration/addons as registered configuration and addons paths, as described
in the Installation and Administration Guide in the section called Adding a Configuration Folder
As a Squore administrator, log in and click Administration > Reload Configuration
Squore now knows that it needs to load the models that exist in your custom configuration as well as the ones in the default
configuration folder. If you want to override a file in the default configuration folder, recreate the folder structure in your
custom configuration folder, copy the file from the default configuration folder and make the necessary modifications. Because
the custom configuration folder is listed first in <SQUORE_HOME>/config.xml, the file in the custom configuration
folder will be used instead of the file in the default configuration folder.
Creating a new model is as simple as creating a folder in your custom configuration folder and creating the various definition files needed for the Analysis Model, the Decision Model, the dashboard and reports you want to enable:
Create a new directory MyModel in the MyConfiguration/configuration/models directory.
In the MyModel folder, create the following sub-folders:
Analysis
Dashboards
Decision
Description
Exports
Analysis
Reports
Wizards
Log into Squore as administrator, reload the configuration and click Models > Validator. Your new model should be visible in the list of available models.
The following section of this manual will cover how to use existing packages from the Shared folder and how to display text in the web infterface.
A model is a collection of several Bundle.xml files where your entire model is described. A model folder normally contains the following bundles:
MyModel/Analysis/Bundle.xml, where artefact types, metrics, indicators and rules are defined
MyModel/Dashboard/Bundle.xml, where the charts displayed in the web interface are defined
MyModel/Decision/Bundle.xml, where you define the action items for your model
MyModel/Description/Bundle.xml, where you translate all the elements of your model into several languages
MyModel/Exports/Bundle.xml, where you define the type of information that users can export from the web UI
MyModel/Highlights/Bundle.xml, where the different types of highlight categories are defined
MyModel/Properties/Bundle.xml, where optional properties about your model are defined
MyModel/Reports/Bundle.xml, where you define the type of reports that can be created from the web UI
MyModel/Wizards/Bundle.xml, where you define the parameters to be used when creatign a project with your model
More information about each type of bundle is available in this manual. Note that a Bundle.xml file normally includes external files located elsewhere in the standard Squore configuration. This allows reusing modules between models.
The following is an (incomplete) example of a Bundle.xml file for an analysis model. It includes other files from the Squore configuration. Note that the
xmlns:xi
declaration in the Bundle
element is
mandatory if you want to include external files.
<?xml version="1.0" encoding="utf-8" standalone="yes"?>
<Bundle xmlns:xi="http://www.w3.org/2001/XInclude" >
	<!-- Additional Artefact types and aliases Aliases -->
	<ArtefactType id="MY_ARTEFACT_TYPE" heirs="MY_SUB_TYPE;MY_OTHER_SUB_TYPE" />

	<!-- Local definitions to override other files or not defined in other files -->
	<RootIndicator indicatorId="ANALYTICS" artefactTypes="MY_ARTEFACT_TYPE" />
	<Measure measureId="ANALYTICS">
		<Computation targetArtefactTypes="MY_ARTEFACT_TYPE" result="..." />
	</Measure>

	<!-- Import of base metrics + Ruleset from Shared folder -->
	<xi:include href="../../Shared/data_provider/squan_sources/all_17.xml" /> <!-- mandatory if you are using source code in your model -->
	<xi:include href="../../Shared/data_provider/pylint/ruleset.xml" />

	<!-- Basic Scales -->
	<xi:include href="../../Shared/Analysis/basic_scale_macros.xml" />
	<xi:include href="../../Shared/Analysis/basic_scales.xml" />

	<!-- Some Classical Base and Derived Measures -->
	<xi:include href="../../Shared/Analysis/product_quality/code/cloning/all_7levels_17.xml" />
	<xi:include href="../../Shared/Analysis/product_quality/code/self_descriptiveness/main_17.xml" />

	<!-- Rule Checking -->
	<xi:include href="issues_counting.xml" />
	<xi:include href="issues_weighted_kpi.xml" />
	<xi:include href="../../Shared/Analysis/product_quality/square25010/counting_by_severity.xml" />

	<!-- Tickets from my model folder -->
	<xi:include href="ticket/metrics.xml" />
</Bundle>
All paths in a Bundle.xml are relative to Bundle.xml.
The bundle file is an xml file, which means that you must respect the XML syntax, otherwise Squore will not be able to read it. This means for example that the following characters are forbidden, and must be replaced by their corresponding entity reference:
& needs to be replaced by &
< needs to be replaced by <
> is preferably replaced by >, but this is not mandatory
" needs to be replaced by " (only when used inside an attribute value)
' needs to be replaced by ' (only when used inside an attribute value)
To learn more about entities, visit en.wikipedia.org/wiki/List_of_XML_and_HTML_character_entity_references
In order to provide a simple way to display dashboards in multiple languages in the Squore web interface, all strings have been externalised
to .properties files
. A .properties
file contains translations for all the metrics, rules, action items, charts and other objects described in your model. A model contains a
Bundle.xml that lists all the .properties files that need to be loaded for this model.
In your description bundle, inlude a .properties file by adding a Properties
element.
Squore will select the appropriate display language for this model according to the language options defined in the
available
and default
attributes, as shown below:
<?xml version="1.0" encoding="utf-8" standalone="yes"?>
<Bundle available="fr,en" default="en">
	<Properties src="../../Shared/data_provider/squan_sources/descriptions" />
</Bundle>
In the example above, it is assumed that two files exist with the names
Shared/data_provider/squan_sources/descriptions_en.properties
and Shared/data_provider/squan_sources/descriptions_fr.properties, since you declared both languages in the
available
attribute. Users are free to switch between the English and French languages using the flag
icons in the Squore web interface. By default, Squore will display the descriptions from descriptions_en.properties,
since you set the default language to "en" using the default
attribute.
Properties files are simple text files containing key-value pairs to associate text to a property of an element of your model.
For example, the metric SLOC is translated using this line in a .properties file:
SLOC.DESCR=The number of source line of codes
If we need the desctiption of SLOC to be different for artefact of type CPP_FUNCTION and APPLICATION, we can use a more advanced definition:
M.SLOC.DESCR.APPLICATION=The number of source line of codes in the application
M.SLOC.DESCR.CPP_FUNCTION=The number of source line of codes in the function
The convention for this syntax is as follows:
[PREFIX.]IDENTIFIER.PROPERTY[.ARTEFACT_TYPE]=My localised text
where:
PREFIX is a prefix used to indicate which type of object the localised text applies to. If no prefix is specified, then the localised text is used for all objects in the model with this identifier. The supported values for PREFIX are:
M for measures
I for indicators
C for charts
EVO for trend icons
EX for exports
FA for families
FI for findings
G for groups
HI for highlights
LOP for scale levels (levels of performance)
MO for models
PERM for permissions
PRO for profiles
RO for roles
RE for reports
SC for scales
ST for action item statuses
T for artefact types
TA for tables (with optional #IN and #OUT suffixes to localise inbound and outbound links tables independently: TA.MY_TABLE#IN / TA_MYTABLE#OUT)
TAG for project attributes in forms and wizards
TAG_GROUP for groups of project attributes in forms and wizards
TST for action item tests
TUTO for tutorial descriptions
WI for wizards
MIL for milestones
IDENTIFIER is the ID of the object as described in the model.
PROPERTY is the property being set. It is one of:
MNEMO to specify a mnemonic, i.e. a short representation of the object that is used where space needs to be preserved. Note that if no mnemonic is specified, the raw identifier will be used instead in the UI.
NAME to specify a name, i.e. the common, human-understandable representation of an object.
DESCR to specify a description for the object.
JUSTIF to specify a justification for a rule. This is displayed in the Findings pane and allows you to provide more details about why a rule is used.
URL to specify a URL associated with the object. This URL is displayed below the description of a rule on the Findings tab, or in any popup that shows the full description of a measure or indicator on the Dashboard. This URL is clickable and opens in a new browser window. This is usually useful if you want to link to the definition of a coding standard ourside of Squore.
ICON to specify an icon for a scale level (LOP), a trend icon in the artefact tree (EVO) or a group icon (G) in the project portfolios.
IMAGE to specify an image for a scale level (LOP) when displayed as a KPI on the dashboard.
COLOR to specify the colour to represent a metric (M, I), a scale level (LOP) or a milestone (MIL) on a chart or a popup describing a scale. For more information about the supported colour formats, consult [colour syntax] .
NODATA to specify a text to be displayed in a chart (C) on the dashboard when no data can be displayed on the chart.
TREE_NAME to specify a name for a chart (C) that is used in the Dashboard Editor's tree of charts.
ARTEFACT_TYPE is used to restrict the scope of the property to the specified type of artefact. If no ARTEFACT_TYPE is specified, then the property applies for all artefact types.
Examples
Usual set of properties for a measure or an indicator:
STATUS.MNEMO=Status
STATUS.NAME=Requirement Status
STATUS.DESCR=Status (draft or final)
Usual set of properties for a rule to display in the Findings tab:
R_NOGOTO.MNEMO=NOGOTO
R_NOGOTO.NAME=No GOTO
R_NOGOTO.DESCR=A unconditional GOTO shall not be used to jump outside the paragraph.
R_NOGOTO.JUSTIF=GOTO statements should be avoided because they complicated the task of analyzing and verifying the correctness of programs (particularly those involving loops).
R_NOGOTO.URL=https://xkcd.com/292/
Usual set of properties for a scale:
SC.STATUS.NAME=Requirement Readiness Assessment
LOP.UNKNOWN.MNEMO=Unknown
LOP.UNKNOWN.NAME=Unknown
LOP.UNKNOWN.DESCR=Unknown
LOP.UNKNOWN.IMAGE=../Shared/Images/images/questionmark.png
LOP.UNKNOWN.ICON=../Shared/Images/icons/questionmark.png
LOP.UNKNOWN.COLOR=#C11B17

LOP.DRAFT.MNEMO=Draft
LOP.DRAFT.NAME=Draft
LOP.DRAFT.DESCR=Draft
LOP.DRAFT.IMAGE=../Shared/Images/icons/wip.png
LOP.DRAFT.ICON=../Shared/Images/icons/wip.png
LOP.DRAFT.COLOR=#FFDB58

LOP.FINAL.MNEMO=Final
LOP.FINAL.NAME=Final
LOP.FINAL.DESCR=Final
LOP.FINAL.IMAGE=../Shared/Images/icons/final.png
LOP.FINAL.ICON=../Shared/Images/icons/final.png
LOP.FINAL.COLOR=#41A317
The path to an image or icon file is relative to the root of the folder containing the model.
Using a different description for a metric when using it on the Action Items tab with the TST prefix:
OVERPERFORMANCE.MNEMO=Over-Performance
OVERPERFORMANCE.NAME=Over-Performance
OVERPERFORMANCE.DESCR=You are over-performing at this time.
TST.OVERPERFORMANCE.DESCR=Your current progress of {2}% is exceeding your objective for the next milestone by over 20% ({0}% in {1} days). /Either you are pretty good, or you underestimated yourself when setting your goals. Consider revising your objectives.In the example above, / is used to indicate a new line in the description.
{0}, {1} and {2} are parameters that are dynamically filled in when viewing the action item. For more information, consult the section called “Trigger-Based Action Plans”.
Overriding a name and description for a specific type of artefact:
RAM.MNEMO=RAM
RAM.NAME=Used RAM
RAM.NAME.APPLICATION=Sum of Used RAM
RAM.DESCR=Used RAM
RAM.DESCR.APPLICATION=Sum of Used RAM
Squore resolves properties from the more specific to the more abstract, as shown below:
Note that aliases are not supported, only real artefact types. If you want to specify a description for functions in all languages, you have to add a line for each of the function types: CPP_FUNCTION, C_FUNCTION, ADA_FUNCTION...
Setting a chart's name and description
C.PERFORMANCE_TREND.NAME=Performane Trend
C.PERFORMANCE_TREND.DESCR=<h1>Reading the Performance Trend Chart</h1><p>This chart shows a history of the performance trend for our application, as recorded nightly by our performance tests.</p><p>If you see any variation, you should perform the following three checks</p><ol><li>Is it a false positive, See if an error was reported in Jenkins</li><li>Check the machine logs for an explanation</li><li>Has someone already reported a bug? If not, <b>please do!</b></li></ol>
You can use the following HTML tags in descriptions for charts, measures and indicators (new in 18.0): h1, h2, h3, h4, h5, h6, p, span, div, br, i, b, u, a, pre, hr, ul, ol, li
Setting help text for tutorials. Note that only .DESCR is supported:
TUTO.WELCOME_TUTORIAL_RISK.DESCR=Understanding the Risk Index Model
TUTO.WELCOME_TUTORIAL_RISK_DESCRIPTION.DESCR=This tutorial takes you around the dashboard of the Squore Risk Index model to explain the concepts behind the ranking and help you understand how to improve your project based on the specific action plan generated by this model.
TUTO.EXPLAIN_TRENDS.DESCR=<b>Warning!</b><br/>Pay attention to this trend icon: <img src="dashboard_tour/tree_up.png" />
HTML is supported in help text, but not in the main description of the tutorial that
appears in the tutorial selection popup. You can insert images in the help text, using the relative path to the image file from
Bundle.xml.
Here are the locations of the default types, permissions, roles and profiles, and statuses:
Types: <SQUORE_HOME>/configuration/models/Shared/Analysis/Code/Types/rights_en.properties
Permissions: <SQUORE_HOME>/configuration/models/Shared/Description/rights_en.properties
Roles and profiles: <SQUORE_HOME>/configuration/models/Shared/Description/roles_en.properties
Statuses: <SQUORE_HOME>/configuration/models/Shared/Description/status_en.properties
You are free to override or extend these defaults in your own .properties file in your model.
In order to set an icon for a type, create an image called identifier.png (the identifier must be lowercase) in
your configuration under models/Shared/Images/icons/types.
All Data Providers are utilities that run during an analysis. They usually take an input file to parse or parameters specified by the user to generate output files containing violations or metrics to add to your project. Here is a non-exhaustive list of what some of them do:
Use XSLT files to transform XML files
Read information from Microsoft Excel files
Parse HTML test results
Query web services
Export data from OSLC systems
Launch external processes
Repository Connectors are based on the same model and are used to specifically retrieve source code and other data from source code management systems.
Read on to learn about how to configure your Data Provider and make it available in the web interface, and then understand how to implement the scripted part of a Data Provider that is executed during an analysis.
The last part fo this section also introduces two frameworks that you can base your Data Providers on depending on whether you prefer to produce CSV or XML files for Squore.
A Data Provider's parameters are defined in a file called form.xml. The following is an example of form.xml for a Data Provider extending the GenericPerl framework:
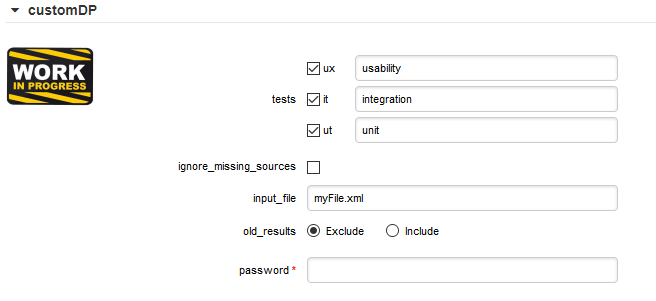
<?xml version="1.0" encoding="UTF-8"?>
<tags baseName="GenericPerl" needSources="true" image="CustomDP.png" projectStatusOnFailure="ERROR">
	<tag type="multipleChoice" displayType="checkbox" optionTitle=" " key="tests">
		<value key="ux" option="usability" />
		<value key="it" option="integration" />
		<value key="ut" option="unit" />
	</tag>
	<tag type="booleanChoice" key="ignore_missing_sources" defaultValue="false" />
	<tag type="text" key="input_file" defaultValue="myFile.xml" changeable="false" />
	<tag type="multipleChoice" key="old_results" style="margin-left:10px" displayType="radioButton" defaultValue="Exclude">
		<value key="Exclude" />
		<value key="Include" />
	</tag>
	<tag type="text" key="java_path" defaultValue="/usr/bin/java" hide="true" />
	<tag type="password" required="true" key="password" />
</tags>
The
tags
element accepts the following attributes:
baseName
(mandatory if you are not using an exec-phase
) indicates on which framework you are basing this Data Provider. The value of this attribute must match a folder from the addons folder of your installation.
needSources
(optional, default: false) allows specifying whether the Data Provider requires sources or not. When set to true, an error will be displayed if you try to select this Data Provider without adding any Repository Connector location to your project.
image
(optional, default: none) allows displaying a logo in the web UI for the Data Provider
projectStatusOnFailure
(optional, default: ERROR) defines what status the project ends in when this Data Provider produces an error. The following values are allowed:
IGNORE
WARNING
ERROR
projectStatusOnWarning
(optional, default: WARNING) defines what status the project ends in when this Data Provider produces a warning. The following values are allowed:
IGNORE
WARNING
ERROR
Each
tag
element is a Data Provider option and allows the following attributes:
key
(mandatory) is the option's key that will be passed to the perl script, or can be used to specify the parameter's value from the command line
type
(mandatory) defines the type of the parameter.
The following values are accepted:
text for free text entry
password for password fields
booleanChoice for a boolean
multipleChoice for offering a selection of predefined values
displayType
(optional) allows specifying how
to display a multipleChoice
parameter by using one of:
comboBox
radioButton
checkbox
defaultValue
(optional, default: empty) is the value used for the parameter when not specified
hide
(optional, default: false) allows hiding a parameter from the web UI, which is useful when combining it with a default value
changeable
(optional, default: true) allows making a parameter configurable only when creating the project but read-only for following analyses when set to true
style
(optional, default: empty) allows setting basic css for the attribute in the web UI
required
(optional, default: false) allows showing a red asterisk next to the field in the web UI to make it visibly required.
You can use a required tag
of type booleanchoice to ensure that users must check a box in the web UI or set its value to true when building from the command line in order to proceed with the analysis (new in 18.0).
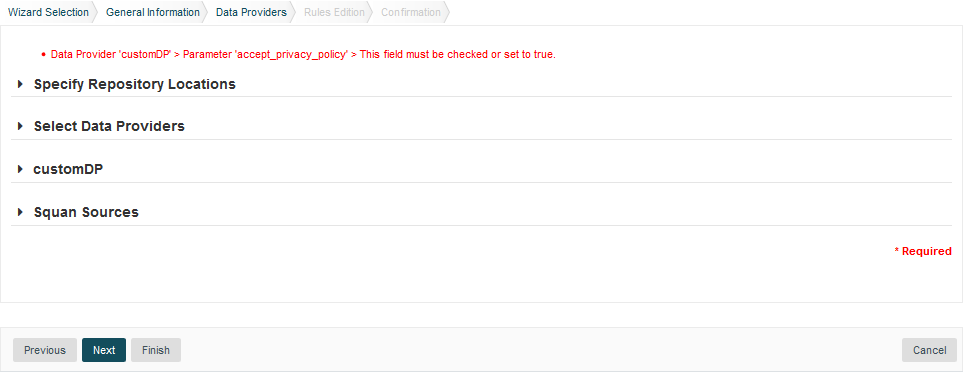
<tag type="booleanChoice" required="true" key="accept_privacy_policy" />
In order to display your Data Provider parameters in different languages in the web UI, yout Data Provider's form.xml does not
contain any hard-coded strings. Instead, Squore uses each parameter's key
attribute to dynamically
retrieve a translation from a form_xx.properties file located next to form.xml.
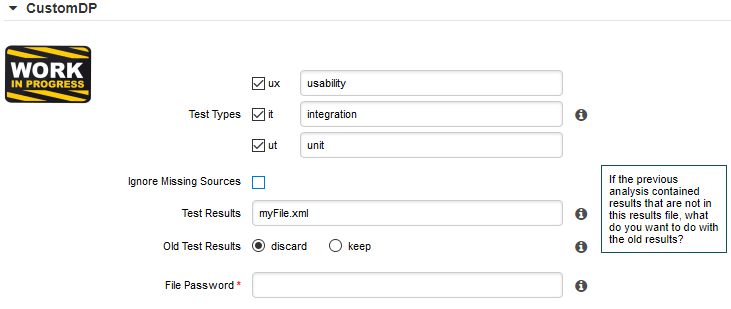
When you create a Data Provider, it is mandatory to include at least an English version of the strings in a file called form_en.properties. You are free to add other languages as needed. Here is a sample .properties for for the CustomDP you created in the previous section:
FORM.GENERAL.NAME  = CustomDP
FORM.DASHBOARD.NAME  = Test Status
FORM.GENERAL.DESCR = CustomDP imports test results for my project
FORM.GENERAL.URL   = http://example.com/CustomDP

TAG.tests.NAME  = Test Types
TAG.tests.DESCR = Check the boxes next to the types of test results contained in the results

TAG.ignore_missing_sources.NAME = Ignore Missing Sources

TAG.input_file.NAME = Test Results
TAG.input_file.DESCR = Specify the absolute path to the file containing the test results

TAG.old_results.NAME = Old Test Results
TAG.old_results.DESCR = If the previous analysis contained results that are not in this results file, what do you want to do with the old results?
OPT.Exclude.NAME = discard
OPT.Include.NAME = keep

TAG.password.NAME = File Password
TAG.password.DESCR = Specify the password to decrypt the test results file
The syntax for the .properties file is as follows:
FORM.GENERAL.NAME is the display name of the Data Provider in the project wizard
FORM.DASHBOARD.NAME is the display name of the Data Provider in the Explorer
FORM.GENERAL.DESCR is the description displayed in the Data Provider's tooltip in the web UI
FORM.GENERAL.URL is a reference URL for the Data Provider. Note that it is not displayed in ther web UI yet.
TAG.tag_name.NAME allows setting the display name of a parameter
TAG.tag_name.DESCR is a help text displayed in a tooltip next to the Data Provider option in the web UI
OPT.option_name.NAME allows setting the display name of an option
Using the form_en.properties above for CustomDP results in the following being displayed in the web UI when launching an analysis:
.properties fileNot all wizards display all Data Providers by default. If your Data Provider does not appear after refreshing your configuration, make sure that your wizard bundle allows displaying all Data Providers
by reviewing the tools
element of Bundle.xml:
<?xml version="1.0" encoding="UTF-8"?>
<Bundle>
	<Wizard ... >
		...
		<tools all="true">
			...
		</tools>
		...
	</Wizard>
</Bundle>
For more information about the wizard bundle, consult the the chapter called "Project Wizards" in the Configuration Guide.
If you have made this change and your Data Provider still does not appear in your wizard, consult the Validator to find out if it was disabled because of an error in its configuration.
Now that you have a new Data Provider available in the web interface (and the command line), this section will show you how to use these parameters and pass them to one or more scripts or executables in order to eventually write data in the format that Squore expects to import during the analysis.
At the end of a Data Provider execution, Squore expects a file named input-data.xml to be written in a specific location. The syntax of the XML file to generate is as follows:
<!-- input-data.xml syntax -->
<bundle version="2.0">
	<artifact [local-key=""] [local-parent=""|parent=""] >
        <artifact [id="<guid-stable-in-time-also-used-as-a-key>"] name="Component" type="REQ" [location=""] >
			<info name|n="DESCR" value="The description of the object"/>
			<key value="3452-e89b-ff82"/>
			<metric name="TEST_KO" value="2"/>
			<finding name="AR120" loc="xxx" p0="The message" />
			<link name="TEST" local-src=""|src=""|local-dst=""|dst="" />
				<artifact id="" name="SubComponent" type="REQ">
				...
				</artifact>
		</artifact>
	</artifact>

	<artifact id="" local-key="" name="" type="" local-parent=""|parent="" [location=""] />
	...

	<link name="" local-src=""|src="" local-dst=""|dst="" />
	...

	<info local-ref=""|ref="" name="" value=""/>
	...

	<metric local-ref=""|ref="" name="" value=""/>
	...

	<finding local-ref=""|ref="" [location=""] p0="" />
	<finding local-ref=""|ref="" [location=""] p0="">
		<location local-ref=""|ref="" [location=""] />
		...
		<relax status="RELAXED_DEROGATION|RELAXED_LEGACY|RELAXED_FALSE_POSITIVE"><![CDATA[My Comment]]></relax>
	</finding>
	...
</bundle>
Your Data Provider is configured by adding an exec-phase
element with a mandatory id="add-data"
attribute in form.xml.
The basic syntax of an exec-phase
can be seen below:
<exec-phase id="add-data">
	<exec name="tcl|perl|java|javascript or nashorn" | executable="/path/to/bin" | executable="executable_name"failOnError="true|false" failOnStdErr="true|false" warn="[WARN]" error="[ERROR|ERR]" fatal="[FATAL]">
		<arg value="${<function>(<args>)}"/>
		<arg value="-freeText" />
		<arg value="${<predefinedVars>}" />
		<arg value="versions" />
		<arg value="-myTag"/>
		<arg tag="myTag"/>
		<env key="MY_VAR" value="SOME_VALUE"/>
	</exec>
	<exec ... />
	<exec-tool name="another_data_provider">
		<param key="<tagName>" value="<value>" />
		<param key="<tagName>" tag="<tag>" />
		<param ... />
	</exec-tool>
	<exec-tool ... >
		...
	</exec-tool>
</exec-phase>
The exec-phase
element accepts one or more launches of scripts or executables
specified in an exec
child element, that can receive arguments and environment
variables specified via arg
and env
elements.
There are four built-in languages for executables:
tcl
perl
java
javascript or nashorn
The scripts are launched using the tcl, perl, or java runtimes defined in your Squore installation. This is also the case for javascript, which is handled by Java's Nashorn engine.
The following attributes of the exec
element allow you to control error handling:
failOnError
(optional, default: true) marks the Data Provider execution as failed if the executable returns an error code
failOnStdErr
(optional, default: true) marks the Data Provider execution as failed if the executable prints something to stdErr during the execution
warn
,
error
and
fatal
(optional, default: see code block above) allow you to define patterns to look for in the executable's standard output to fine-tune the result of the execution.
Other executables can be called, as long as they are available on the system's PATH, or configured in
config.xml
Given the following config.xml:
<!-- config.xml (server or cli) -->
<?xml version="1.0" encoding="UTF-8" standalone="yes"?>
<squore type="server" version="1.3">
  <paths>
     <path name="python" path="C:\Python\python.exe" />
     <path name="git" path="C:\Git\bin\git.exe" />
  </paths>
...
</squore>
git and python can be called in your Data Provider as follows:
<exec-phase id="add-data">
	<exec executable="git">
		...
	</exec>
	<exec executable="python">
		...
	</exec>
</exec-phase>
Argument values can be:
Free text passed in a value
tag, useful to specify a parameter for your script
<exec executable="perl">
	<arg value="-V" />
</exec>
A tag key declared in form.xml passed as a tag
attribute to retrieve the input specified by the user. If no input was specified, you can define a defaultValue
:
<arg tag="maxValue" defaultValue="50" />
<arg tag="configFile" defaultValue="${getToolConfigDir(default.xml)}" />
One of the predefined functions
${getOutputFile(<relative/path/to/file>,<abortIfMissing>)} returns the absolute path of an input-data.xml file output by an exec-phase
. failIfMissing is an optional boolean which aborts the execution when set to true if the file is missing.
${getTemporaryFile(<relative/path/to/file>)} returns the absolute path of a temporary file created by an exec
(only for add-data and repo-add-data phases)
${getToolAddonsDir(<relative/path/to/file>)} returns the absolute path of a file in the Data Provider's addons folder
${getToolConfigDir(<relative/path/to/file>)} returns the absolute path of a file in the Data Provider's configuration folder
${path(<executable_name>)} returns the absolute path of an executable configured in config.xml, or just the executable name
if the executable is available from the system's PATH.
<exec executable="...">
	<arg value="-git_path" />
	<arg value="${path(git)}" />
One of the predefined variables
${tmpDirectory} to get an absolute path to a temp folder to create files
${sourcesList} to get a list of the aliases and locations containing the data extracted by the repository connectors used in the analysis
${outputDirectory} to get the absolute path of folder where the Data Provider needs to write the final input-data.xml
You can call and pass parameters to other Data Providers after your exec-phase
using an exec-tool
element.
The exec-tool
element uses a mandatory name
which is the name of the folder containing the other Data Provider
to launch in your configuration folder and supports passing the parameters expected by the other Data Provider via one or more param
elements where:
As an example, the following Data Provider generates a CSV file that is then passed to the pep8 Data Provider:
<exec-phase id="add-data">
	<exec executable="python">
		<arg value="consolidate-reports-recursive.py" />
		<arg value="-folders" />
		<arg tag="root_folder" />
		<arg value="-outputFile" />
		<arg value="output.csv" />
	</exec>
	<exec-tool name="pep8">
		<param key="csv" value="${getOutputFile(output.csv)}" />
		<param key="separator" tag="separator" defaultValue=";" />
	</exec-tool>
</exec-phase>
In this other example, a perl script is launched to retrieves issues from a ticketing system and the export data is passed to the import_ticket Data Provider:
<exec-phase id="add-data">
	<exec name="perl">
		<arg value="${getToolConfigDir(export_ticket.pl)}" />
		<arg value="-url" />
		<arg tag="url" />
		<arg value="-login" />
		<arg tag="login" />
		<arg value="-pwd" />
		<arg tag="pwd" />
		<arg value="-outputFile" />
		<arg value="${getOutputFile(exportdata.csv,false)}" />
	</exec>
	<exec-tool name="import_ticket">
		<param key="input_file" value="${getOutputFile(exportdata.csv)}" />
		<param key="csv_separator" value=";" />
	</exec-tool>
</exec-phase>
If your Data Provider uses a perl script, Squore provides a small library that makes it easy to retrieve script arguments called SQuORE::Args. Using it as part of your script, you can retrieve arguments using the get_tag_value() function, as shown below:
# name: export_ticket.pl
# description: exports issues to a CSV file
use SQuORE::Args;
# ...
# ...
my $url = get_tag_value("url");
my $login = get_tag_value("login");
my $pwd = get_tag_value("pwd");
my $outputFile = get_tag_value("outputFile");
# ...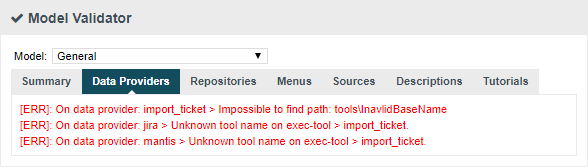
exit 0;If you want to find more examples of working Data Providers that use this syntax, check the following Data Providers in Squore's default configuration folder:
conf-checker calls a jar file to write an XML file in Squore's exchange format
import_ticket parses a file to translate it into a format that can then be passed to csv_import to import the tickets into Squore
jira retrieves data from Jira and passes it to import_ticket
The same syntax used to create Data Providers can be used to create Repository Connectors, and therefore instruct Squore to get source code from SCMs. Instead of using an
exec-phase
with the id="add-data"
, your Repository Connector should define the following phases:
id="import"
defines how you extract source code and make it available to Squan Sources so it can be analysed.
This phase is expected to return a path to a folder containing the sources to analyse or a data.properties file listing
the path to the folder containing source and various other properties to be used in other executions:
directory=/path/to/sources-to-analyse
data.<key1>=<value1>
data.<key2>=<value2>
This phase is executed once per source code node in the project and allows you to use the following additional variables:
${outputSourceDirectory} is the folder containing the sources to analyse
${alias} is the alias used for the source code node (empty if there is only one source code node)
id="repo-add-data"
is similar to the add-data phase described for Data Providers in
the section called “Running your Data Provider” and is expected to produce an input-data.xml. The only difference in the case of a Repository Connector is that this
phase is executed once per source code node in the analysis.
id="display"
is the phase that is called when users request to view the source code for an artefact from the web UI. This phase
is expected to return a data.properties file with the following keys:
filePath=/path/to/source/file
displayPath=<Artefact Display Path (optional)>
The contents of filePath will be loaded in the source code viewer, while the value of displayPath
will be used as the file path displayed in the header of the source code viewer.
This phase allows you to use the following additional variables:
${scaInfo} is text to display in the title bar of the source code viewer in the web interface
${artefactName} is the name of the file to display
${artefactPath} is the path (without the alias) of the file to display
During the display phase, you can retrieve any data set during the import phase for the repository using the ${getImportData(<key1>)} function
Consult SVN's form.xml in <SQUORE_HOME>/configuration/repositoryConnectors/SVN for a working example of a Repository Connector
that uses all the phases described above.
If you want your Data Provider to use the Squore toolkit to retrieve references to artefacts, the following variables are available
(in the add-data and repo-add-data phases only):
In order to use the toolkit, your exec
must use the tcl language. As an example, here is a sample
exec-phase
and associated tcl file to get you started:
 <!-- form.xml -->
<exec-phase id="repo-add-data">
	<exec name="tcl">
		<arg value="${getToolAddonsDir(repo-add-data.tcl)}" />
		<arg value="${tclToolkitFile}" />
		<arg value="${squanOutputDirectory}" />
		<arg value="${outputDirectory}" />
		<arg tag="xxx" />
	</exec>
</exec-phase>
#repo-add-data.tcl:
set toolkitFile [lindex $argv 0]
set sqOutputDir [lindex $argv 1]
set outputDir [lindex $argv 2]
set xxx [lindex $argv 3]

# Initialise the toolkit
puts "Initializing toolkit"
source $toolkitFile
toolkit::initialize $sqOutputDir $outputDir

# Execute your code
puts "Main execution"
# yout code here
# ...

# Generate xml files (artefacts)
puts "Generating xml files"
toolkit::generate $outputDir {artefacts}
In order to help you import data into Squore, the following Data Provider frameworks are provided and can
write a valid input-data.xml file for you:
csv_import (new in 18.0)
The csv_import framework allows you to write Data Providers that produce CSV files and then pass them on to the framework to be converted to an XML format that Squore understands. This framework allows you to import metrics, findings, textual information and links as well as generate your own artefacts. It is fully linked to the source code parser and therefore allows to locate existing source code artefacts generated by the source code parser (new in 18.0). Refer to the full csv_import Reference for more information.
xml (new in 18.0)
The xml framework is a sample implementation of a Data Provider that allows you to directly import an XML file or run it through an XSL transformation to that it matches the input format expected by Squore (input-data.xml). This framework therefore allows you to import metrics, findings, textual information and links as well as generate your own artefacts. Refer to the full xml Reference for more information.
If you are looking for the legacy Data Provider frameworks from previous versions of Squore, consult the section called “Legacy Frameworks”.
The legacy Data Provider frameworks are still supported, however using the new frameworks is recommended for developping new Data Providers, as they are more flexible and provide more functionality to interact with source code artefacts.
Table of Contents
Analysis Models define how metrics data is computed and aggregated. You can browse and analyse models through the Models > Viewer menu in the Squore web interface.
Analysis Models define building blocks organised in a hierarchical structure. The following blocks can be used:
Blocks can refer to each others, for example computations use measures and rules. The syntax used for computations is documented in Chapter 5, Expression Syntax.
In order to rate your project, you can define artefact types and aliases in Squore. The artefact types used in the default
configuration for source code are all defined
in <SQUORE_HOME>/configuration/models/Shared/data_provider/squan_sources/artefact_types.xml so
you can include them easily in your model. Here is a selection of the most common ones:
<ArtefactType id="CODE" heirs="PACKAGES;FILES;CLASSES;MODULES;CODE_SPECIFICATIONS" />
<ArtefactType id="PACKAGES" heirs="APPLICATION;SUB_APPLICATION;SOURCE_CODE;FOLDER" />
<ArtefactType id="FILES" heirs="FILE;HEADER" />
<ArtefactType id="SUB_FILES" heirs="CLASSES;MODULES;CODE_SPECIFICATIONS" />
<ArtefactType id="CLASSES" heirs="CLASS;FORTRAN_MODULE;SQL_CLASS" />
<ArtefactType id="MODULES" heirs="FUNCTION" />
<ArtefactType id="CODE_SPECIFICATIONS" heirs="JAVA_INTERFACE;ADA_SPACK;ADA_STASK;ADA_SPROTOBJ;ADA_PROTOBJ;ABAP_CLASSDEF;VBNET_INTERFACE" />
The root node of a project is always of type APPLICATION. The SUB_APPLICATION type is used as the type for the root node of a project that is a component of a meta-project only.
You can define any artefact type in your model by declaring them in the
artefactTypes
attribute of your analysis model's RootIndicator
, as shown below.
The following definition of the ROOT main indicator declares the types APPLICATION, FILE, CLASS, FUNCTION, REQUIREMENT,
TEST_PLAN, TEST_SUITE and TEST:
<RootIndicator artefactTypes="APPLICATION;FILE;CLASS;FUNCTION;REQUIREMENT;TEST_PLAN;TEST_SUITE;TEST" indicatorId="ROOT" />
In addition, you can define aliases to group types of artefacts together to use later when defining metrics in your analysis model. The
ArtefactType
definition below groups the artefacts defined above into CODE and DOCUMENT aliases:
<ArtefactType id="CODE" heirs="APPLICATION;FILE;CLASS;FUNCTION" />
<ArtefactType id="DOCUMENT" heirs="REQUIREMENT;TEST_PLAN;TEST_SUITE;TEST" />
This means that the long artefact declaration above can be rewritten as follows:
<RootIndicator artefactTypes="CODE;DOCUMENT" indicatorId="ROOT" />
You can use aliases everywhere in your configuration, except in properties files.
You can also use the ArtefactType
element with a manual
attribute to declare that some artefacts can be added manually by the user, as shown below:
<ArtefactType id="TEST_SUITE" parents="APPLICATION;TEST_SUITE;TEST_PLAN" manual="true" />
<ArtefactType id="TEST" parents="TEST_SUITE" manual="true" />
<ArtefactType id="TEST_PLAN" parents="APPLICATION" manual="true" />
<ArtefactType id="REQUIREMENT" parents="APPLICATION" manual="true" />
Manual artefacts can be added by users with the required permissions via a context menu in the Artefact Tree
The Measure
element defines the semantics of a single measure.
From a technical standpoint, a measure is merely a mapping between the information provided by the Data Provider and known Squore elements.
Base Measures only define the measure name and identifier,
whereas Derived Measures define how they are computed from other measures.
A Measure without computation is a base measure. The following two examples show how the SLOC (Source Lines Of Code)
base measure and the COMR (Comment Rate) derived measure are defined:
<Measure measureId="SLOC" targetArtefactTypes="APPLICATION;FILE" defaultValue="1" />
<Measure measureId="COMR" defaultValue="0">
	<Computation stored="true" targetArtefactTypes="APPLICATION;FOLDER;FILE;FUNCTION;CLASS;PROGRAM" result="(CLOC+MLOC)*100/(SLOC+CLOC)" />
</Measure>
The attributes allowed for the Measure
element are as follows:
measureId
(mandatory) is the unique identifier of the measure,
as used in the properties files[1]. Any alphanumerical value is accepted for this attribute as long as it is at least two characters and starts with a letter.
targetArtefactTypes
is the type of artefact targeted by the measure.
For more information about artefact types, consult the section called “Artefact Types”.
excludingTypes
allows refining targetArtefactTypes
to exclude certain types that may have been included via an alias. You can for example specify that a metric exists for all JAVA types except for JAVA_INTERFACE with the following syntax:
<Measure measureId="TEST_COVERAGE" defaultValue="-1">
	<Computation targetArtefactTypes="PACKAGES;JAVA" excludingTypes="JAVA_INTERFACE" result="IF(IS_DP_OK(JACOCO),TST_COV,-1)" />
</Measure>
defaultValue
(optional, default: not set) sets the default value to be used if no value is found for this metric.
usedForRelaxation
(optional, default: false) indicates that the measure is used in this model to indicate whether an
artefact is relaxed of excluded. Note that only one measure per artefact type in your model can use this attribute.
stored
(optional, default: true) defines whether a base measure's value is stored in the database (true) or discarded (false) after an analysis.
suffix
(optional, default: empty) is the label displayed after the value of the metric in the UI
dataBounds
(optional, default: none) allows
specifying which range of values should be considered valid for this measure (currently this applies to the Indicator Tree and the Measures tab only).
invalidValue
(optional, default: -) is the text
that should be displayed when an invalid value is set for the measure (currently this applies to the Indicator Tree and the Measures tab only).
noValue
(optional, default: ?) is the text
displayed when no value exists for this metric in the database (currently this applies to the Indicator Tree and the Measures tab only).
format
(optional, default: NUMBER) is the format used to display the
value of the measure in the UI. Each supported format has additional parameters, as described below:
- format="NUMBER": (default)
   + pattern="Java Number Pattern"
   + decimals=""
   + roundingMode=""

- format="PERCENT":
   + decimals=""
   + roundingMode=""

- format="MAN_DAYS" (new in 18.0)
- format="MAN_HOURS" (new in 18.0)
- format="MAN_MINUTES" (new in 18.0)
- format="MAN_SECONDS" (new in 18.0)
- format="MAN_MILLISECONDS" (new in 18.0)

- format="DAYS" (new in 18.0)
- format="HOURS" (new in 18.0)
- format="MINUTES" (new in 18.0)
- format="SECONDS" (new in 18.0)
- format="MILLISECONDS" (new in 18.0)

- format="INTEGER":
   + roundingMode=""

- format="DATE|TIME|DATETIME":
   + pattern="Java Date Pattern"
   + dateStyle="" (only for DATE and DATETIME)
   + timeStyle="" (only for TIME and DATETIME)
pattern
accepts any Java DecimalFormat or SimpleDate Pattern.
Refer to http://docs.oracle.com/javase/6/docs/api/java/text/DecimalFormat.html and http://docs.oracle.com/javase/6/docs/api/java/text/SimpleDateFormat.html for more information.
decimals
(optional, default: 0) is the number of decimals places to be used for displaying values
roundingMode
(optional, default: HALF_EVEN)
defines the behaviour used for rounding the numerical values displayed. The supported values are:
CEILING to round towards positive infinity.
DOWN to round towards zero.
FLOOR to round towards negative infinity.
HALF_DOWN to round towards "nearest neighbour" unless both neighbours are equidistant, in which case round down.
HALF_EVEN to round towards the "nearest neighbour" unless both neighbours are equidistant, in which case, round towards the even neighbour.
HALF_UP to round towards "nearest neighbour" unless both neighbours are equidistant, in which case round up.
UP to round away from zero.
For more examples of rounding mode, consult http://docs.oracle.com/javase/6/docs/api/java/math/RoundingMode.html.
dateStyle
(optional, default: DEFAULT): the date formatting style,
used when the displayType is one of DATE or DATETIME.
timeStyle
(optional, default: DEFAULT): the time formatting style,
used when the displayType is one of DATETIME or TIME. See above for available styles.
The attributes allowed for the Computation
element are as follows:
targetArtefactTypes
is the type of artefact targeted by this definition.
For more information about artefact types, consult the section called “Artefact Types”.
stored
(optional, default: true) defines whether a derived measure's value is stored in the database (true) or discarded (false) after an analysis.
result
specifies how the measure is computed from other metrics values.
Identifiers used in the result are measureIds, and the syntax is described in Chapter 5, Expression Syntax.
The measure defined is then used with its identifier, prefixed with B. for base measures, or prefixed with D. for derived measures. The following example shows the use of a derived measure for a computation:
<Computation targetArtefactTypes="APPLICATION;FOLDER;FILE;CLASS;FUNCTION" result="(D.MET_OKR+D.RULE_OKR)/2" />
Tip: Inheritance
Analysis models support inheritance and overriding of metrics according to the following rules:
If a metric is defined twice for a type, the first definition takes priority for this artefact type. An INFO message is displayed in the Validator to inform you that a definition is overriden by another one.
A metric definition for a specific type overrides a metric definition for a more generic type (typically an alias).
As a result, the following definitions are allowed in your Bundle.xml:
Specifying a different computation for one sub-type
<ArtefactType id="MODULES" heirs="FUNCTION" />
<ArtefactType id="FUNCTION" heirs="C_MODULES;PHP_MODULES;JAVA_MODULES" />
<Measure measureId="VG" defaultValue="1">
	<Computation targetArtefactTypes="MODULES" result="CCN+TERN+OREL+ANTH+CABL-(CASE+DEF)" />
	<Computation targetArtefactTypes="PHP_MODULES" result="CCN+TERN+OREL+ANTH" />
</Measure>
Overriding a computation imported from another file by specifying it before the file import
<?xml version="1.0" encoding="UTF-8"?>
<Bundle xmlns:xi="http://www.w3.org/2001/XInclude">
(...)
	<Measure measureId="COMR" defaultValue="0">
		<Computation targetArtefactTypes="CODE" result="IF(ELOC+CLOC=0,-1,(CLOC+MLOC)/(ELOC+CLOC))" />
	</Measure>
	<xi:include href="../../Shared/basic_definitions/comr.xml" />
</Bundle>
Rules are a specific type of measure. They do not return a numeric value like other measures, but the location within the source code where the rule was broken. Squore does not define any rule by itself, but requires a mapping between the rules defined in the external tools[2] that provide the compliance measure and internal concepts (and properties files).
An example of rule definition is provided below:
<Measure measureId="R_NOGOTO" type="RULE" categories="SCALE_SEVERITY.REQUIRED;SCALE_PRIORITY.HIGH" families="REQUIRED;ANALYSABILITY;MISRA;CF;STRP" targetArtefactTypes="FUNCTION" defaultValue="0" />
The attributes allowed for the Measure
element of type rule are as follows:
measureId
is the unique identifier of the rule, as used in the properties files.
toolName
(optional, default: empty) is the name of the tool, e.g. FindBugs, SQuORE, CPPTEST that submitted this metric, to be displayed in the Findings tab. It is generally only specified when you are defining a metric as a rule that will trigger a finding.
toolVersion
(optional, default: empty) is the tool version displayed together with the toolName
in the Findings tab.
categories
defines the scale level returned by Squore when the rule is violated.
families
puts tags on the measure. A common tag is TAB, which displays the rule in the user interface.
targetArtefactTypes
is the type of artefact targeted by this definition.
For more information about artefact types, consult the section called “Artefact Types”.
defaultValue
sets the default value to be used if no value is found for this metric.
manual
(optional, default: false) is used when you want to define a rule that
can be added manually to an artefact in the artefact tree. Manual findings can be added by users with the required permissions via a context menu in the Artefact Tree.
A simple way to override a rule that is defined somewhere in your model is to use an
UpdateRules
section in your Analysis bundle:
<UpdateRules>
	<UpdateRule measureId="R_NOGOTO" disabled="true" categories="SCALE_SEVERITY.CRITICAL"/>
</UpdateRules>
This syntax allows you to import a ruleset from the Shared folder and modify some of the rules if they do not fit your target model.
The UpdateRules
element takes one or more UpdateRule
elements where you need to define:
Scales define grades and boundaries for measures, in order to translate them into more understandable information. The ScaleLevel sub-element defines the ranges in the scale.
<Scale scaleId="SCALE_EC">
	<ScaleLevel levelId="UNKNOWN" bounds="];0["  rank="-1" />
	<ScaleLevel levelId="LEVELA" bounds="[0;0]"  rank="0" />
	<ScaleLevel levelId="LEVELB" bounds="]0;1]" rank="1" />
	<ScaleLevel levelId="LEVELC" bounds="]1;2]" rank="2" />
	<ScaleLevel levelId="LEVELD" bounds="]2;3]" rank="3" />
	<ScaleLevel levelId="LEVELE" bounds="]3;4]" rank="4" />
	<ScaleLevel levelId="LEVELF" bounds="]4;5]" rank="5" />
	<ScaleLevel levelId="LEVELG" bounds="]5;]"  rank="6" />
</Scale>
In this example, the scale SCALE_EC associates different levels to a measured value:
If the measured value is less than 0, the levelId is UNKNOWN with ranking -1.
If the measured value is exactly 0, the levelId is A with ranking 0.
If the measured value is between 0 (excluded) and 1 (included), the levelId is B with ranking 1.
If the measured value is between 1 (excluded) and 2 (included), the levelId is C with ranking 2.
If the measured value is between 2 (excluded) and 3 (included), the levelId is D with ranking 3.
If the measured value is between 3 (excluded) and 4 (included), the levelId is E with ranking 4.
If the measured value is between 4 (excluded) and 5 (included), the levelId is F with ranking 5.
If the measured value is more than 5 (excluded), the levelId is G with ranking 6.
The use of unions in scale bounds has been deprecated since Squore 16.0. You now need to use two distinct scale levels, as shown in the following example:
Old syntax:
<Scale scaleId="SCALE_EC2">
	<ScaleLevel levelId="LEVEL_IN" bounds=" ]0;10[|]10;100[" rank="0"/>
	<ScaleLevel levelId="LEVEL_OUT" bounds="[10;10]" rank="1"/>
</Scale>
Current syntax:
<Scale scaleId="SCALE_EC2">
	<ScaleLevel levelId="LEVEL_IN_LOW" bounds=" ]0;10[" rank="0"/>
	<ScaleLevel levelId="LEVEL_OUT" bounds="[10;10]" rank="1"/>
	<ScaleLevel levelId="LEVEL_IN_HIGH" bounds=" ]10;100[" rank="0"/>
</Scale>
Scales can be overridden for a specific artefact type, as shown below:
<Indicator indicatorId="VG" measureId="VG" scaleId="VG" targetArtefactTypes="CODE" />
<Scale scaleId="VG">
	<ScaleLevel levelId="UNKNOWN"	bounds="];0[" rank="-1" />
	<ScaleLevel levelId="GREEN"	bounds="[0;6]" rank="0" />
	<ScaleLevel levelId="YELLOW"	bounds="]6;10]" rank="1" />
	<ScaleLevel levelId="RED" bounds="]10;[" rank="2" />
</Scale>

<Scale scaleId="VG" targetArtefactTypes="COBOL_PROGRAM">
	<ScaleLevel levelId="UNKNOWN"	bounds="];0[" rank="-1" />
	<ScaleLevel levelId="GREEN"	bounds="[0;10]" rank="0" />
	<ScaleLevel levelId="YELLOW"	bounds="]10;20]" rank="1" />
	<ScaleLevel levelId="RED" bounds="]20;[" rank="2" />
</Scale>
The scale VG applies to all artefacts of type CODE, however,
for artefacts of type COBOL_PROGRAM, the scale levels have different bounds than for other types (as
specified via the targetArtefactTypes
attribute).
You can use scale macros in order to avoid duplicating a scale and use parameters ({0}, {1}...) to define the scale level thresholds:
<ScaleMacro id="RGB">
	<ScaleLevel levelId="UNKNOWN"	bounds="];0[" rank="-1" />
	<ScaleLevel levelId="GREEN"	bounds="[0;{0}]" rank="0" />
	<ScaleLevel levelId="YELLOW"	bounds="]{0};{1}]" rank="1" />
	<ScaleLevel levelId="RED" bounds="]{1};[" rank="2" />
</ScaleMacro>
Scales defined by a macro and its parameters are then specified as shown below:
<Scale scaleId="VG" macro="RGB" vars="6;10" />
<Scale scaleId="VG_REVERSED" macro="RGB" vars="10;6" />
The UNKNOWN level receives special treatment when it comes to showing a trend:
When the rank goes from the UNKNOWN level to any other level, the trend is shown as:

When the rank goes from any level to UNKNOWN, the trend is shown as:

The Scale
element accepts the following attributes:
targetArtefactTypes
(optional) the specific artefacts that this scale applies to. If this attribute
is omitted, then the value of targetArtefactTypes
specified for the indicator using this scale is used.
macro
(optional) specifies the id of the ScaleMacro used to define this scale
vars
(optional) is a semicolon-separated list of parameters to pass to the ScaleMacro to define this scale
isDynamic
(optional, default: false) whether the scale levels are dynamic or not. Read more about the concept of dynamic scales in the section called “Dynamic Scales”.
Scale levels are defined using one or more ScaleLevel
sub-elements,
with the following attributes:
levelId
(mandatory) the unique identifier of the scale level.
bounds
(mandatory) the value limits for this scale level.
Infinite bounds can be specified by omitting the number, e.g.: [0;[ or [0;] for any null or positive number.
rank
(mandatory) the weight of the scale which is used when aggregating values.
The levelIds are then mapped to their language-specific attributes in a properties file.
For the previous example, the file PerformanceLevels_en.properties gives the following mapping:
LOP.LEVELA.MNEMO=A
LOP.LEVELA.NAME=Level A
LOP.LEVELA.COLOR=0,81,0
LOP.LEVELA.IMAGE=../Shared/Images/images/perfA.png
LOP.LEVELA.ICON=../Shared/Images/icons/perfA.png
The trend icons (new, improved, deteriorated and stable) that appear in the artefact tree and the dashboard tables can also be customised in a properties file as shown below:
EVO.TREE_NEW.ICON=Description/new.png
EVO.TREE_DOWN.ICON=Description/down.png
EVO.TREE_UP.ICON=Description/up.png
EVO.TREE_EQUAL.ICON=Description/equal.png

EVO.TABLE_NEW.ICON=Description/new.png
EVO.TABLE_DOWN.ICON=Description/down2.png
EVO.TABLE_UP.ICON=Description/up2.png
EVO.TABLE_EQUAL.ICON=Description/equal.png
Indicators associate a measure with a scale.
<Indicator indicatorId="ROKR_REQ" measureId="ROKR_REQ" scaleId="SCALE_DECILE" families="TAB" displayTypes="VALUE;LEVEL" />
The attributes allowed in the Indicator
tag are the
following:
indicatorId
(mandatory) the unique identifier of the indicator being defined.
measureId
(mandatory) the unique identifier of the measure to map.
scaleId
(mandatory) the unique identifier of the scale to be used for the measure.
targetArtefactTypes
(optional) is the type of artefact targeted by this indicator.
For more information about artefact types, consult the section called “Artefact Types”. If you do not define a target artefact type for an
indicator, then the types specifed for the measure or the scale associated with the indicator are used.
families
(optional) the families associated with the indicator.
displayTypes
(optional, default: empty) specifies which details
relative to the indicator should be displayed in the Indicator tree on the left of the dashboard. The accepted values are
LEVEL to display the level name of the indicator after its name
VALUE to display the actual value of the metric associated to the indicator after its name
displayedScale
(optional) allows displaying an alternate scale in the indicator details popup in
the Explorer instead of the real scale associated with the indicator. This is generally useful when you are using a
complicated scale internally but you want to show something simpler to your users instead (when using dynamic scales for example).
This attribute accepts any valid scale ID from your model.
displayedValue
(optional) allows displaying an alternate measure in the indicator details popup in
the Explorer instead of the real measure associated with the indicator. This is generally useful when you are using a
measure internally that would not make sense to end users but you want to show something simpler instead (when using dynamic scales for example).
This attribute accepts any valid measure ID from your model.
In order to quickly define an indicator using the same value for indicatorId
,
measureId
and scaleId
you can use this quick notation syntax:
<Indicator indicatorId="TEST_COVERAGE" />
Squore will automatically assume that measureId and scaleId for this indicator are also TEST_COVERAGE.
Advanced Examples
Defining a single indicator that uses different measures depending on the type of artefact:
<Indicator indicatorId="WEIGHTED_NCC" measureId="WEIGHTED_NCC" targetArtefactTypes="CLASSES;MODULES;CODE_SPECIFICATIONS" />
<Indicator indicatorId="WEIGHTED_NCC" measureId="WEIGHTED_NCC_DENSITY" targetArtefactTypes="PACKAGES;FILES" />
Defining a single indicator that uses different scales depending on the artefact type:
<Indicator indicatorId="COMPLEXITY" targetArtefactTypes="APPLICATION;SOURCE_CODE;FOLDER;FILES;CLASSES;MODULES;CODE_SPECIFICATIONS"/>

<Measure measureId="COMPLEXITY" targetArtefactTypes="APPLICATION;SOURCE_CODE;FOLDER;FILES;CLASSES;MODULES;CODE_SPECIFICATIONS" defaultValue="-1">
	<Computation targetArtefactTypes="CLASSES;MODULES;CODE_SPECIFICATIONS" result="..." />
	<Computation targetArtefactTypes="APPLICATION;SOURCE_CODE;FOLDER;FILES" result="..." />
</Measure>

<Scale scaleId="COMPLEXITY" macro="TRAFFIC_LIGHT" vars="5;30" targetArtefactTypes="APPLICATION;SOURCE_CODE;FOLDER;FILES" />
<Scale scaleId="COMPLEXITY" macro="TRAFFIC_LIGHT" vars="20;200" targetArtefactTypes="CLASSES;MODULES;CODE_SPECIFICATIONS" />
An indicator must be specified as the root indicator for a each artefact type. The root indicator is the top-level mark displayed next to an artefact in the artefact tree.
<RootIndicator indicatorId="MAINTAINABILITY" artefactTypes="APPLICATION;FILE;FUNCTION" />
indicatorId
the unique identifier of the indicator chosen as root.
artefactTypes
is the type of artefact for which this indicator is the root indicator. It is one or
more of APPLICATION, SOURCE_CODE, FOLDER, FILE, CLASS, PROGRAM, FUNCTION, or any other type defined for your project. Note that the indicator
must exist for all the types of artefacts specified.
A root indicator must be based on a derived measure, not a base measure. If the measure you want to use as an indicator is a base, add a dummy derived measure as shown below.
Before:
<Measure id="ROOT" targetArtefactTypes="TYPE" defaultValue="0" />
After:
<Measure id="ROOT" targetArtefactTypes="TYPE" defaultValue="0">
	<Computation targetArtefactTypes="SOME_OTHER_TYPE" result="B.ROOT" />
</Measure>
In order to allow users to relax or exclude artefacts from the projects from the Artefact Tree, you need to reserve one measure that uses a special attribute used for relaxation and specify to which artefact types it applies.
The following is a basic example of how to allow users to relax folders and files in your model:
<!-- myModel/Analysis/Bundle.xml -->
<ArtefactType id="RELAXABLE" heirs="FOLDER;FILES" />
<Measure measureId="RELAX" targetArtefactTypes="RELAXABLE" defaultValue="0" usedForRelaxation="true" />
By adding these two lines in your model, you allow users whose role grant the View Drafts of Projects and Modify Artefacts privileges to use the relaxation mechanism. For more information about using artefact relaxation from the web UI, consult the Getting Started Guide or the online help.
Impact on computations
When an artefact is relaxed, its metrics are ignored when computing metrics for other artefacts. This makes sense for example when relaxing a folder full of third-party code, because you may not want the total number of software lines of code to include third-party code.
In other situations, it does not make
sense to exclude all metrics from relaxed artefacts: If you are analysing components of a system and aggregate
memory usage information up to the application level for example, third-party components for which you relax source code issues
should still be part of the total memory usage for the system. In the latter case, you can use the
continueOnRelaxed
attribute to indicate that some or all measures should be included
in computations even if the artefact has been relaxed. This is explained in the two examples below.
In the following code continueOnRelaxed
is set to true
for the metric used to mark artefacts as relaxed (usedForRelaxation
). As a result, all measures of the
relaxed artefact are included in computations for other artefacts:
<ArtefactType id="RELAXABLE" heirs="FOLDER;FILES" />
<Measure measureId="RELAX" targetArtefactTypes="RELAXABLE" usedForRelaxation="true" continueOnRelaxed="true" defaultValue="0" />
In the following code, continueOnRelaxed
is set to true at computation-level.
As a result, the measure MEMORY is included in computations
even when the artefact is relaxed. No other measures are included in computations for relaxed artefacts, since
continueOnRelaxed
is omitted from the definition of RELAX:
<ArtefactType id="RELAXABLE" heirs="FOLDER;FILES" />
<Measure measureId="RELAX" targetArtefactTypes="RELAXABLE" usedForRelaxation="true" defaultValue="0" />
<Measure measureId="MEMORY" defaultValue="0">
	<Computation targetArtefactTypes="APPLICATION;FODLER" result="SUM FILE.MEMORY FROM DESCENDANTS" continueOnRelaxed="true"/>
</Measure>
Only artefacts of type FOLDER and FILES should be relaxable. If you
need to find out if an artefact is relaxed in your model, you can use the IS_RELAXED_ARTEFACT() function
described in the section called “Conditional and Level-Related Functions”.
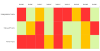
Squore allows you to define links between artefacts. The links are generally created by Data Providers in your model (see the section called “Creating your own Data Providers and Repository Connectors”), and are displayed automatically in tables on the dashboard, as shown below:
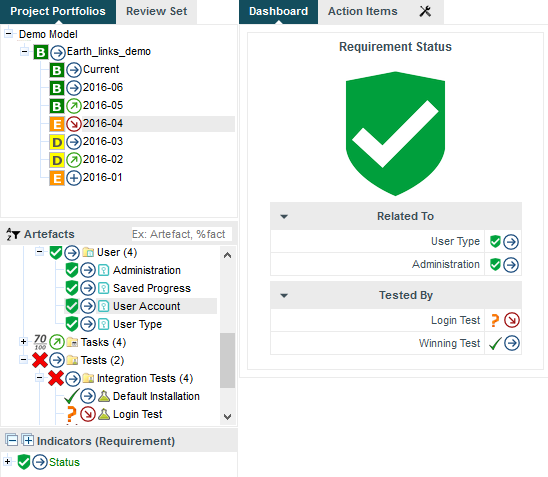
Links to related requirements and tests in the scorecard of a requirement
Links in the scorecard can be clicked to navigate to the target artefact directly.
For more information about advanced display options for links, consult the section called “Scorecard Tables”.
Basic links are declared in the analysis model using a Links
element, which accepts the following attributes:
id
(mandatory) is the unique identifier for the link type in your model
srcArtefactTypes
(optional, default: any) is a list of possible artefact types that can generate inbound links for this type of link.
dstArtefactTypes
(optional, default: any) is a list of possible artefact types that this type of link can link create outbound links to.
The links shown in the picture above can be defined as follows:
<Link id="TEST" srcArtefactTypes="REQUIREMENT" dstArtefactTypes="TEST_CASE" />
<Link id="RELATED_REQ" srcArtefactTypes="REQUIREMENT" dstArtefactTypes="REQUIREMENT" />
It is not strictly necessary to declare all your basic link types in the analysis model, but doing so allows you to use a condition in the LINKS() function, which you can read about in the section called “Conditional and Level-Related Functions”.
You can also create advanced links in your analysis model by declaring computed links,. Computed links allow you to add conditions to the source and destination artefacts and create links that follow artefacts recursively, which are a great way to implement traceability between artefacts. Here are a few examples of computed links:
Provide links to all complex functions at application level:
<ComputedLink id="COMPLEX_MODULES"> <StartPath srcArtefactTypes="APPLICATION" scope="DESCENDANTS" dstArtefactTypes="MODULES" dstCondition="VG > 10" /> </ComputedLink>
You can then use this link to display a treemap of all complex functions at application level in your dashboard:
<chart type="TREEMAP" id="TREEMAP_LINK_EXAMPLE" linkType="COMPLEX_FUNCTIONS" colorFromIndicator="ROOT">
	<measure>SLOC</measure>
</chart>
Provide links at application level to all complex functions in files with over 100 lines of code:
<ComputedLink id="LARGE_FILES_WITH_COMPLEX_FUNCTIONS"> <StartPath srcArtefactTypes="APPLICATION" scope="DESCENDANTS" dstArtefactTypes="FILE" dstCondition="SLOC > 100" /> <NextPath scope="DESCENDANTS" dstArtefactTypes="MODULES" dstCondition="VG > 10" /> </ComputedLink>
Provide links from high level requirements to tests linked to lower level requirements: A data provider provides a basic link between requirements and tests, and a basic link between related requirements. The model recursively traverses the hierarchy of requirements to link the highest-level requirement artefact to the test artefact attached lower-level requirements.
<!-- Define basic link between requirement artefacts (REQUIREMENT) -->
<Link id="REQ" srcArtefactTypes="REQUIREMENT" dstArtefactTypes="REQUIREMENT" />
<!-- Define basic links between a requirement artefact (REQUIREMENT) and a test artefact (TEST) -->
<Link id="TESTED_BY" srcArtefactTypes="REQUIREMENT" dstArtefactTypes="TEST" />
<!-- Compute link from requirement to test recursively:
	1. Follow REQ links recursively
	2. Follow link from requirement to test
	Result:
	- A link is created from the top requirement to the test
	- Intermediate links are kept between all traversed artefacts -->
<ComputedLink id="REQ_TO_TEST">
	<StartPath link="REQ" recurse="TRUE" keepIntermediateLinks="TRUE" />
	<NextPath link="TESTED_BY" />
</ComputedLink>
Provide links at application level to requirements with failing tests in highly complex modules: A data provider provides a basic link between requirements and tests and a basic link between a test and the tested code. The model dynamically computes the requirements with failing tests and provides links at application level to the unsatisfied requirements involving functions with a cyclomatic complexity greater than 10.
<!-- Define basic links between code/test and test/requirement --> <Link id="TESTED_BY" srcArtefactTypes="MODULES" dstArtefactTypes="TEST" /> <Link id="SATISFIES" srcArtefactTypes="TEST" dstArtefactTypes="REQUIREMENT" /> <!-- Compute link between complex code failing tests and associated requirement: 1. Find all complex modules under application 2. Follow the link to the associated test if the test is failing 3. Follow the link to the associated requirement --> <ComputedLink id="FAILING_REQ_RISK"> <StartPath srcArtefactTypes="APPLICATION" scope="DESCENDANTS" dstArtefactTypes="MODULES" dstCondition="VG > 10" /> <NextPath link="TESTED_BY" dstCondition="IF(FAILED)" /> <NextPath link="SATISFIES" /> </ComputedLink>
Provide links at application level to all change requests artefacts addressed in the git commit used for the analysis: A data provider parses git logs to create a basic link between a commit ID and the CR it fixes and another basic link between the commit ID and the code it impacts. The model then dynamically computes a changelog of CRs fixed in the commit ID specified for this analysis, with links to individual CR artefacts clickable at application level.
<!-- Available artefact types:
- a GIT_COMMIT is an artefact with textual information for COMMIT_ID
- APPLICATION was provided GIT_COMMIT as textual information
- each change request was imported in the project as a CR artefact

<!-- Define basic links based on git commit information -->
<Link id="FIXES" srcArtefactTypes="GIT_COMMIT" dstArtefactTypes="CR" />
<Link id="CHANGED_FILE" srcArtefactTypes="FILES" dstArtefactTypes="GIT_COMMIT" />

<!-- Compute links between source code files and CRs:
	1. If a commit ID was specified at application level, find all file descendants
	2. If the commit ID matches the one at application level, follow the link to the commit
	3. Reach the CR and use it as the endpoint for the link from the application level -->
<ComputedLink id="CHANGELOG">
	<StartPath srcArtefactTypes="APPLICATION" srcCondition="NOT(EQUALS(COMMIT_ID, ''))" scope="DESCENDANTS" dstArtefactTypes="FILES" />
	<NextPath link="CHANGED_FILE" dstCondition="EQUALS(APP(COMMIT_ID), COMMIT_ID)" />
	<NextPath link="FIXES" />
</ComputedLink>
A ComputedLink
always has a starting point defined with a StartPath
element and
one or more optional NextPath
elements designed to keep following links as needed.
The full syntax for ComputedLink
is as follows:
The full syntax for StartPath
and NextPath
is as follows:
link
or
scope
(mandatory)
define the type of relationship between the artefacts to follow:
Use link="BASIC_LINK_ID" to follow a relationship already defined by a basic link (using a computed link inside the definition of another computed link is not supported)
Use scope="CHILDREN|DESCENDANTS" to follow a relationship between an artefact and its children only or all its descendants
srcArtefactTypes
and
dstArtefactTypes
(optional for link, mandatory for scope in StartPath
)
define the source and destination artefact types that should be used as endpoints for the computed link.
When using link="BASIC_LINK_ID", the source and target artefact types are taken from the
definition of BASIC_LINK_ID. Note that these attributes are not necessary in a NextPath
definition.
srcCondition
and
dstCondition
(optional, default: no condition) allow setting a condition for the
source or destination artefact. You can use any computation that will be evaluated for each potential endpoint of the computed link
to filter it out and skip creating a link when the condition is not met.
recurse
(optional, default: false)
allows to keep looking for destination artefacts recursively to create more links. This attribute can only be used with
link
relationships.
keepIntermediateLinks
(optional, default: false) saves all links created between
artefacts by following this path when set to true. By default or when set to false, only one link is created between the source and destination artefacts.
This attribute is only taken into account when recurse
is set to true.
dstToSrc
(optional, default: false) allows reversing the link direction. It is assumed by default that the link goes
from the source artefact towards the target artefact. Set this attribute to true to define that the link should go from the target artefact towards source one.
Constants are used to resolve a symbol to a number. They are defined with the Constant
XML tag.
<Constant id="HIS_MET" value="12" />
Two attributes are required to define a constant:
A constant can then be used in a computation by prefixing it with C., e.g.:
<Computation targetArtefactTypes="APPLICATION;FOLDER;FILE;CLASS;FUNCTION" result="100*(1-(MET_KO/C.HIS_MET))" />
A constant can also be used in a scale level. Note that in this kind of usage, the constant ID does note require a prefix, as shown below:
<ScaleLevel levelId="LEVELG" bounds="]5;]" rank="HIS_MET" />
Dynamic scales are scales whose levels use measures instead of absolute bounds. They are useful when one metric has a different meaning according to the context in which it is read. In software development for example, you may accept a certain amount of specification changes at one stage of the process, but completely want to prohibit it at another stage. This section takes you through an example that can be implemented easily in your model with the use of dynamic scales.
What we want to guarantee with our dynamic scale, is that during three different phases of development, our requirements stability indicator is evaluated differently, as represented below:
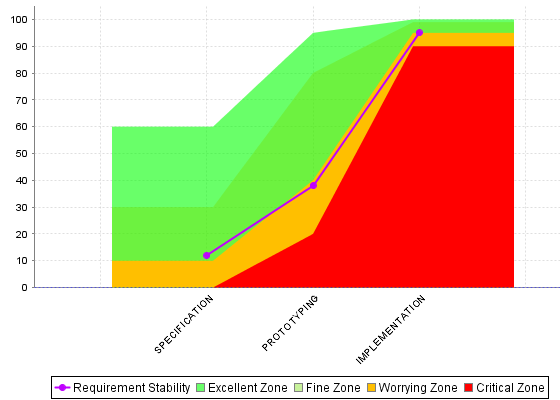
Requirement Stability by Development Phase.
The following is an example of a dynamic scale definition for a KPI that evaluates the stability of requirements as excellent, fine, worrying, critical or unknown:
<Scale scaleId="DYN_SCALE_REQ_STABILITY" isDynamic="true">
	<ScaleLevel levelId="DYN_EXCELLENT" bounds="[APP(EXCELLENT_THRESHOLD);["  rank="0" />
	<ScaleLevel levelId="DYN_FINE" bounds="[APP(FINE_THRESHOLD);APP(EXCELLENT_THRESHOLD)[" rank="1" />
	<ScaleLevel levelId="DYN_WORRYING" bounds="[APP(WORRYING_THRESHOLD);APP(FINE_THRESHOLD)[" rank="2" />
	<ScaleLevel levelId="DYN_CRITICAL" bounds="[APP(CRITICAL_THRESHOLD);APP(WORRYING_THRESHOLD)[" rank="3" />
	<ScaleLevel levelId="DYN_UNKNOWN" bounds="];APP(CRITICAL_THRESHOLD)[" rank="4" />
</Scale>
Compared with the examples of scales shown in the section called “Scales”, note
the use of the isDynamic
attribute and
how the bounds are expressed with measures instead of actual values.
The threshold measures can vary for each analysis and/or for each artefact type, and the scale may therefore be different as time goes by. There are two ways they could be set:
By using attributes at application levels so that users define the values of the thresholds manually.
By computing the thresholds during the analysis with IF(), CASE() or
other available functions described in the section called “Functions”
Here is an example setting the thresholds according to a PHASE attribute set by the user
before running an analysis (more information about attributes is available in the section called “Attributes”:
<!-- Attribute Definition in Wizard -->
<tag type="multipleChoice" name="Development Phase: " measureId="PHASE" defaultValue="SPECIFICATION" displayType="radioButton" targetArtefactTypes="APPLICATION">
	<value key="SPECIFICATION" value="1" />
	<value key="PROTOTYPING" value="2" />
	<value key="IMPLEMENTATION" value="3" />
</tag>

<!-- Metrics Definition in Analysis Model -->
<Measure measureId="PHASE" targetArtefactTypes="APPLICATION" defaultValue="0" />
<Constant id="PHASE_SPECIFICATION" value="1" />
<Constant id="PHASE_PROTOTYPING" value="2" />
<Constant id="PHASE_IMPLEMENTATION" value="3" />

<!-- Thresholds Computation in Analysis Model -->
<Measure measureId="EXCELLENT_THRESHOLD">
	<Computation targetArtefactTypes="APPLICATION"
		result="CASE(PHASE,
		C.PHASE_SPECIFICATION:60,
		C.PHASE_PROTOTYPING:95,
		C.PHASE_IMPLEMENTATION:100,
		DEFAULT:-1)"/>
</Measure>
<Measure measureId="FINE_THRESHOLD">
	<Computation targetArtefactTypes="APPLICATION"
		result="CASE(PHASE,
		C.PHASE_SPECIFICATION:30,
		C.PHASE_PROTOTYPING:80,
		C.PHASE_IMPLEMENTATION:99,
		DEFAULT:-1)"/>
</Measure>
<Measure measureId="WORRYING_THRESHOLD">
	<Computation targetArtefactTypes="APPLICATION"
		result="CASE(PHASE,
		C.PHASE_SPECIFICATION:10,
		C.PHASE_PROTOTYPING:40,
		C.PHASE_IMPLEMENTATION:95,
		DEFAULT:-1)"/>
</Measure>
<Measure measureId="CRITICAL_THRESHOLD">
	<Computation targetArtefactTypes="APPLICATION"
		result="CASE(PHASE,
		C.PHASE_SPECIFICATION:0,
		C.PHASE_PROTOTYPING:20,
		C.PHASE_IMPLEMENTATION:90,
		DEFAULT:-1)"/>
</Measure>
The final REQUIREMENTS_STABILITY indicator is associated with a static scale that uses the same ranks as the dynamic one,
and its value is assigned by retrieving the desired rank from the dynamic scale using the FIND_RANK() function:
<!-- Static scale to base the KPI on -->
<Scale scaleId="SCALE_REQ_STABILITY">
	<ScaleLevel levelId="EXCELLENT" bounds="[0;0]"  rank="0" />
	<ScaleLevel levelId="FINE" bounds="[1;1]" rank="1" />
	<ScaleLevel levelId="WORRYING" bounds="[2;2]" rank="2" />
	<ScaleLevel levelId="CRITICAL" bounds="[3;3]" rank="3" />
	<ScaleLevel levelId="UNKNOWN" bounds="[4;4]" rank="4" />
</Scale>

<!-- Indicator definition -->
<Indicator indicatorId="REQUIREMENTS_STABILITY" measureId="REQ_STABILITY_RANK" targetArtefactTypes="APPLICATION;FOLDER;FILE" scaleId="SCALE_REQ_STABILITY" />

<!-- The base measure that holds the actual raw value of Requirement Stability -->
<Measure measureId="REQUIREMENTS_STABILITY_METRIC" targetArtefactTypes="APPLICATION;FOLDER;FILE" defaultValue="0" />

<!-- A temporary measure to compute the rank of the metric on the dynamic scale -->
<Measure measureId="REQ_STABILITY_RANK">
	<Computation stored="false" targetArtefactTypes="APPLICATION;FOLDER;FILE" result="FIND_RANK(DYN_SCALE_REQ_STABILITY, REQUIREMENTS_STABILITY_METRIC)" />
</Measure>
For more information about the FIND_RANK() function, refer to the section called “Functions”.
When using dynamic scales, the scale and measure computed for an indicator may not make sense for the end user. In this case, you may
want to change what the user sees via the use of the displayedScale
and displayedValue
attributes in your indicator definition. For more information about this syntax, consult the section called “Indicators”.
This chapter details the concept of the decision model, and the methods available for building an action plan in Squore.
A Decision Model defines how to build an Action Plan in Squore. The list of action items triggered during an analysis defines the to-do list that can be followed to improve the quality of a project.
There are two types of decision models available in Squore:
If you have a precise idea of which actions items should be part of your action plan for your model, you can define a list of tests to run against the metrics generated when running an analysis to build an action plan. This type of action plan is described in the section called “Trigger-Based Action Plans”.
If you prefer to build an action plan automatically based on the findings found during the analysis, you can let Squore build a prioritised action plan according to the categories of findings which are most important to you. This type of action plan is described in the section called “Dynamic Action Plans”.
It is currently not possible to configure a decition model that uses both manually-set triggers and dynamic findings prioritisation.
The easiest way to instruct Squore to build a dynamic action plan for your model based on the
findings generated during an analysis is to ensure that your model folder contains no Decision/Bundle.xml file.
A list of the Top 40 valuable actions will be created for the project. This list is shown to all users
in the Action Items tab of the Explorer.
Part of the Top 40 valuable actions dynamically generated for a source code project
By default, action items are created based on findings in the project using these criteria:
Findings with the lowest remediation cost
Findings with the highest severity
Findings with the lowest number of occurrences
This can be specified in your Bundle.xml as follows:
$SQUORE_HOME/configuration/MyModelFolder/Decision/Bundle.xml:
<Bundle>
	<FindingsActionPlan limit="40">
		<CategoryCriterion type="COST" scaleId="SCALE_REMEDIATION" preferenceLevel="MEDIUM" excludeLevels="UNKNOWN;NONE" />
		<CategoryCriterion type="BENEFIT" scaleId="SCALE_SEVERITY" preferenceLevel="MEDIUM" excludeLevels="UNKNOWN;INFORMATION" />
		<OccurrencesCriterion type="COST" preferenceLevel="MEDIUM" />
	</FindingsActionPlan>
</Bundle>
Dynamic Action Plan Syntax
The FindingsActionPlan
element accepts the following attributes:
limit
(optional, default: 40) defines how many action items to generate
priorityScaleId
(optional, default: SC_DEFAULT_PLANNER_PRIORITY) defines the priority scale used
in the Action Items tab to distribute the action items. The default scale uses 20 levels to spread all the possible combinations of
remediation costs, severities and number of occurrences evenly. You can define your own scale with more or less levels and even or uneven
levels to distribute the combinations of possible action items.
There are three types of criteria that you can use to prioritise findings:
Each type of criterion accepts the following attributes:
scaleId
(mandatory, not supported for VariableCriterion)
is the scale to look up to build the criterion on.
indicatorId
(mandatory, only supported in VariableCriterion)
is the indicator to specify a VariableCriterion
type
(optional, default: COST)
defines which end of the scale to pull findings from in priority. Supported values are:
COST to get findings with the lowest rank on the scale turned into action items first. This makes sense on a remediation cost scale, where you want to fix findings with the lowest remediation cost first.
BENEFIT to get findings with the highest rank on the scale turned into action items first. This makes sense on a severity scale, where you want to fix findings with the highest severity first.
excludeLevels
(optional, default: none) allows excluding scale levels from
the criterion. This attribute allows a list of scale levels, as shown in the example above.
preferenceLevel
(optional, default: MEDIUM)
is used to weigh the criterion against the other criteria in the overall calculation of the action item's priority. Supported values are:
VERY_LOW
LOW
MEDIUM
HIGH
VERY_HIGH
Here is an example that expands on the default shown earlier to take into account the test coverage of artefacts and make sure that action items are generated mostly for artefacts with a high test coverage ratio. The scale used as well only contains five levels from P1 to P5 and will single out very high and very log priority items (the relevancy of an action item is a number between 0 and 100 that is measured against this scale to define the priority):
$SQUORE_HOME/configuration/MyModelFolder/Decision/Bundle.xml:
<Bundle>
	<FindingsActionPlan limit="40" priorityScaleId="SCALE_LEVEL_FIVE">
		<CategoryCriterion type="COST" scaleId="SCALE_REMEDIATION" preferenceLevel="MEDIUM" excludeLevels="UNKNOWN;NONE" />
		<CategoryCriterion type="BENEFIT" scaleId="SCALE_SEVERITY" preferenceLevel="MEDIUM" excludeLevels="UNKNOWN;INFORMATION" />
		<OccurrencesCriterion type="COST" preferenceLevel="MEDIUM" />
		<VariableCriterion type="BENEFIT" preferenceLevel="VERY_HIGH" indicatorId="TEST_COVERAGE" />
  </FindingsActionPlan>
<Bundle>

Where SCALE_LEVEL_FIVE is:
<Scale scaleId="SCALE_LEVEL_FIVE">
	<ScaleLevel levelId="P0" bounds="[0;5]" rank="0" />
	<ScaleLevel levelId="P1" bounds="]5;15]" rank="1" />
	<ScaleLevel levelId="P2" bounds="]15;65]" rank="2" />
	<ScaleLevel levelId="P3" bounds="]65;85]" rank="3" />
	<ScaleLevel levelId="P4" bounds="]85;95]" rank="4" />
	<ScaleLevel levelId="P5" bounds="]95;100]" rank="5" />
</Scale>
If you want to use a combination of metrics to trigger action plans instead of relying on prioritising findings, Squore allows building your own specification of triggers for action items. The following is an example of a Decision Bundle where an action item is based on specific triggers:
<?xml version="1.0" encoding="utf-8" standalone="yes"?>
<Bundle>
	<DecisionCriteria>
		<DecisionCriterion dcId="DR_FU_UNTESTABLE" categories="SCALE_PRIORITY.MEDIUM" roles="DEVELOPER;PROJECT_MANAGER" targetArtefactTypes="FUNCTION">
			<Triggers>
				<Trigger>
					<Test expr="IS_CRITICAL_COMPONENT" />
					<Test expr="VG" bounds="[20;[" descrId="UNTESTABLE_VG" p0="#{MEASURE.VG}" />
					<Test expr="NEST" bounds="[4;[" descrId="UNTESTABLE_NEST" p0="#{MEASURE.NEST}" />
					<Test expr="NPAT" bounds="[800;[" descrId="UNTESTABLE_NPAT" p0="#{MEASURE.NPAT}" />
				</Trigger>
				<Trigger>
					<Test expr="VG" bounds="[50;[" descrId="UNTESTABLE_VG" p0="#{MEASURE.VG}" />
				</Trigger>
			</Triggers>
		</DecisionCriterion>
	</DecisionCriteria>
</Bundle>
A DecisionCriterion
is an action item definition.
At least one Trigger
must be true to trigger the automatic generation
of an action item on an artefact whose type is defined in the targetArtefactTypes
attribute of a DecisionCriterion
. A trigger is true when all its tests evaluate to true.
When using the role
attribute for a DecisionCriterion
, you
limit the visibility of the Action Items defined to the roles listed only. If the attribute is not present, then
the action item is visible to all users who can view the project.
Remember that a decision criterion will evaluate its Triggers using OR, whereas a trigger will evaluate its Tests using AND.
Writing a Test
Writing a test, requires using the mandatory expr
attribute, which is the expression being tested for, in the form of a
computation. See Chapter 5, Expression Syntax for more details about the syntax to use.
The following optional attributes may also be used:
bounds
(optional, default: "[1;[") is the interval within which the computation result evaluates to true.
If omitted, it defaults to [1;[, meaning that your test
evaluates to true if it returns any positive value and false if it
returns 0 or a negative value. The syntax is the same as the one used for defining scaleLevel
bounds (see the section called “Scales”),
but you can also use some computations via the following syntax:
For constants: C.<constantId>
For measures: <measureId>
For application-level measures: APP(<measureId>)
As an example, the following bound definition is valid to trigger an action item:
bounds="[APP(LC);C.CST_X["
descrId
is description identifier used to set the description of this test.
p{X}
defines parameters of the description, use for example:
p0="#{MEASURE.VG}"and the description:
TST.{descrId}=The complexity is too high (value={0})Table of Contents
This chapter details the syntax used to express how measures, indicators, rules and action items are computed. There are two types of expression syntaxes that can be used:
Computations use metrics and functions to compute a value
SLOC-(BRAC+HLOC)
1-(MIN((TXADD+TXREM+TXMOD)/MAX(LC,1), 1))
Queries retrieve results from a defined scope, with an optional condition
SUM FILES.LC FROM DESCENDANTS WHERE I.CODE_STATUS=LEGACY
COUNT RULE FROM TREE WHERE HAS_OCCURRENCE() AND CATEGORY=SCALE_NATURE.NON_CONFORMITY
Read on to find out more about expression syntax and start building your model.
In all examples in this chapter, spaces were added between operands and operators for clarity, but they are not required.
An operand is any element defined in the model, called with its unique identifier (ID).
Measure IDs may be prefixed with B. to distinguish between the base measure and the derived measure.
Adding and dividing measures values:
<Computation targetArtefactTypes="FUNCTION" result="(TOPD+TOPT)/(DOPD+DOPT)" />
Using both base and derived measures (B.SLOC and SLOC respectively) in the same calculation:
<Measure measureId="COMR" defaultValue="-1">
	<Computation targetArtefactTypes="CODE" result="LC - B.SLOC + (-04 - SLOC)" />
</Measure>
Indicators are prefixed with I.. Computations with indicators use the rank of the indicator, as defined in the indicator's associated scale.
Sum the values of the ranks of several indicators:
<Computation targetArtefactTypes="FUNCTION" result="I.SDOC+I.DFCX+I.CFCX" />
Using the rank of the root indicator for the artefact with the RANK keyword:
<Measure measureId="COMR" defaultValue="-1">
	<Computation targetArtefactTypes="CODE" result="RANK + LC" />
</Measure>
Using the rank of the root indicator for the artefact with the LEVEL keyword:
<Measure measureId="COMR" defaultValue="-1">
	<Computation targetArtefactTypes="CODE" result="LEVEL + LC" />
</Measure>
Rules are prefixed with R. The following example shows a computation which retrieves the number of times the rule R_COMPOUNDIF was violated for the current artefact:
<Computation targetArtefactTypes="PACKAGE" result="R.R_COMPOUNDIF" />
Using R.RULE_ID is the same as writing the following query:
<Computation targetArtefactTypes="PACKAGE" result="COUNT RULE.OCCURRENCES FROM NODE WHERE MEASUREID=RULE_ID" />
Query syntax is introduced later in this chapter, in the section called “Queries”.
Add operands
Take the value of LC and add 10:
<Measure measureId="COMR" defaultValue="-1">
	<Computation targetArtefactTypes="CODE" result="LC + 10" />
</Measure>
Subtract operands / use the opposite of an operand
Take the value of LC, subtract SLOC:
<Measure measureId="COMR" defaultValue="-1">
	<Computation targetArtefactTypes="CODE" result="LC - SLOC" />
</Measure>
Using the opposite value of an operand:
<Measure measureId="COMR" defaultValue="-1">
	<Computation targetArtefactTypes="CODE" result="0.1 * -LC + 2 * -SLOC * 3" />
</Measure>
Multiply operands
<Measure measureId="COMR" defaultValue="-1">
	<Computation targetArtefactTypes="CODE" result="LC * SLOC * 6.0" />
</Measure>
Divide operands
<Measure measureId="COMR" defaultValue="-1">
	<Computation targetArtefactTypes="CODE" result="LC + 2 / 2" />
</Measure>
Allows evaluating operands as boolean conditions. An operand evaluates to true if its value is > 0. OR returns true if at least one operand evaluates to true
Allows evaluating operands as boolean conditions. An operand evaluates to true if its value is > 0. AND returns true if both operands evaluate to true
The operator precedence in computation is as follows:
Table 5.1. Operator Precedence
|
1 |
- (as opposite or operand) |
|
2 |
/, * |
|
3 |
+, - (as subtraction) |
|
4 |
<=, >=, !=, =, >, < |
|
5 |
OR, || |
|
6 |
AND, && |
You can use parentheses to override operator precedence, if needed.
When a computation gives an error, the measure will be assigned the default value (-1 in the example below) instead of the result of the computation:
<Measure measureId="COMR" defaultValue="-1">
	<Computation targetArtefactTypes="CODE" result="LC / 0" />
</Measure>
When a measure is assigned its default value because of an error, the Measures tab of the Explorer will display the measure status as Error. When this happens for an indicator, the indicator is displayed in red in the Indicator Tree.
Determines the minimum in a set of values
Use the lower of three indicators:
<Measure measureId="EXAMPLE" defaultValue="-1">
	<Computation targetArtefactTypes="CODE" result="MIN(I.TESTABILITY, I.CHANGEABILITY, I.ANALISABILITY)" />
</Measure>
Using nested MIN and MAX functions:
<Measure measureId="EXAMPLE" defaultValue="-1">
	<Computation targetArtefactTypes="CODE" result="MIN(MAX(SLOC+(BLANK/2),1000),MAX(LC,1000))+2" />
</Measure>
Calculate the filtered minimum of comma-separated values. When using the FMIN() function, only the values within min and max are used to calculate a MIN(). To specify infinity as a bound, leave the value of min or max empty. If no values match the filter, the default value is returned.
FMIN(,,-2,4,11)
is equivalent to: FMIN(-Infinity,+Infinity,-2,4,11)
is equivalent to: MIN(-2,4,11)
FMIN(0,10,-2,4,11)
is equivalent to: MIN(4,11)
FMIN(0,1,-2,4,11)
is equivalent to: MIN(), which evaluates to null
and leads to using the default value of the measure and marking
it in the indicator tree with the status ERROR.
FMIN(2,,1,I.LC)
is equivalent to: FMIN(2,+Infinity,1,I.lC)
is equivalent to: MIN(I.LC)
resolves to: I.LC if LC >= 2, else default value
Determines the maximum in a set of values
Use a measure if it is above a threshold, else use the threshold itself:
<Measure measureId="EXAMPLE" defaultValue="-1">
	<Computation targetArtefactTypes="CODE" result="MAX(10,VG)" />
</Measure>
Use the value of the higher of two measures:
<Measure measureId="EXAMPLE" defaultValue="-1">
	<Computation targetArtefactTypes="CODE" result="MAX(LC,SLOC)" />
</Measure>
Prevent a division by 0:
<Measure measureId="EXAMPLE" defaultValue="-1">
	<Computation targetArtefactTypes="CODE" result="LC / MAX(STAT, 1)" />
</Measure>
Calculates the filtered maximum of comma-separated values. When using the FMAX() function, only the values within min and max are used to calculate a MAX(). To specify infinity as a bound, leave the value of min or max empty. If no values match the filter, the default value is returned.
Determines the absolute value for an operand
Retrieve the variation of a measure:
<Measure measureId="EXAMPLE" defaultValue="-1">
	<Computation targetArtefactTypes="CODE" result="ABS(DELTA_VALUE(LC))" />
</Measure>
Computes the average for a set of values
Calculate the average of three indicators:
<Measure measureId="EXAMPLE" defaultValue="-1">
	<Computation targetArtefactTypes="CODE" result="AVR(I.TESTABILITY, I.CHANGEABILITY, I.ANALISABILITY)" />
</Measure>
Calculates the exponential of a value
Calculates the natural logarithm of a value
Calculates the logarithm of a value
Calculates a power
Calculates a square root
Rounds a number up or down to the nearest integer
Rounds a number down to the nearest integer
Rounds a number up to the nearest integer
Calculates the centroid of comma-separated pairs of value|weight. If no weight is specified, it is set to 1.
Calculate the centroid of 3 with weight 3 and 2 with weight 100 (=2.03) (this translates to (3x3 + 2x100) / (100+3)):
<Measure measureId="MATH_CENTROID_3_3_2_100" defaultValue="-1">
	<Computation targetArtefactTypes="APPLICATION" result="CENTROID(3|3,2|100)"/>
</Measure>
Calculates the filtered centroid of comma-separated pairs of value|weight. When using the FCENTROID() function, only the values
within min and max are used to calculate a CENTROID(). To specify infinity as a bound, leave the value of min or max empty. If no
values match the filter, the default value is returned.
Calculate the filtered centroid of TESTABILITY/STABILITY/MAINTAINABILITY:
Given the scale:
level: UNKNOWN, rank: -1
level: LEVELA, rank: 0
level: LEVELB, rank: 1
level: LEVELC, rank: 2
and given that I.TESTABILITY is UNKNOWN, I.STABILITY is LEVELB, I.MAINTAINABILITY is LEVELC
<Measure measureId="MATH_FCENTROID" defaultValue="-1">
	<Computation targetArtefactTypes="APPLICATION" result="FCENTROID(0,,I.TESTABILITY|3,I.STABILITY|2,I.MAINTAINABILITY)"/>
</Measure>
I.TESTABILITY is filtered out as it is not between the specified minimum and maximum.
The value is then computed as CENTROID(I.STABILITY|2,I.MAINTAINABILITY), which is (1x2 + 2) / (2+1).
Calculates the filtered sum of comma-separated values. When using the FSUM() function, only the values within min and max are used to calculate a sum. To specify infinity as a bound, leave the value of min or max empty. If no values match the filter, the default value is returned.
FSUM(,,1,2.5,2>1,3)
is evaluated as: 1 + 2.5 + 1 + 3
FSUM(2,4,1,2.5,2>1,3)
is evaluated as: 2.5 + 3
FSUM(6,,-1,I.LC,LC)
resolves to: I.LC if >= 6 or LC if >= 6
Assigns different values based on the result of a condition. Note that nested IF constructions are allowed, and an IF block can contain OR or AND operators. A condition is simply a computation that returns 1 if true and 0 if false. For example, result="SLOC>50" returns 1 if the artefact's SLOC is greater than 50, or 0 otherwise.
Set a measure to 6 if SLOC is above a threshold, else set it to 4:
<Measure measureId="EXAMPLE" defaultValue="-1">
	<Computation targetArtefactTypes="CODE" result="2+IF(SLOC>50,4,2)" />
</Measure>
False into the ELSE part of the IF statement to avoid using the default value:
<Measure measureId="EXAMPLE" defaultValue="-1">
	<Computation targetArtefactTypes="CODE" result="IF(2/0, 5, 10)" />
</Measure>
=> will return 10 instead of -1
Set a measure to 6 if SLOC is above a value and below another one, else set it to 4:
<Measure measureId="EXAMPLE" defaultValue="-1">
	<Computation targetArtefactTypes="CODE" result="2+IF(SLOC>50 AND SLOC<100,4,2)" />
</Measure>
A nested IF construction:
<Measure measureId="EXAMPLE" defaultValue="-1">
	<Computation targetArtefactTypes="CODE" result="2+IF(I.LC>IF(SLOC>300,SLOC,MAX(250,300)),98,8)" />
</Measure>
Assigns different values to a measure based on the value of another measure. A fallback can be specified by using the DEFAULT case.
Assign a value for EASE_OF_USE based on the value of FEEDBACK:
<Measure measureId="EASE_OF_USE" defaultValue="-1">
	<Computation targetArtefactTypes="APPLICATION" result="CASE(FEEDBACK,C.BAD:0,C.GOOD:50,C.EXCELLENT:80,DEFAULT:-1)" />
</Measure>
Returns 0 if the result of the computation is greater than or equal to 1, or 1 otherwise.
Set OLD_LARGE_FILE to 1 if the file is neither new nor under 500 lines
<Measure measureId="OLD_LARGE_FILE" defaultValue="-1">
	<Computation targetArtefactTypes="FILE" result="NOT(IS_NEW_ARTEFACT() AND LC<500)" />
</Measure>
Provides a way to retrieve rank values from your model.
Retriev rank values, given the following scale:
<Scale scaleId="SCALE_LINE">
	<ScaleLevel levelId="LEVELA" bounds="];10]"  rank="0" />
	<ScaleLevel levelId="LEVELB" bounds="]10;30]" rank="1" />
	<ScaleLevel levelId="LEVELC" bounds="]30;60]" rank="2" />
	<ScaleLevel levelId="LEVELD" bounds="]60;100]" rank="4" />
	<ScaleLevel levelId="LEVELE" bounds="]100;[" rank="8" />
</Scale>
You can use the RANK function as follows to find the rank of LEVELD. The example below returns 4:
<Measure measureId="EXAMPLE" defaultValue="-1">
	<Computation targetArtefactTypes="CODE" result="RANK(SCALE_LINE,LEVELD)" />
</Measure>
Using RANK is useful when combined with conditions. The examples below are equivalent:
<Measure measureId="EXAMPLE" defaultValue="-1">
	<Computation targetArtefactTypes="CODE" result="IF(I.LC>4,1,0)" />
</Measure>
<Measure measureId="EXAMPLE" defaultValue="-1">
	<Computation targetArtefactTypes="CODE" result="IF(I.LC>RANK(SCALE_LINE,LEVELD),1,0)" />
</Measure>
<Measure measureId="EXAMPLE" defaultValue="-1">
	<Computation targetArtefactTypes="CODE" result="IF(I.LC>LEVELD,1,0)" />
</Measure>
In the last example, we use the short syntax for the RANK function: >LEVELD is only valid when used after an indicator. The rank retrieved is the rank of level LEVELD for the scale of the current artefact type for the indicator LC.
Provides a way to retrieve a rank from your model by passing a measure and a scale.
The FIND_RANK() function is mostly useful when using dynamic scales (see the section called “Dynamic Scales”). The example below assigns to TEST_COVERAGE_RANK the value of the rank for the value of COVERAGE on the scale DYN_SCALE_OK_KO:
<Measure measureId="OBJECTIVE" targetArtefactTypes="APPLICATION;FODLER;FILE;CLASS" defaultValue="-1" />
<Measure measureId="COVERAGE" targetArtefactTypes="APPLICATION;FODLER;FILE;CLASS" defaultValue="-1" />

<Scale scaleId="DYN_SCALE_OK_KO">
	<ScaleLevel levelId="DYN_OK" bounds="[;APP(OBJECTIVE)]"  rank="0" />
	<ScaleLevel levelId="DYN_KO" bounds="[APP(OBJECTIVE);]" rank="1" />
</Scale>

<Scale scaleId="SCALE_OK_KO">
	<ScaleLevel levelId="OK" bounds="[1;1]"  rank="0" />
	<ScaleLevel levelId="KO" bounds="[0;0]" rank="1" />
</Scale>

<Measure measureId="TEST_COVERAGE_RANK">
	<Computation targetArtefactTypes="APPLICATION" result="FIND_RANK(DYN_SCALE_OK_KO,COVERAGE)" />
</Measure>

<Indicator indicatorId="TEST_COVERAGE" measureId="TEST_COVERAGE_RANK" scaleId="SCALE_OK_KO" />
Retrieves the value of a measure at application level
Compute the percentage of lines of code present in the current artefact using the entire application as the reference, with APP():
<Measure measureId="EXAMPLE" defaultValue="-1">
	<Computation targetArtefactTypes="CODE" result="(LC*100)/APP(LC)" />
</Measure>
Retrieve the value of a measure for an artefact's parent or ancestor containing this measure. The concept is similar to that of the APP() function, but PARENT() only checks the artefact's direct parent and ANCESTOR() goes up the tree until finding an artefact (of the optionally specified type) that has the requested measure ID.
Mark a method as risky if the parent class has changed, using PARENT():
<Measure measureId="RISKY" defaultValue="-1">
	<Computation targetArtefactTypes="FUNCTION" result="PARENT(CHANGED,CLASS)" />
</Measure>
Set an artefact as critical if one of its containing folder is critical:
<Measure measureId="IS_CRITICAL" defaultValue="-1">
	<Computation targetArtefactTypes="FOLDER;CLASS;FUNCTION" result="ANCESTOR(IS_CRITICAL,FOLDER)" />
</Measure>
Provide the same function as PARENT and ANCESTOR but allow filtering for values to take into account. Note that if min or max are omitted, they are automatically replaced by -Infinity and +Infinity respectively.
Filtering with FPARENT():
IF(FPARENT(RANK(SCALE_LINE,LEVELG), RANK(SCALE_LINE,LEVELG), I.LC),1,2)
=> resolves as: IF(PARENT(I.LC)=RANK(SCALE_LINE,LEVELG),1,2)
=> return 1 if PARENT(I.LC) = LEVELG, otherwise 2
Filtering with FANCESTOR():
FANCESTOR(500,, LC, FOLDER)
=> returns LC for the first folder ancestor where LC >= 500
Provides a way to find out if a Data Provider was executed successfully or not during the analysis. If the Data Provider was not executed or failed, the function returns 0. If the Data Provider was executed successfully, then the function returns 1.
Find out if the Checkstyle Data Provider was executed successfully with IS_DP_OK:
<Measure measureId="RAN_CHECKSTYLE" defaultValue="-1">
	<Computation targetArtefactTypes="APPLICATION" result="IS_DP_OK(Checkstyle)" />
</Measure>
Provides finer information about the execution status of a Data Provider than IS_DP_OK():
Find out the status of the execution of Checkstyle during the analysis:
<Measure measureId="CHECKSTYLE_STATUS" defaultValue="-1">
	<Computation targetArtefactTypes="APPLICATION" result="DP_STATUS(Checkstyle)" />
</Measure>
returns -1 if the DP was not run
returns 0 if the DP was successful
returns 1 if the DP returned some warnings
returns 2 if the DP reported errors
returns 3 if the DP stopped with a fatal error
Allows determining if the project is a meta-project, i.e. an aggregation of results from other Squore projects, and allows you to compute results differently if needed. The function returns 0 for regular projects and 1 for meta-projects. For more information about meta-projects, consult the section called “Wizard Contept”.
Returns 1 when the project uses an approved ruleset template, or 0 when it does not. Approved ruleset templates can be created by model managers using the Analysis Model Editor. Refer to the Getting Started Guide for more information about ruleset edition.
Provides a way to check if an artefact is of a specific type. If the artefact is of the specified type, the function returns 1, else it returns 0.
Check if the artefact is a CHANGE_REQUEST:
<ArtefactType id="ISSUE" heirs="BUG;CHANGE_REQUEST;HOTLINE;REGRESSION" />
<Measure measureId="IS_CR" defaultValue="-1">
	<Computation targetArtefactTypes="ISSUE" result="IS_ARTEFACT_TYPE(CHANGE_REQUEST)" />
</Measure>
Tests whether the artefact is new in the current version of the project. It returns 1 if true, 0 if false.
Define a measure whose value is set to 1 when the artefact is new, else 0:
<Measure measureId="EXAMPLE" defaultValue="-1">
	<Computation targetArtefactTypes="CODE" result="IS_NEW_ARTEFACT()" />
</Measure>
Use IS_NEW_ARTEFACT as a condition operator:
<Measure measureId="EXAMPLE" defaultValue="-1">
	<Computation targetArtefactTypes="CODE" result="IF(IS_NEW_ARTEFACT(),3,4)" />
</Measure>
Note: IF(IS_NEW_ARTEFACT(),val_yes,val_no) is equivalent to IF(IS_NEW_ARTEFACT()>0,val_yes,val_no)
Provides a way to find out an artefact's relaxation status. It returns 1 if the artefact is relaxed and 0 if it is not.
Returns the number of links for an artefact. It requires defining the type of link to consider (linkTypeId) and optionally allows to specify an extra parameter to refine which link directions to consider:
OUT considers only outbound links (links from this artefact to other artefacts)
IN considers only inbound links (links from other artefacts to this artefact)
IN_OUT considers all links for this artefact and is the default value if none is specified
The function also allows defining a condition to filter out unwanted links when counting. The condition is verified against the target artefacts according to the specified link direction. In order for the condition to be taken into account, the link type and its supported IN and OUT artefacts must be declared in the analysis model, see the section called “Artefact Links” for more details.
Find the number of failing tests (link type: BLOCKS) for each requirement and requirement folder:
<Measure measureId="NUM_FAILING_TESTS" defaultValue="-1">
	<Computation targetArtefactTypes="REQUIREMENT" result="LINKS(BLOCKS,IN)" />
	<Computation targetArtefactTypes="REQUIREMENT_FOLDER" result="SUM REQUIREMENT.NUM_FAILING_TESTS FROM TREE" />
</Measure>
Find the number of failing tests for each requirement, excluding failing tests on relaxed code:
<Link id="BLOCKS" srcArtefactTypes="CODE" dstArtefactTypes="REQUIREMENT" />
	<Measure measureId="NUM_FAILING_TESTS_COND" defaultValue="-1">
	<Computation targetArtefactTypes="REQUIREMENT" result="LINKS(BLOCKS,IN, NOT(IS_RELAXED_ARTEFACT())" />
</Measure>
Allows aggregating metrics from linked artefacts. The function's parameters are:
aggregationType (mandatory) defines how the values for the metrics are aggregated. The supported values are:
MIN
MAX
OCC
AVG
DEV
SUM
MED
MOD
computation (mandatory) is the computation to perform when encountering the desired type of link.
linkTypeId (mandatory) is desired type of link to aggregate data from. The link type and its supported IN and OUT artefacts must be declared in the analysis model, see the section called “Artefact Links” for more details.
The link direction, which is one of:
OUT considers only outbound links (links from this artefact to other artefacts)
IN considers only inbound links (links from other artefacts to this artefact)
IN_OUT considers all links for this artefact and is the default value if none is specified
A computation used as a condition to filter out unwanted artefacts
A default computation that is used to return a value in case no link exists
Find out the average code coverage for code implementing requirements where tests are failing. Only consider code artefacts where there is test coverage. If there are no failing tests, set the metric to 0:
<Link id="BLOCKS" srcArtefactTypes="CODE" dstArtefactTypes="REQUIREMENT" />
<Measure measureId="TCOV_FAILING_TESTS" defaultValue="-1" type="PERCENT">
	<Computation targetArtefactTypes="REQUIREMENT" result="LINKS_AGGREGATE(AVG, TCOV, BLOCKS,IN, TCOV != -1, 0)" />
</Measure>
Retrieves the previous value of a measure or indicator (measureId). This function returns 0 when no previous value can be found.
Use the value of LC from the previous analysis:
<Measure measureId="EXAMPLE" defaultValue="-1">
	<Computation targetArtefactTypes="CODE" result="PREVIOUS_VALUE(LC)" />
</Measure>
Computes the difference between the current value of a measure or indicator (measureId) and its previous value. This function returns 0 if no delta can be calculated.
Obtaining the difference in ranking between two analyses for an artefact:
<Measure measureId="EXAMPLE" defaultValue="-1">
	<Computation targetArtefactTypes="CODE" result="DELTA_VALUE(RANK)" />
</Measure>
Compute a delta of opened/closed bugs since the previous analysis:
<Measure measureId="SPRINT_PROGRESS" defaultValue="-1">
<Computation targetArtefactTypes="SPRINT" result="DELTA_VALUE(NB_OPEN_CR)" />
</Measure>
Retrieves the value of some artefact information (infoId) in the previous version so it can be compared with the current artefact information (This is useful when combined with the EQUALS() or MATCHES() functions, as described in the section called “String Matching Functions”).
Returns the first value ever assigned to a metric (measureId) in the current project, optionally within specific bounds (min, max).
Compute a delta of opened/closed bugs since the beginning of a sprint:
<Measure measureId="SPRINT_PROGRESS" defaultValue="-1">
	<Computation targetArtefactTypes="SPRINT" result="FIRST_VALUE(NB_OPEN_CR)-NB_OPEN_CR" />
</Measure>
Returns the aggregated value of the previous values of a metric (measureId). You can optionally configure the minimun and maximum (minNb, maxNb) number of valid data points to be aggregated, and specify bounds (min, max) for the values to consider for aggregation. The aggregation type (aggregationType) is a mandatory parameter, and must be one of MIN, MAX, OCC, AVG, DEV, SUM, MED or MOD.
Count the number of new issues reported based on the number of new issues opened daily:
<Measure measureId="NEW_ISSUES_TALLY" defaultValue="-1">
	<Computation targetArtefactTypes="SPRINT" result="AGGREGATE(SUM, NEW_CR)" />
</Measure>
Compute the average number of issues opened daily:
<Measure measureId="ISSUE_DISCOVERY_RATE" defaultValue="-1">
	<Computation targetArtefactTypes="SPRINT" result="AGGREGATE(AVG, NEW_CR)" />
</Measure>
Returns the interpolated or extrapolated value from the previous values of a metric (measureId) at a specific date (date). You can optionally configure the minimun and maximum (minNb, maxNb) number of valid data points to be taken into account, and specify bounds (min, max) for the values to consider for extrapolation. The date (date) and degree (degree) of the polynomial extrapolation are mandatory parameters.
Compute the value of WP_PCT at the next milestone using exactly 3 data points
<Measure measureId="WP_PCT_NEXT_1" defaultValue="-1"  >
	<Computation targetArtefactTypes="WORK_PRODUCT" result="LEAST_SQUARE_FIT(1, WP_PCT, DATE_MILESTONE(NEXT), 3, 3)" />
</Measure>
Squore computes and stores dates internally as the number of milliseconds since January 1st 1970 in UTC.
For version dates and project attributes, users can set a date using the following levels of precision:
Date "1979-07-28" is saved as July 28th 1979 at midnight UTC
Date/Time "1979-07-28T13:58:25" is saved as July 28th 1979 at 13:58:25 UTC
Date/Time in a specific timezone (new in 18.0) "1979-07-28T13:58:25+0800" is saved as July 28th 1979 at 13:58:25 UTC+8
There are various ways to display dates in the web interface. See the description of the
format
attribute in the section called “Measures” for more information.
Converts year/month/day numbers to a date in milliseconds.
Convert to the date 28th July 1979:
<Measure measureId="EXAMPLE" defaultValue="-1">
	<Computation targetArtefactTypes="CODE" result="DATE(1979,07,28)" />
</Measure>
Convert to a date using measure IDs:
<Measure measureId="EXAMPLE" defaultValue="-1">
	<Computation targetArtefactTypes="CODE" result="DATE(YEAR_START+2,MONTH_START+MONTHS_SPENT,TARGET_DAY)" />
</Measure>
Allows passing a number as a number of days in milliseconds
Find the number of days since the start of the project (the project attribute PROJECT_START_DATE) until today:
<Measure measureId="EXAMPLE" defaultValue="-1">
	<Computation targetArtefactTypes="CODE" result="TO_DAYS(TODAY()-PROJECT_START_DATE)" />
</Measure>
Find the number of working days since the start of the project (the project attribute PROJECT_START_DATE) until today:
<Measure measureId="EXAMPLE" defaultValue="-1">
	<Computation targetArtefactTypes="CODE" result="TO_DAYS(DURATION_WITHOUT_WEEKEND(PROJECT_START_DATE, TODAY()))" />
</Measure>
Add 4 days to May 19th 2012 to obtain May 23rd 2012:
<Measure measureId="EXAMPLE" defaultValue="-1">
	<Computation targetArtefactTypes="CODE" result="DATE(2012,05,19)+DAYS(4)" />
</Measure>
Returns the number of days between two dates, given a duration in milliseconds
Calculate the age of a change request:
<Measure measureId="AGE" defaultValue="-1">
	<Computation targetArtefactTypes="CR" result="TO_DAYS(APP(PRESENT_DAY)-CREATE_TIME)" />
</Measure>
Retrieves today's date at midnight UTC
Retrieve today's exact date and time (at the time of the analysis)
Retrieves the version's date and time. By default, this is the same value as the time of the analysis (NOW()), but users are allowed to specify a different date different from the current one.
Calculate whether an issue expires within a week of the analysis:
<Measure measureId="EXPIRES_THIS_WEEK" defaultValue="-1">
	<Computation targetArtefactTypes="BUG;CR" result="IF(EXPIRY_DATE - DAYS(7) < VERSION_DATE(),1,0)" />
</Measure>
Returns a date truncated to the specified precision unit and is useful when calculating date differences. The supported units are:
YEAR
QUARTER
MONTH
SEMI_MONTH
WEEK_SUNDAY (use when the first day of the week is Sunday)
WEEK_MONDAY (use when the first day of the week is Monday)
DAY
AM_PM
HOUR
MINUTE
SECOND
MILLISECOND
Truncate a date down to year precision:
<!-- Sat, 28 Jul 1979 11:14:04 GMT -->
<Constant id="EXACT_DATE" value="302008444000" />

<!-- Returns 283996800000 (aka: Mon, 01 Jan 1979 00:00:00 GMT) -->
<Measure measureId="TRUNCATE_TO_YEAR" defaultValue="-1">
	<Computation targetArtefactTypes="ISSUE" result="TRUNCATE_DATE(EXACT_DATE, YEAR)" />
</Measure>
Find out how much time it took to solve an issue. This example highlights how using TRUNCATE_DATE() can bring more precision depending on how you want to handle periods under 24 hours as one day or two days.
<!-- Date opened: Sat, 28 Jul 1979 07:47:47 GMT -->
<Constant id="TIME_OPENED" value="301996067000" />

<!-- Date closed 1: Sat, 28 Jul 1979 12:02:25 GMT -->
<Constant id="TIME_CLOSED_1" value="302011345000" />

<!-- Date closed 2: Sun, 29 Jul 1979 04:56:04 GMT -->
<Constant id="TIME_CLOSED_2" value="302072164000" />


<Measure measureId="TRUNCATE_TO_RETURN_ZERO" defaultValue="-1">
	<Computation targetArtefactTypes="ISSUE" result="TRUNCATE_DATE(TIME_CLOSED_1, DAY) - TRUNCATE_DATE(TIME_OPENED, DAY)" />
</Measure>

<Measure measureId="TRUNCATE_TO_RETURN_ONE" defaultValue="-1">
	<Computation targetArtefactTypes="ISSUE" result="TRUNCATE_DATE(TIME_CLOSED_2, DAY) - TRUNCATE_DATE(TIME_OPENED, DAY)" />
</Measure>

<Measure measureId="TO_DAYS_RETURNS_ONE" defaultValue="-1">
	<Computation targetArtefactTypes="ISSUE" result="DAYS(TIME_CLOSED_1 - TIME_OPENED)" />
</Measure>

<Measure measureId="TO_DAYS_RETURNS_ONE_ALSO" defaultValue="-1">
	<Computation targetArtefactTypes="ISSUE" result="DAYS(TIME_CLOSED_2 - TIME_OPENED)" />
</Measure>
Returns the difference between startDateTime and endDateTime with Saturdays and Sundays removed. The function uses the GMT timezone and returns a result in milliseconds.
Checks if a milestone with the specified milestoneId exists in the project. The function returns 0 if no milestone is found, 1 if a milestone is found.
Find if we are at the last milestone of the project:
IS_LAST_MILESTONE=IF(HAS_MILESTONE(),0,1)
Returns the date associated to a milestone.
Find if the date for the milestone BETA_RELEASE has been modified between June 2015 and now:
DATE_HAS_SLIPPED=(DATE_MILESTONE(BETA_RELEASE)-DATE_MILESTONE(BETA_RELEASE, DATE(2015,06,01))) != 0
Compute the date difference between the previous and next milestones:
MILESTONE_DURATION=DATE_MILESTONE(NEXT) - DATE_MILESTONE(PREVIOUS)
Find the date slip for the next milestone between now and the previous anlaysis:
DATE_SLIP=DATE_MILESTONE(NEXT) - DATE_MILESTONE(NEXT, VERSION_DATE(PREVIOUS))
Find the amount of time left until the next milestone:
DEADLINE=DATE_MILESTONE(NEXT) - VERSION_DATE()
Returns the goal for a metric at the specified milestone.
Find the goal for requirement stability set for the milestone PROTOTYPE as of June 2016:
REQ_STABILITY_GOAL=GOAL(REQ_STABILITY, PROTOTYPE, DATE(2016,06,01))
Find the delta between the goal for TEST between the previous and next milestones:
DELTA=GOAL(TEST) - GOAL(TEST, PREVIOUS)
Find the delta between the goal for TEST for the next milestone set for the previous analysis and now:
DELTA=GOAL(TEST) - GOAL(TEST, NEXT, VERSION_DATE(PREVIOUS))
Find the delta between the current value of TEST and the goal for TEST at the next milestone:
DELTA=GOAL(TEST) - TEST
You can use keywords instead of using a milestone ID. You can retrieve information about the next, previous, first or last milestones in the project by using:
NEXT
NEXT+STEP
where STEP is a number indicating how many milestones to jump ahead
PREVIOUS
PREVIOUS-STEP
where STEP is a number indicating how many milestones to jump backward
FIRST
LAST
In all milestone functions, if no milestone ID and no keyword is specified, then NEXT is used by default.
All milestone functions accept a date parameter. The date is used to execute the function in that date context. If no date is specified, then the context used to execute the function is the analysis date.
The examples in this section are based on an artefact with the following data:
<I n="LANGUAGES" v="Java, C#, C++, C"/>
<I n="AUTHOR" v="gabriel"/>
<I n="URL" v="http://www.my_url.com"/> [^]
<I n="ONE_LANGUAGE" v="JaVa"/>
Retrieves the textual information info_tag for an artefact.
Retrieves an artefact's name
Checks if two strings are equal and returns 1 if they are
Case-insensitive search:
EQUALS(INFO(AUTHOR), 'gabriel')
=> 1
Case-sensitive search:
EQUALS(INFO(LANGUAGES), 'Java, C#, C++, C', 0)
=> 1
Checks if a string contains another string and returns 1 if it does
Case-insensitive search:
CONTAINS(INFO(LANGUAGES), 'C++')
=> 1
Case-sensitive search:
CONTAINS(INFO(LANGUAGES), 'Cobol', 0)
=> 0
use two infos as search parameters:
CONTAINS(INFO(LANGUAGES), INFO(ONE_LANGUAGE), 1)
=> 1
Checks if a string starts with another string and returns 1 if it does
Check if the URL starts with HTTP:
STARTS_WITH(INFO(URL), 'HTTP')
=> 1
STARTS_WITH(INFO(URL), 'HTTPS')
=> 0
Checks if a string ends with another string and returns 1 if it does
Check if the URL ends with COM (case-sensitive):
ENDS_WITH(INFO(URL), '.COM', 0)
=> 0
Checks if a string matches a pattern and returns 1 if it does
Check various regular expressions for the language field:
MATCHES(INFO(LANGUAGES), 'J.*', 0)
=> 1
MATCHES(INFO(LANGUAGES), '.*(, C\+\+).*', 0)
=> 1
MATCHES(INFO(LANGUAGES), '.*(, C\+\+\+).*', 0)
=> 0
forceIgnoreCase is an optional boolean set to 1 by default. If you want to perform a case-sensitive search, use 0, instead.
You can also retrieve the previous value of textual information for an artefact using the PREVIOUS_INFO() function, as described in the section called “Temporal Functions”
Queries allow performing calculations on a set of values, optionally applying some conditions.
You can think of a query as an structured statement similar to:
[COMPUTE_VALUE] FROM [SCOPE] WHERE [CONDITION]
where [SCOPE] is one of:
NODE and DESCENDANTNODE and CHILDREN.and [CONDITION] can use the following operators (with some exceptions where specified):
Note that XML does not allow using < directly in an attribute,
therefore you will need to insert it using an entity: <.
In this section, you will learn how to compute values, define a scope and write conditions for your queries following the syntax supported in Squore to:
count artefacts
compute mathematical results on metrics using SUM, MAX, MIN, MUL or AVR
count rules and rule occurrences
Returns the number of artefacts of a certain type. ARTEFACT_TYPE is one of
FOLDER, APPLICATION,
C_FILE, or other type (or alias) defined in your model.
ALL can be used as a shortcut for all artefact types for which the measure exists
COUNT ALL FROM DESCENDANTS WHERE LEVEL>LEVELC
SUM ALL.TECH_DEBT_TYPE FROM TREE
Parentheses in conditions are not supported, and OR takes priority over AND.
Counting artefacts supports specifying a condition in the form of a computation, following the syntax described in the section called “Computation Syntax”, as demonstrated by the examples below.
Find the number of programs with a rating of LEVELG, starting from the children of the considered artefact:
COUNT PROGRAM FROM DESCENDANTS WHERE LEVEL=LEVELG
Find the number of artefacts not rated C or UNKNOWN that have more than 10 lines of code:
COUNT FILE FROM DESCENDANTS WHERE LEVEL!=LEVELC OR LEVEL!=UNKNOWN AND B.LC>10
Find the number of artefacts where LC is greater than -1:
COUNT FILE FROM DESCENDANTS WHERE LC
=> is shorthand for
COUNT FILE FROM DESCENDANTS WHERE LC >=1
Find the number of issues with the status "FIXED" created in the last 60 days:
COUNT ISSUE FROM TREE WHERE EQUALS(INFO('STATUS'), 'FIXED') AND DATE_SUBMITTED >= TODAY() - DAYS(60)Perform mathematical operations on artefact hierarchies using the following syntax:
SUM|MAX|MIN|MUL|AVR <ArtefactType|ALL>.<MeasureId>
When using this syntax, the [CONDITION] is a regular computation, as detailed in the section called “Computation Syntax”.
Returns the sum of values returned for a set.
The SUM of values [1, 3, 3, 3, 5, 6] is 21.
Compute VG for a folder as the sum for VG for all functions in the folder:
<Measure measureId="VG" defaultValue="1">
	<Computation targetArtefactTypes="FOLDER" result="SUM FUNCTION.VG FROM DESCENDANTS" />
</Measure>
Return the maximum or minimum value of a set.
The MAX and MIN of values [1, 3, 3, 3, 5, 6] are 6 and 1 respectively.
Assign the maximum value for VG from all functions in a folder as VG_MAX for the folder:
<Measure measureId="VG_MAX" defaultValue="0">
	<Computation targetArtefactTypes="FOLDER" result="MAX FUNCTION.VG FROM DESCENDANTS" />
</Measure>
Returns the mean of all the values returned for a set.
The AVR of values [1, 3, 3, 3, 5, 6] is 3.5.
Returns the product of all the values returned for a set.
The MUL of values [1, 3, 3, 3, 5, 6] is 810.
Returns the number of rules. You can specify the ruleset to take into account by specifying a scope:
ALL is the entire ruleset for the model, ignoring whether rules are enabled or not
STANDARD is the model ruleset minus the rules that are deactivated by default
CUSTOMER is the ruleset as configured in the web interface using the Analysis Model Editor
PROJECT (default) is the ruleset as configured by the user when going through the project wizard
Count rules in the MISRA family in the project:
COUNT RULE() WHERE FAMILY=MISRA
Count rules in the MISRA family in the model, ignoring all changes made in the Analysis Model Editor:
COUNT RULE(STANDARD) WHERE FAMILY=MISRA
Returns the number of times a rule is violated (i.e. the number of findings). You can set a scope for the
ruleset to take into account (see scope in COUNT RULE above) and also filter the desired status of the violations:
ALL returns all findings irrespective of their relaxation status
OPENED (default) returns only findings that are not relaxed
RELAXED returns only relaxed findings
Count violations in the children of the selected artefact:
COUNT RULE.OCCURRENCES FROM DESCENDANTS
Count relaxed violations in the children of the selected artefact:
COUNT RULE.OCCURRENCES(RELAXED) FROM DESCENDANTS
Counting rules or rule occurrences supports one or more conditions that use the syntax described below. Parentheses are not allowed in the body
of a condition, but multiple conditions can be combined using AND and OR operators. In this case,
OR takes priority over AND.
Allows filtering on the value of a measure
Count all violations in artefacts where VG is more than 10):
COUNT RULE.OCCURRENCES FROM TREE WHERE VG>10
Allows filtering on an indicator level
Count all violations in artefacts with low self-descriptiveness:
COUNT RULE.OCCURRENCES FROM TREE WHERE I.SDESCR = LEVELF
Count all violations in artefacts not rated UNKNOWN (LEVEL is a keyword representing the root indicator for an artefact):
COUNT RULE.OCCURRENCES FROM TREE WHERE LEVEL != UNKNOWN
Allows finding if there are any violations of the specified rules in the specified scope. You can refine the results by specifying the status of the violations you are looking for:
OPEN (default) to find all violations except the ones that were relaxed
ALL to find all violations irrespective of their relaxation status
RELAXED to find all relaxed violations
RELAXED_DEROGATION to find violations with the Derogation relaxation status
RELAXED_LEGACY to find violations with the Legacy Code relaxation status
RELAXED_FALSE_POSITIVE to find violations with the False Positive relaxation status
Additionally, you can specify restrict the search scope according to whether a violation was relaxed in the source code by passing TRUE or via the web interface by passing FALSE (default) as the second parameter.
Finally, you can specify restrict the search scope according to whether a violation flagged as suspicious (new in 18.0) by passing TRUE or FALSE (default) as the third parameter. A relaxed finding can automatically get the suspicious flag if the source code around the finding's location has changed. You can find out more information about suspicious findings in the Getting Started Guide.
HAS_OCCURRENCE() replaces the now deprecated NBOCCURRENCES.
Count the number of rules in the "required" family that were violated in the selected artefact and all its descendants:
COUNT RULE FROM TREE WHERE HAS_OCCURRENCE() AND FAMILY=REQUIRED
Count MISRA rules violated with the Open status:
COUNT RULE FROM DESCENDANTS WHERE HAS_OCCURRENCE(OPEN) AND FAMILY=MISRA
Count rules where violations were relaxed because they appear in legacy code:
COUNT RULE FROM DESCENDANTS WHERE HAS_OCCURRENCE(RELAXED_LEGACY)
Count rules where violations were relaxed directly in the source code:
COUNT RULE FROM DESCENDANTS WHERE HAS_OCCURRENCE(RELAXED, TRUE)
Allows filtering on the category of a rule
Count violations not in the REQUIRED category:
COUNT RULE.OCCURRENCES FROM DESCENDANTS WHERE CATEGORY!=SCALE_PRIORITY.REQUIRED
Allows working with the families set in your model for a rule.
Count rules with the REQUIRED family in the selected artefact and all its descendants:
COUNT RULE FROM DESCENDANTS WHERE FAMILY=REQUIRED
Count rules in the MISRA family in the model:
COUNT RULE WHERE FAMILY=MISRA
Count rules in the REQUIRED family that were violated in the selected artefact and all its descendants:
COUNT RULE FROM TREE WHERE HAS_OCCURRENCE() AND FAMILY=REQUIRED
Allows working with the a measure from your analysis model your analysis model
Count rules that aren't R_NOGOTO
COUNT RULE FROM DESCENDANTS WHERE MEASUREID!=R_NOGOTO
Count violations of R_COMPOUNDELSE in the children of the selected artefact:
COUNT RULE.OCCURRENCES FROM DESCENDANTS WHERE MEASUREID=R_COMPOUNDELSE
Count relaxed violations of R_COMPOUNDELSE in the children of the selected artefact:
COUNT RULE.OCCURRENCES(RELAXED) FROM DESCENDANTS WHERE MEASUREID=R_COMPOUNDELSE
Allows specifying the status of the findings that should be taken into account in your query. The following statuses are supported:
OPEN (default) to find all violations except the ones that were relaxed
ALL to find all violations irrespective of their relaxation status
RELAXED to find all relaxed violations
RELAXED_DEROGATION to find violations with the Derogation relaxation status
RELAXED_LEGACY to find violations with the Legacy Code relaxation status
RELAXED_FALSE_POSITIVE to find violations with the False Positive relaxation status
Additionally, you can specify restrict the search scope according to whether a violation was relaxed in the source code by passing TRUE or via the web interface by passing FALSE (default) as the second parameter.
Finally, you can specify restrict the search scope according to whether a violation flagged as suspicious (new in 18.0) by passing TRUE or FALSE (default) as the third parameter. A relaxed finding can automatically get the suspicious flag if the source code around the finding's location has changed. You can find out more information about suspicious findings in the Getting Started Guide.
Find the number of legacy-code-relaxed violations of the R_COMPOUNDELSE rule in the children of the selected artefact:
COUNT RULE.OCCURRENCES(RELAXED) FROM DESCENDANTS WHERE MEASUREID=R_COMPOUNDELSE AND IS_STATUS_FINDING(RELAXED_LEGACY)
Allows determining if a finding is new in the latest analysis or not
Count the number of new violations in the analysis:
COUNT RULE.OCCURRENCES FROM TREE WHERE IS_NEW_FINDING()
Table of Contents
All dashboards available in Squore can be easily configured. Dashboards are specific to a model, and depend on the role of the user in the current project.
Each
model defined in the Squore
Configuration defines its own set of dashboards in the model's bundle
file,
located in
Squore_HOME/Configuration/models/MyModel/Dashboards/Bundle.xml
. The bundle uses a lot of XML inclusion for
convenience, but some elements can be easily
recognised:
<?xml version="1.0" encoding="UTF-8"?>
<roles xmlns:xi="http://www.w3.org/2001/XInclude">
	<role name="DEFAULT">
		<dashboard type="MODEL" nbColumns="2" factor="3">
			<charts>
				<xi:include href="rule_compliance_vs_complexity__size_quadrant.xml" />
				<xi:include href="CodeCloning/size_vs_code_cloning_quadrant.xml" />
			</charts>
			<xi:include href="SQuORE_RiskIndex/project_summary_table.xml" />
		</dashboard>
		<dashboard type="APPLICATION" nbColumns="3" minSizeForLegend="2x1" template="1:3x1;2:2x2;3:1x2">
			<scorecard>
				<xi:include href="../../Shared/Analysis/key_performance_indicator.xml" />
				<tables>
					<xi:include href="MaintenancePerformance/maintenance_performance_table.xml" />
					<xi:include href="ArtefactRating/artefact_table_oo.xml" />
					<xi:include href="TechnicalDebt/exploded_technical_debt_table.xml" />
				</tables>
			</scorecard>
			<charts>
				<xi:include href="ControlFlowAnalysis/CyclomaticComplexity/complexity_trend.xml" />
				<xi:include href="StabilityIndex/StabilityCChart.xml" />
				<xi:include href="ArtefactRating/StatementStackedBar.xml" />
				<xi:include href="LineCounting/LineCountHisto.xml" />
			</charts>
		</dashboard>
	</role>
</roles>
There are two types of dashboards:
The Model/Group Dashboard: a view that is activated when clicking the name of a model or a sub group in the Project Portfolios. This dashboard contains one or more charts and a table that displays information about all the projects in the Explorer for this model. This is described in the section called “Model/Group Dashboards”.
The Artefact Dashboard: a view that is displayed when clicking an artefact in the Artefact Tree. This dashboard contains two sections: a score card and a charts area. This dashboard is described in the section called “Artefact Type Dashboards”.
This specific dashboard displays information relative to all projects analysed with the current analysis model or group of project. It consists of a list of charts and a table with all the projects using this analysis model in this group and some chosen values (columns) to ease comparison between them.
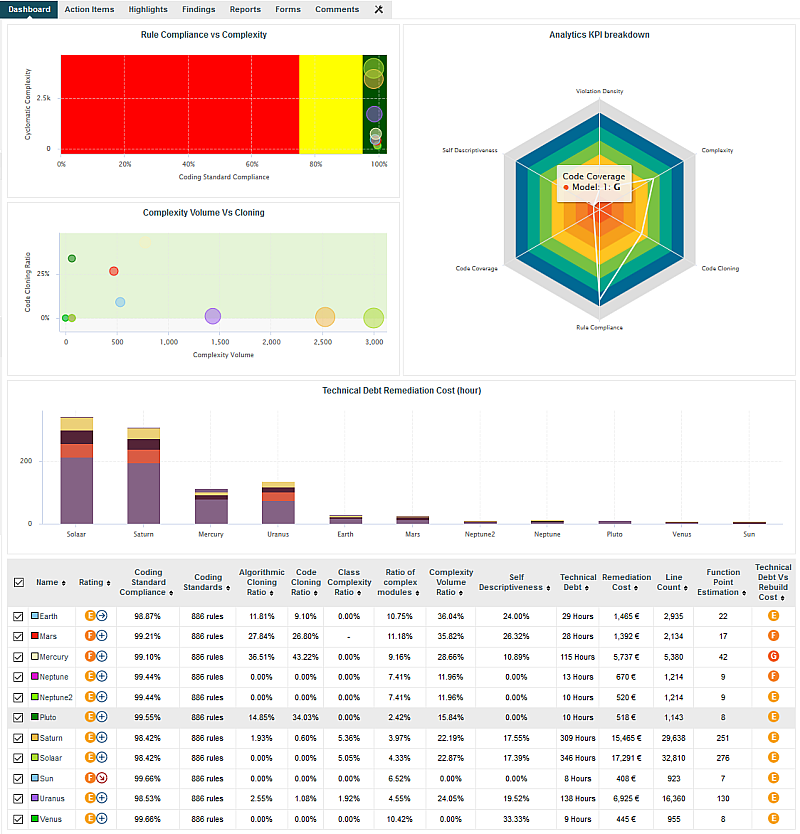
Analysis Model Dashboard
Its structure is as follows:
<dashboard type="MODEL" nbColumns="2" scoreGroups="true" indicatorId="PERFORMANCE" aggregationType="AVG" defaultWidthValue="500" defaultHeightValue="500">
	<charts>
	...
	</charts>
	<table id="PROJECT_SUMMARY" hideLastVersion="false" hideCreator="true" hideLevel="false">
	...
	</table>
</dashboard>
The dashboard
element supports the following attributes:
type
(mandatory)
is the type of artefact that this dashboard definition applies to.
nbColumns
(optional, default: 3)
sets the number of columns used to display the charts on the dashboard.
defaultWidthValue
(optional, default: 400)
sets the default width of a maximised chart if not specified within the chart itself.
defaultHeightValue
(optional, default: 400)
sets the default height of a maximised chart if not specified within the chart itself.
rowMaxHeight
(optional, default: 250)
define the maximum height in pixels of a row of charts on the dashboard.
template
(optional, default: 1x1 for all charts)
allows changing the aspect ratio of charts in the dashboard, using the syntax "position:width x height;".
Note that the use of this attribute requires defining a value for the nbColumns
attribute.
For more details about dashboard templates, refer to the section called “Dashboard Templates”.
minSizeForLegend
(optional, default: no legends on thumbnails)
allows displaying chart legends on the thumbnails for charts whose ratio is above the specified minimum. By default,
no chart legends are displayed on thumbnails. If you want to force the legend to be displayed on thumbnails, specify for what chart
ratio the thumbnail will be generated. Charts have a ratio of 1x1 by default, so specify minSizeForLegend="1x1" to force legends for all charts. If you want to display legends for all charts that have a width that is twice their height,
specify minSizeForLegend="2x1".
If a chart has an attribute legend="false", then its legend will not be included on the thumbnail even if its ratio matches the one specified in minSizeForLegend.
In order to tell Squore to rate groups of project, you can use the following attributes for
the dashboard
element:
scoreGroups
(optional, default: false) turns the rating display on or off for groups of projects. When rating groups is disabled, you can use a group icon instead by defining it in a properties file (G.<group_name>.ICON=path/to/icon.ico).
indicatorId
(optional, default: LEVEL) is the indicator to use to rate the project group when
scoreGroups
is set to true.
aggregationType
(optional, default: AVG) is the aggregation method used to compute the indicator level
when scoreGroups
is set to true. The supported values allowed are:
MIN
MAX
OCC
AVG
DEV
SUM
MED
MOD
The charts area allows displaying a series charts.
The table area shows information about the projects analysed with the current model. Projects that do not belong to the portfolio are not shown.
The first column allows to check or uncheck the projects whose information
should be used to compute data on the charts. The information can be aggregated in the charts
in several ways using the aggregationType
attribute of a
measure
or indicator
element. In Model/Group Dashboards,
aggregating has the effect of showing one line per project for each metric defined in the chart.
You can find out more about this attribute in the section called “Common Attributes for measure and indicator
”.
A series of build-in columns show the project owner, the name of the last version and the project's rating. They can be shown or hidden using the following attributes of the table element:
Other columns, showing specific information about the project, are defined manually as follows:
<table id="PROJECT_SUMMARY" hideLastVersion="false" hideCreator="true" hideLevel="false">
	<column indicatorId="BUSINESS_VALUE" headerDisplayType="NAME" displayType="VALUE" "decimals="0" />
	<column indicatorId="QUALITY" headerDisplayType="NAME" displayType="VALUE" decimals="2" suffix="%"/>
	<column indicatorId="TECH_DEBT" headerDisplayType="NAME" displayType="VALUE" decimals="0" />
	<column indicatorId="TECH_DEBT_IDX" headerDisplayType="NAME" displayType="VALUE" decimals="2" suffix="/FUNC"/>
	<column indicatorId="SUMSLOC" headerDisplayType="NAME" displayType="VALUE" decimals="0" />
</table>
The
column
sub-element has the following attributes:
indicatorId
is the unique identifier of the measure, indicator or textual information to be displayed.
headerDisplayType
(in Model/Group Dashboards)
or
displayType
(in Artefact Dashboards)
(optional, default: MNEMONIC)
defines how the indicator is shown in the interface. The supported values are:
NAME
MNEMONIC
DESCRIPTION
displayOnlyIf
(optional) allows specifying a computation to evaluate whether or not to show the chart in the dashboard. If
the result of the computation is more than 0, then the chart is displayed. Consult Chapter 5, Expression Syntax for
more information about the supported computation syntax. Note that computations used in
displayOnlyIf
have a limited scope: they only apply to the current node in its current version.
This means that the functions like PREVIOUS_VALUE(), PREVIOUS_INFO(), DELTA_VALUE(), APP(), ANCESTOR(), PARENT() or
IS_DP_OK() cannot be used with displayOnlyIf
.
displayedValue
(optional)
allows overriding the indicator to display another measure instead.
The attribute takes a measure Id (displayedValue="SLOC").
displayType
(at model-level) or
displayValueType
(at artefact-level)
(optional, default: VALUE)
defines how the indicator's value is shown in the interface. It
may be one of:
NAME the level's name
MNEMONIC the level's mnemonic
RANK the level's rank
VALUE the measure's value
ICON the level's icon
DATE the measure value converted to date format
DATETIME the measure value converted to datetime format
TIME the measure value converted to time format
TEXT when the metric you are trying to display is textual information, as described in the section called “Common Attributes for info
”
PERCENT to automatically convert a value between 0 and 1 into a percentage (also appending '%' as a suffix)
For DATE,DATETIME and TIME, you can specify the required format using the dateStyle, timeStyle and datePattern attributes described below.
unknownValue
(optional, default: "?")
defines what text
to display if the level of the indicator is UNKNOWN or outside the specified dataBounds
. Set this to OFF
to use the old behaviour (which display the rank -1).
emptyValue
(optional, default: "-")
defines what text
to display if there is no value in the database for the specified metric, or if a date is not specified.
This is usually useful if a date has not been set yet manually in a form (and is therefore equal to 0), or if you have just added a
new metric to your model you want to display specific text for the versions of your project where this metric did
not exist yet.
dataBounds
(optional, default:[;[)
allows overriding the normal range of values that would trigger the display of the
unknownValue
text. This allows you to display the unknown value if the metric
associated with the indicator is not within the defined bounds.
dateStyle
(optional, default: DEFAULT): the date formatting style,
used when the displayType is one of DATE or DATETIME.
timeStyle
(optional, default: DEFAULT): the time formatting style,
used when the displayType is one of DATETIME or TIME. See above for available styles.
datePattern (formerly dateFormat)
(optional, default: empty): the date pattern, used when
the displayType is one of DATE,
DATETIME or TIME.
If this attribute is set, both dateStyle and timeStyle attributes are ignored. The date is formatted using the supplied pattern. Any format compatible with the Java Simple Date Format can be used. Refer to http://docs.oracle.com/javase/6/docs/api/java/text/SimpleDateFormat.html for more information.
suffix
(optional, default: empty) is the label displayed after the value of the metric in the UI
decimals
(optional, default: 0) is the number of decimals places to be used for displaying values
roundingMode
(optional, default: HALF_EVEN)
defines the behaviour used for rounding the numerical values displayed. The supported values are:
CEILING to round towards positive infinity.
DOWN to round towards zero.
FLOOR to round towards negative infinity.
HALF_DOWN to round towards "nearest neighbour" unless both neighbours are equidistant, in which case round down.
HALF_EVEN to round towards the "nearest neighbour" unless both neighbours are equidistant, in which case, round towards the even neighbour.
HALF_UP to round towards "nearest neighbour" unless both neighbours are equidistant, in which case round up.
UP to round away from zero.
For more examples of rounding mode, consult http://docs.oracle.com/javase/6/docs/api/java/math/RoundingMode.html.
Dashboards for artefacts consist of two areas: the scorecard area and the charts area. When clicking the name of an analysis model instead of an artefact, then a special dashboard is used: the Model/Group Dashboard.
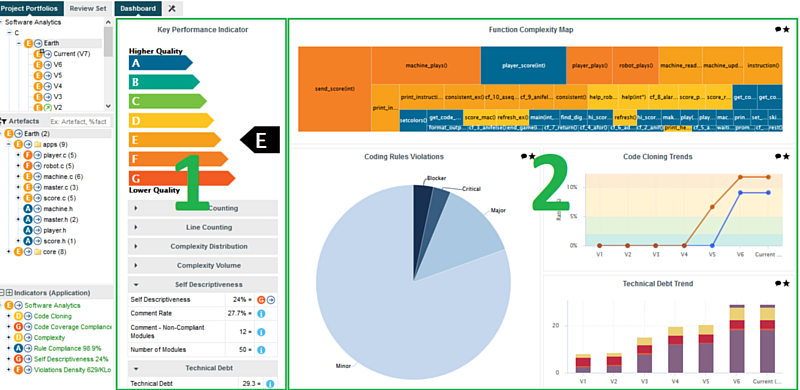
The Squore Artefact Dashboard Areas
The type of the artefact targeted is specified in the definition of the dashboard. The number of columns used in the graphics area and the default width and height of graphics can optionally be set.
<dashboard type="APPLICATION" nbColumns="4" defaultWidthValue="500" defaultHeightValue="500" >
	<scorecard> ... </scorecard>
	<charts> ... </charts>
</dashboard>
The dashboard
element supports the following sub-elements:
The dashboard
element supports the following attributes:
type
(mandatory)
is the type of artefact that this dashboard definition applies to.
nbColumns
(optional, default: 3)
sets the number of columns used to display the charts on the dashboard.
defaultWidthValue
(optional, default: 400)
sets the default width of a maximised chart if not specified within the chart itself.
defaultHeightValue
(optional, default: 400)
sets the default height of a maximised chart if not specified within the chart itself.
rowMaxHeight
(optional, default: 250)
define the maximum height in pixels of a row of charts on the dashboard.
template
(optional, default: 1x1 for all charts)
allows changing the aspect ratio of charts in the dashboard, using the syntax "position:width x height;".
Note that the use of this attribute requires defining a value for the nbColumns
attribute.
For more details about dashboard templates, refer to the section called “Dashboard Templates”.
minSizeForLegend
(optional, default: no legends on thumbnails)
allows displaying chart legends on the thumbnails for charts whose ratio is above the specified minimum. By default,
no chart legends are displayed on thumbnails. If you want to force the legend to be displayed on thumbnails, specify for what chart
ratio the thumbnail will be generated. Charts have a ratio of 1x1 by default, so specify minSizeForLegend="1x1" to force legends for all charts. If you want to display legends for all charts that have a width that is twice their height,
specify minSizeForLegend="2x1".
If a chart has an attribute legend="false", then its legend will not be included on the thumbnail even if its ratio matches the one specified in minSizeForLegend.
The scorecard shows a picture representing a chart (usually the artefact KPI) and a set of tables with further information. Each table has its own set of lines with various information. The structure used to define the scorecard is shown below:
<scorecard>
	<chart ... />
	<tables>
		<table id="DECISION_MAKING" opened="true">
			<line indicatorId="BUSINESS_VALUE" displayType="NAME" decimals="0" suffix="FP" />
			...
		</table>
		...
	</tables>
</scorecard>
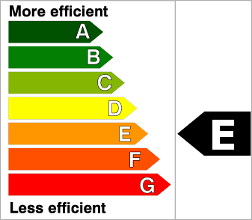
Key Performance Indicator
For more information about how to insert a KPI into the scorecard, refer to Key Performance Indicator.
There may be any number of tables below the KPI chart, and there may be any number of lines in each table.
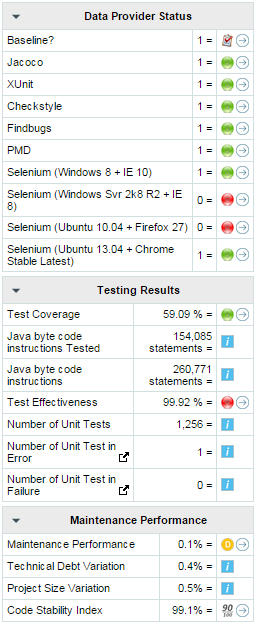
A scorecard information table using 3 tables with respectively 10, 7, and 4 lines.
A scorecard table is defined using the following syntax:
<tables displayContext="false" hideLinks="ALL">
	<table name="My Table Name" id="TABLE_ID" opened="true">
		<line indicatorId="BUSINESS_VALUE" displayType="NAME" decimals="0" suffix="FP" emptyValue="-" exclude="TESTER" />
		<line indicatorId="QUALITY" displayType="NAME" decimals="1" suffix="%" />
		<line indicatorId="SI" displayType="NAME" decimals="1" suffix="%" />
	</table>
	<table id="TABLE_ID">
		...
	</table>
	...
</tables>
The tables
element accepts the following attributes:
displayContext
(optional, default: false) allows to
automatically insert an Artefact context table containing
the current artefact's project, version and name, as shown below:
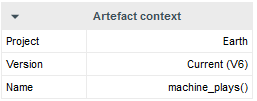
The artefact context table
The table name is not configurable.
hideLinks
allows managing the display of the
links tables in the scorecard. All links tables are shown by default. You can hide a table by setting the
value of the attribute to <LinkType>#<direction>,
where LinkType is the type of link between artefacts,
and direction is a choice of OUT or
IN, for example:
hideLinks="TEST_SPEC#OUT;TASK#IN".
If you want to hide all links tables in the scorecard, use hideLinks="ALL".
The name of the table can be configured using properties files, as
explained in the section called “Descriptions”. If you need more control over where links tables
are displayed in the scorecard, you can manually insert a links table using the linksTable
element, described later in this section.
The table
element accepts the following attributes:
id
(mandatory) is used to find the localised
version of the table name in a .properties file.
name
(optional, default: empty) allows
bypassing the search for a localised string
backgroundColor
(optional, default: WHITE for charts, GREY for tables) allows specifying a background colour for a chart or a table. [colour syntax]
opened
(optional, default: false) defines
whether a table is opened or collapsed by default
displayType
(optional, default: no default) defines the
displayType
to be used by all lines in this table. It can be overridden for
each line if necessary. For full details, consult the displayType reference for the line element.
displayOnlyIf
(optional) allows specifying a computation to evaluate whether or not to show the chart in the dashboard. If
the result of the computation is more than 0, then the chart is displayed. Consult Chapter 5, Expression Syntax for
more information about the supported computation syntax. Note that computations used in
displayOnlyIf
have a limited scope: they only apply to the current node in its current version.
This means that the functions like PREVIOUS_VALUE(), PREVIOUS_INFO(), DELTA_VALUE(), APP(), ANCESTOR(), PARENT() or
IS_DP_OK() cannot be used with displayOnlyIf
.
The line
element accepts the following attributes:
indicatorId
is the unique identifier of the measure, indicator or textual information to be displayed.
headerDisplayType
(in Model/Group Dashboards)
or
displayType
(in Artefact Dashboards)
(optional, default: MNEMONIC)
defines how the indicator is shown in the interface. The supported values are:
NAME
MNEMONIC
DESCRIPTION
displayOnlyIf
(optional) allows specifying a computation to evaluate whether or not to show the chart in the dashboard. If
the result of the computation is more than 0, then the chart is displayed. Consult Chapter 5, Expression Syntax for
more information about the supported computation syntax. Note that computations used in
displayOnlyIf
have a limited scope: they only apply to the current node in its current version.
This means that the functions like PREVIOUS_VALUE(), PREVIOUS_INFO(), DELTA_VALUE(), APP(), ANCESTOR(), PARENT() or
IS_DP_OK() cannot be used with displayOnlyIf
.
displayedValue
(optional)
allows overriding the indicator to display another measure instead.
The attribute takes a measure Id (displayedValue="SLOC").
displayType
(at model-level) or
displayValueType
(at artefact-level)
(optional, default: VALUE)
defines how the indicator's value is shown in the interface. It
may be one of:
NAME the level's name
MNEMONIC the level's mnemonic
RANK the level's rank
VALUE the measure's value
ICON the level's icon
DATE the measure value converted to date format
DATETIME the measure value converted to datetime format
TIME the measure value converted to time format
TEXT when the metric you are trying to display is textual information, as described in the section called “Common Attributes for info
”
PERCENT to automatically convert a value between 0 and 1 into a percentage (also appending '%' as a suffix)
For DATE,DATETIME and TIME, you can specify the required format using the dateStyle, timeStyle and datePattern attributes described below.
unknownValue
(optional, default: "?")
defines what text
to display if the level of the indicator is UNKNOWN or outside the specified dataBounds
. Set this to OFF
to use the old behaviour (which display the rank -1).
emptyValue
(optional, default: "-")
defines what text
to display if there is no value in the database for the specified metric, or if a date is not specified.
This is usually useful if a date has not been set yet manually in a form (and is therefore equal to 0), or if you have just added a
new metric to your model you want to display specific text for the versions of your project where this metric did
not exist yet.
dataBounds
(optional, default:[;[)
allows overriding the normal range of values that would trigger the display of the
unknownValue
text. This allows you to display the unknown value if the metric
associated with the indicator is not within the defined bounds.
dateStyle
(optional, default: DEFAULT): the date formatting style,
used when the displayType is one of DATE or DATETIME.
timeStyle
(optional, default: DEFAULT): the time formatting style,
used when the displayType is one of DATETIME or TIME. See above for available styles.
datePattern (formerly dateFormat)
(optional, default: empty): the date pattern, used when
the displayType is one of DATE,
DATETIME or TIME.
If this attribute is set, both dateStyle and timeStyle attributes are ignored. The date is formatted using the supplied pattern. Any format compatible with the Java Simple Date Format can be used. Refer to http://docs.oracle.com/javase/6/docs/api/java/text/SimpleDateFormat.html for more information.
suffix
(optional, default: empty) is the label displayed after the value of the metric in the UI
decimals
(optional, default: 0) is the number of decimals places to be used for displaying values
roundingMode
(optional, default: HALF_EVEN)
defines the behaviour used for rounding the numerical values displayed. The supported values are:
CEILING to round towards positive infinity.
DOWN to round towards zero.
FLOOR to round towards negative infinity.
HALF_DOWN to round towards "nearest neighbour" unless both neighbours are equidistant, in which case round down.
HALF_EVEN to round towards the "nearest neighbour" unless both neighbours are equidistant, in which case, round towards the even neighbour.
HALF_UP to round towards "nearest neighbour" unless both neighbours are equidistant, in which case round up.
UP to round away from zero.
For more examples of rounding mode, consult http://docs.oracle.com/javase/6/docs/api/java/math/RoundingMode.html.
The external links in the lines of the score card tables are generated automatically according to the metric that
the line displays. They will generally link to the list of findings that are used to compute
the metric. You can however override the URL and set your own external URL. In order to do this, ensure that the metric
MY_METRIC displayed in a table line has a
MY_METRIC.URL
property defined in a properties file in your model. For more information about properties files, consult the section called “Descriptions”.
The linksTable
element is used instead of table
to insert a links table,
and accepts the following attributes:
id
(mandatory) is used to find the localised
version of the table name in a .properties file.
type
(mandatory) is the id of the type of
links the table displays.
direction
(optional, default: OUT) defines the direction of
the links to display. Set it to OUT to show outbound links or
IN to display inbound links.
For more information about artefact links, consult the section called “Artefact Links”.
You can use dashboard templates to highlight some of the charts on your dashboard by changing their size in terms of grid slots they occupy. The following is an example template that uses 4 columns of charts with custom aspect ratios applied to the first three charts:
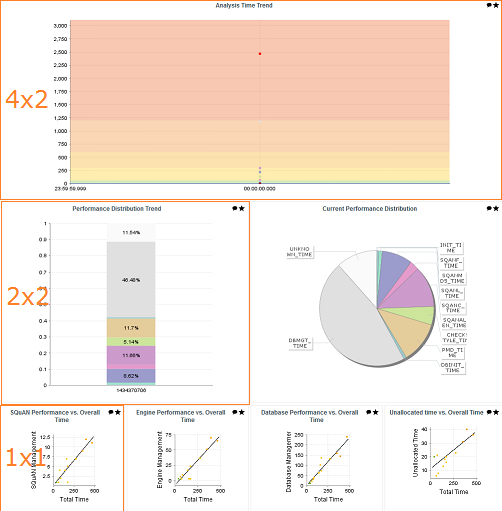
<?xml version="1.0" encoding="UTF-8"?>
<roles xmlns:xi="http://www.w3.org/2001/XInclude">
	<role name="DEFAULT">
		<dashboard nbColumns="4" type="APPLICATION" template="1:4x2;2:2x2;3:2x2">
		(...)
			<charts>
				<xi:include href="chart1.xml" />
				<xi:include href="chart2.xml" />
				<xi:include href="chart3.xml" />
				<xi:include href="chart4.xml" />
				<xi:include href="chart5.xml" />
				<xi:include href="chart6.xml" />
				<xi:include href="chart7.xml" />
			</charts>
		</dashboard>
	</role>
</roles>
Note that you only need to specify custom dimensions for non-standard charts sizes using the syntax "position:width x height;", other charts will use a 1x1 grid slot by default.
Charts are displayed on the right hand side of the dashboard. They
are defined via chart
elements as follows:
<charts>
	<chart id="CHART_ID" type="CHART_TYPE">
		<indicator>INDICATOR_1</indicator>
		<indicator>INDICATOR_2</indicator>
		<indicator>INDICATOR_3</indicator>
	</chart>
	<chart id="CHART_ID">
	...
	</chart>
	  ...
</charts>
You can read more about the available charts in Chapter 7, Charts Reference.
Table of Contents
chart
measure and indicator
info
In this chapter, you can find all the configuration options available for the charts supported in Squore. The following sections will cover in details the different types of charts offered by Squore.
There are many types of charts. The best approach to finding the chart you want to use on your dashboard can be found by answering the following questions:
Should my chart display a trend or reflect the data for a single version of my project?
Is the information I want to display abut the current artefact or about its descendants?
Will my chart display one bit of information or combine several?
Is the information displayed by my chart quantitative or qualitative?
Answering these questions will lead you toward the type of chart you want to use. The table below shows the type of answer offered by each of the charts available in Squore:
Table 7.1. Charts for Single-Version Data Visualisation
| Current Artefact Data | Descendants of the Current Artefact | ||||||
| Quantitative Information | Qualitative Information | Quantitative Information | Qualitative Information | ||||
|
Single Dataset | Multiple Datasets |
Single Dataset | Multiple Datasets |
Single Dataset | Multiple Datasets |
Single Dataset | Multiple Datasets |
| N/A | |||||||
Table 7.2. Charts for Trend-Based Visualisation
| Current Artefact Data | Descendants of the Current Artefact | ||||||
| Quantitative Information | Qualitative Information | Quantitative Information | Qualitative Information | ||||
|
Single Dataset | Multiple Datasets |
Single Dataset | Multiple Datasets |
Single Dataset | Multiple Datasets |
Single Dataset | Multiple Datasets |
| N/A | N/A | N/A | N/A | N/A | |||
Although attributes may be different depending on the type of chart, some are common to all charts:
type
(mandatory) defines the type of chart, as listed
below.
id
(mandatory) is an unique identifier for the chart that can be used to add a localisable description in properties files.
name
(optional) is the display name of the chart on the dashboard. Note that the value of this attribute is used as a
fallback in case no translation is found for the chart's ID.
You should use C.CHART_ID.NAME=My Chart Name
in a properties file to define a chart's name for CHART_ID instead of using this attribute.
orientation
(optional, default: VERTICAL) allows defining the orientation of the chart. The allowed values are VERTICAL and HORIZONTAL.
backgroundColor
(optional, default: WHITE for charts, GREY for tables) allows specifying a background colour for a chart or a table. [colour syntax]
plotBackgroundColor
(optional, default: same value as backgroundColor
) sets the background of the plotting area of the chart to the specified colour. [colour syntax]
xMin, xMax
(optional, defaults to automatic values) allow defining the desired boundaries for the x-axis. This attribute
can be specified as a value or as a computation.
yMin, yMax
(optional, defaults to automatic values) allow defining the desired boundaries for the y-axis. This attribute
can be specified as a value or as a computation.
displayOnlyIf
(optional) allows specifying a computation to evaluate whether or not to show the chart in the dashboard. If
the result of the computation is more than 0, then the chart is displayed. Consult Chapter 5, Expression Syntax for
more information about the supported computation syntax. Note that computations used in
displayOnlyIf
have a limited scope: they only apply to the current node in its current version.
This means that the functions like PREVIOUS_VALUE(), PREVIOUS_INFO(), DELTA_VALUE(), APP(), ANCESTOR(), PARENT() or
IS_DP_OK() cannot be used with displayOnlyIf
.
exclude
(optional) allows specifying a list of roles that will not see the chart.
xLabel
(optional) overrides the default name given to the x axis for charts that use axes.
yLabel
(optional) overrides the default name given to the x axis for charts that use axes.
aggregate
(optional, only valid in Model/Group Dashboards, default: false) specifies that the metrics shown on the chart are aggregated. The
aggregation type is defined for each measure with the aggregationType
,
as described in the section called “Common Attributes for measure and indicator
”.
legend
(optional, default: false for quadrants, true for other types of charts) allows specifying if the chart's legend is shown (true) or hidden (false).
Most charts use the measure
and indicator
elements to define
the metrics used in the chart. The attributes allowed for these element are:
label
(optional, default: the measure's name) defines or overrides the label used for the measure. Note that the chart thumbnail will always show the mnemonic no matter what the value of label
is.
color
(optional, default: the project's color, or a random color based on the artefact's name) defines the colour used to represent the measure in the chart. [colour syntax]
visible
(optional, default: true) allows including a measure on a chart as hidden. It will not be displayed by default, but can be added to the chart by clicking its name in the legend.
dataBounds
(optional, default: "];[") defines the range of values allowed to be displayed on the chart. You can use this attribute to exclude drawing an erroneous or non-representative value on a chart. This attribute is currently supported for the following charts: All Temporal Evolution charts, Quadrant, X/Y-Cloud, Histogram, Y-Cloud, Dial, , Simple Pie and Optimised Pie.
[ and ] allow you to specify that a boundary value is included.
] and [ specify that the boundary value itself is excluded.
shape
(optional, default: CIRCLE) defines the shape used to represent a point on a chart. The allowed values are:
NONE
SQUARE
CIRCLE
DIAMOND
UP_TRIANGLE
DOWN_TRIANGLE
RIGHT_TRIANGLE
LEFT_TRIANGLE
HORIZONTAL_RECTANGLE
VERTICAL_RECTANGLE
HORIZONTAL_ELLIPSE
VERTICAL_ELLIPSE
stroke
(optional, default: SOLID) defines the type of line used join points. The allowed values are NONE, SOLID and DOTTED.
aggregationType
(optional, default: AVG in most charts, SUM in table charts) defines how the values for the
metrics on the chart are aggregated. The supported values are:
MIN
MAX
OCC
AVG
DEV
SUM
MED
MOD
weightMeasure
(optional, default: none) allows specifying how to weigh artefacts against each other in some charts (Simple Bar, Simple Pie and Simple Temporal Evolution Stacked Bar Chart). This is useful when you want to represent a percentage of artefacts in a chart but want the ratios to be based on a metric instead using the number of artefacts. Consider the example below where a chart shows child file artefacts and their rating the standard way (left), or weighted by lines of code per artefact (right, with weightMeasure="LC"):
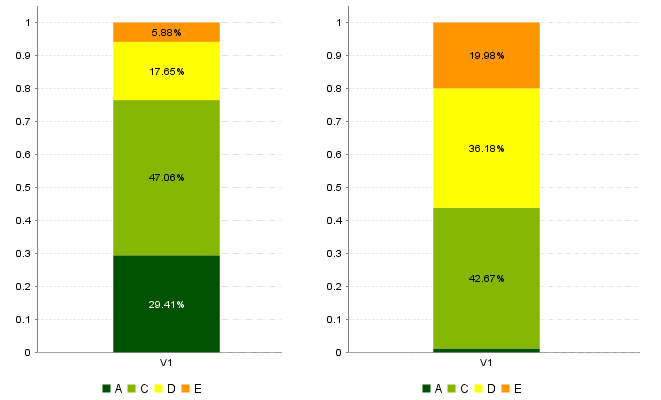
Child file artefacts and their rating the standard way (left), or weighted by lines of code per artefact (right)
Attributes that are specific to certain charts only are documented in each chart's section.
Some charts support dynamically grouping target artefacts according to textual information in a measure. In order to use this information, you do not use an indicator
or measure
element but an info
element with the measure holding the text information.
You can hide or exclude unwanted textual information from charts with:
excludeInfos
(optional, default: empty) to completely ignore information. The specified
strings will not be shown on the chart and will not be included in any calculations on the chart.
hideInfos
(optional, default: empty) to hide information on the chart but make it appear
in the legend so users can manually click to activate it.
Here is a sample definition for a Simple Bar chart where each bar is labelled according to the textual information
held in the ASSIGNEE metric.
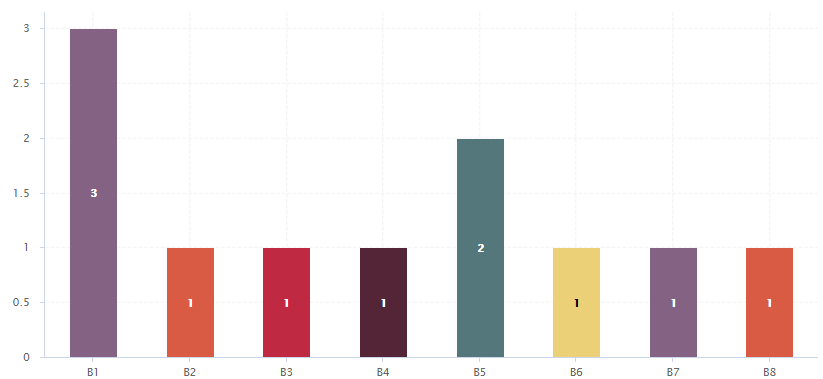
A Simple Bar chart using the CODE_TYPE textual information from CODE artefacts.
<chart type="SimpleBar" id="INFO_EXAMPLE" targetArtefactTypes="CODE">
<info hideInfos="UNKNOWN;UNSURE;N/A" excludeInfos="INVALID_DATA">CODE_TYPE</info>
</chart>
You can also display textual information in tables, using the following syntax for example:
<table id="INFO_TABLE_EXAMPLE">
<line indicatorId="CODE_TYPE" displayValueType="TEXT" />
</table>
For more information about tables, consult the section called “Scorecard Tables” or the section called “Model/Group Dashboards”.
All distributed charts allow the use of one or more
filterMeasure
elements, which allow refining which artefacts are included on the chart. When drawing a chart, Squore checks if the metric specified is within the defined bounds for the artefact, in order to know if it should be included in or excluded from the chart.
Distributed charts are charts that show metrics for the descendents of the current artefacts. Note that distributed, temporal charts and charts in Model/Group Dashboards do not support filterMeasure
at this time.
You can use the filterMeasure
(with a mandatory dataBounds
attribute) as follows:
<chart id="CHART_ID" type="CHART_TYPE">
<measure>METRIC_A</measure>
<measure>METRIC_B</measure>
<filterMeasure dataBounds="[50;100]">METRIC_C</filterMeasure>
</chart>
In the example above, the chart will include the artefact only if METRIC_C is between 50 and 100.
All the chart attributes that allow specifying a colour (for a background, a series, markers and text) support the following syntax:
Some colours can also be used directly by name:
WHITE
LIGHT_GRAY
GRAY
DARK_GRAY
BLACK
RED
PINK
ORANGE
YELLOW
GREEN
MAGENTA
CYAN
BLUE
Using the colour's RGB value: Green is color="0,128,0" or color="rgb(0,128,0)"
Using the colour's integer value: Green is color="32768"
Using the colour's HTML code: Green is color="#008800"
When you do not explicitely specify a colour for an element, Squore automatically generates a set of consistent random colours used on the dashboard.
Scales levels also have associated colours so that they can be represented in the charts. The colour of each level of performance is defined in a .properties file (see the section called “Descriptions”, and the same syntax as the one explained above is supported.
Datasets are used to apply different rendering settings to different sets of measures in a chart. Each dataset can use its own axis configuration.
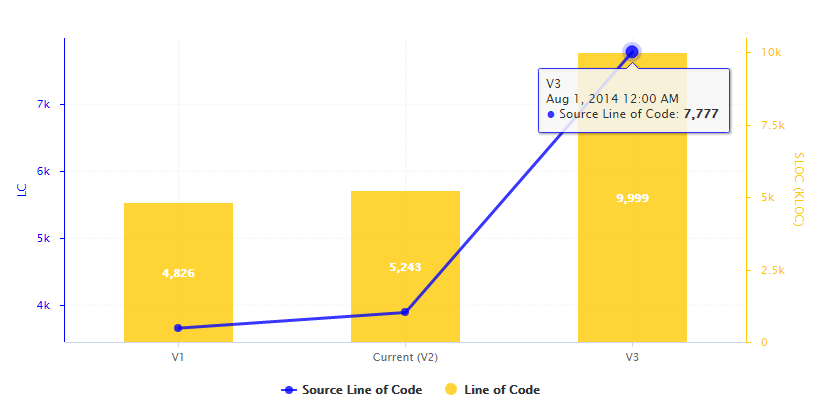
Two metrics styled with two different datasets in the same chart.
<chart type="TE" id="DATASETS_EXAMPLE">
<dataset renderer="LINE" rangeAxisId="AXIS_RAW">
	<measure color="BLUE" alpha="200" label="Source Line of Code">SLOC
		<forecast>
			<version value="7777" timeValue="DATE(2014,08,01)" label="V3" />
		</forecast>
	</measure>
</dataset>

<dataset renderer="BAR" rangeAxisId="AXIS_KLOC">
	<measure color="ORANGE" alpha="200" label="Line of Code">LC
		<forecast>
			<version value="9999" timeValue="DATE(2014,08,01)" label="V3" />
		</forecast>
	</measure>
</dataset>

<rangeAxis id="AXIS_RAW" label="LC" color="BLUE" />
<rangeAxis id="AXIS_KLOC" label="SLOC (KLOC)" color="ORANGE" />
</chart>
There are 7 basic types of renderers. Each one has can be prefixed with the STACKED_ modifier to stack data series on top of each other, and suffixed with the _100 modifier that displays data series as percentages:
BAR
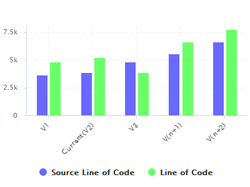 BAR |
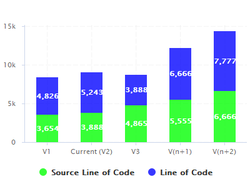 STACKED_BAR |
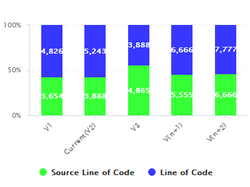 STACKED_BAR_100 |
LINE
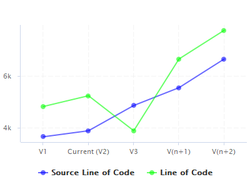 LINE |
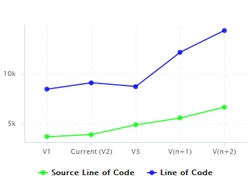 STACKED_LINE |
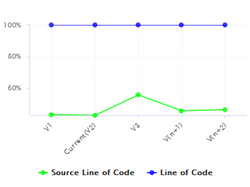 STACKED_LINE_100 |
STEP
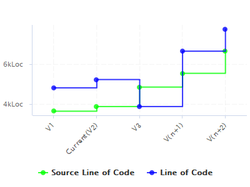 STEP |
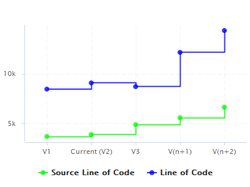 STACKED_STEP |
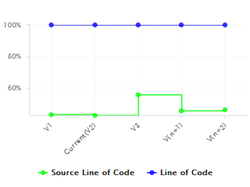 STACKED_STEP_100 |
SPLINE
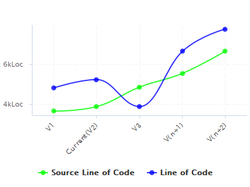 SPLINE |
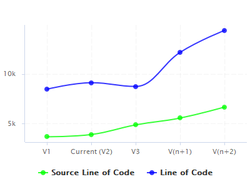 STACKED_SPLINE |
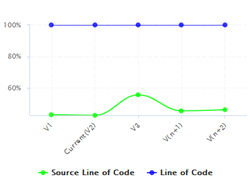 STACKED_SPLINE_100 |
AREA
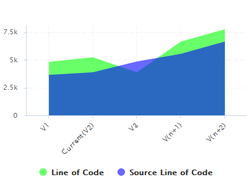 AREA |
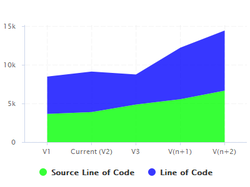 STACKED_AREA |
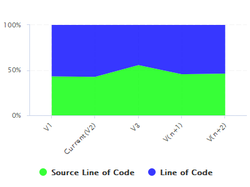 STACKED_AREA_100 |
AREA_STEP
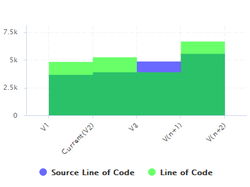 AREA_STEP |
 STACKED_AERA_STEP |
 STACKED_AREA_STEP_100 |
AREA_SPLINE
 AREA_SPLINE |
 STACKED_AREA_SPLINE |
 STACKED_AREA_SPLINE_100 |
The dataset
element accepts the following attributes:
Chart axes can be defined using the rangeAxis
element, which accepts the following attributes:
id
(mandatory) The configuration identifier (referred to by a dataset
element)
label
(optional, default: the measure name) The label to be displayed on the axis
min
(optional, defaults to an automatic value) is the minimum boundary for the axis. This attribute can be specified as a value or as a computation.
max
(optional, defaults to an automatic value) is the maximum boundary for the axis. This attribute can be specified as a value or as a computation.
visible
(optional, default: true) allows hiding a vertical axis when set to false
hideTickLabels
(optional, default: false) allows hiding values on vertical axes when set to true
inverted
(optional, default: false) reverses the order of values on the axis when set to true.
location
(optional, default: left for vertical charts, bottom for horizontal charts)
allows defining where around the chart the axis is drawn. Allowed values are: left,
right, bottom and top.
color
(optional, default: automatically assigned) sets the colour used to draw the scale. [colour syntax]
type
(optional, default: NUMBER) defines how the axis is represented. Accepted values are:
If you are looking to display dates on your axes, simply add a milestoneHistory
element
to your chart, as described in the section called “Displaying Milestone Date Changes”.
numberFormat
(optional, default: usually number) allows
customising the number format
when using type="number". The accepted values are as follows:
NUMBER to display a number (formatted according to the browser's locale)
PERCENT to display a percentage
INTEGER to display a number with no decimals
The rangeAxis
element also accepts one or more marker
child
elements so you can insert markers, as described in the section called “Using Markers”. This makes the following possible:
<rangeAxis id="AXIS_COMPLETION" label="Completed tasks (%)" >
<marker fromScale="SCALE_COMPLETION" isVertical="false" />
</rangeAxis>
Charts that include axes also allow the use of markers. Markers are coloured regions of the chart area that help put the displayed value into context. For example, you could display a line chart of the evolution of the main indicator for your project and use markers to visually associate the value of the indicator with its level, as shown below:
File size distribution in a project, using markers to draw zones corresponding to a scale gauging files by size
<chart type="Histogram" id="MARKERS_EXAMPLE" targetArtefactTypes="FILE" nbBars="10">
<measure color="WHITE">LC</measure>
<markers>
	<marker fromIndicator="LC" alpha="150" isVertical="true" />
</markers>
</chart>
Simpler markers can be drawn as vertical or horizontal lines, as shown below:
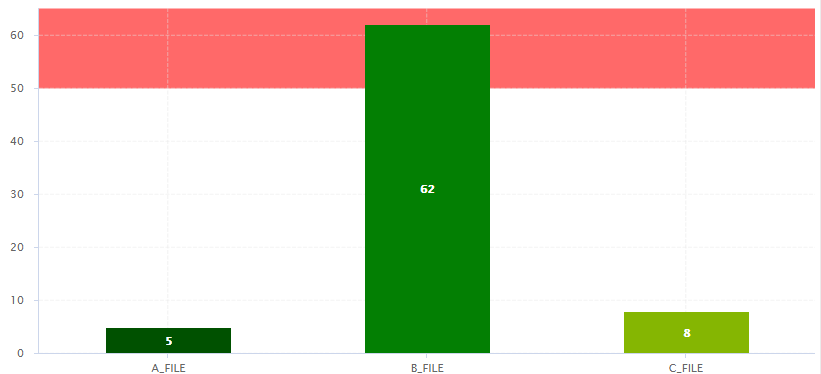
The evolution of an indicator within the levels of its associated scale, using markers to represent the different scale levels
<chart type="OptimizedBar" id="MARKERS_VERTICAL_EXAMPLE" asPercentage="false">
<measure color="0,81,0">A_FILE</measure>
<measure color="3,127,3">B_FILE</measure>
<measure color="133,182,2">C_FILE</measure>
<markers>
	<marker value="50" endValue="100" color="RED" alpha="150" isVertical="false" />
</markers>
</chart>
There are five ways to include markers on a chart:
By using a scale ID to apply colouring to the entire background for all available scale levels. See the fromScale
attribute below.
By using an indicator ID to apply colouring to the entire background for all available scale levels associated to the indicator. See the fromIndicator
attribute below.
By specifying a metric to display its goal for each milestone in the project. See the fromMilestonesGoal
attribute below.
By requesting to display a marker for the dates of all milestones in the project. See the fromMilestones
attribute below.
By manually specifying the start and end values on the axes, and the colour of the marker you want. See the value
, endValue
and color
attributes below.
The marker
element has the following attributes:
fromScale
(optional, not compatible with value/endValue
) sets the scale to use to create a markers for each scale level using the
colour defined in the scale's properties.
fromIndicator
(optional) sets the indicator to use to retrieve a scale and create a markers for each scale level using the
colour defined in the scale's properties.
fromMilestonesGoal
(optional) draws markers for all of a metric's goals in the project. You can find an example in the section called “Milestone-Based Markers”.
fromMilestones
(optional) draws markers for all milestone dates in the project. You can find an example in the section called “Milestone-Based Markers”.
value
(optional, default: -infinity, cannot be combined with fromIndicator
, fromScale
,fromMilestonesGoal
, or fromMilestones
) sets the position on the axis to start drawing the marker from. You can specify an exact value, a percentage, or a compuration for this parameter.
endValue
(optional, default: infinity, cannot be combined with fromIndicator
, fromScale
,fromMilestonesGoal
, or fromMilestones
) sets the position on the axis to stop drawing the marker. You can specify an exact value, a percentage, or a compuration for this parameter.
isInterval
(optional, default: true, cannot be combined with fromIndicator
or
fromScale
) allows defining whether a marker covers an interval (true) or is simply a
line on the chart (false). When set to false, endValue
is ignored, and
the following extra parameters are available:
color
(optional, default: GREY, not compatible with fromIndicator
or fromScale
) is the colour code used to fill the marker region. [colour syntax]
alpha
(optional, default: 50) sets the opacity level (0 is transparent, 255 is fully
opaque).
isVertical
(optional, default: false)
specifies if the marker should be vertical (true) or horizontal
(false).
label
(optional, default: none) allows specifying a label for the marker.
labelColor
(optional, default: BLACK) allows specifying the color of the label text. [colour syntax]
labelFontSize
(optional, default: 9) defines the size of the label text.
labelFontStyle
(optional, default: PLAIN) defines the style of the label text. Supported values are:
PLAIN
BOLD
ITALIC
BOLD_ITALIC
labelAnchor
(optional, default: TOP_RIGHT if vertical, TOP_LEFT if horizontal)
defines the position of the label relative to the marker. The possible values are:
BOTTOM
BOTTOM_LEFT
BOTTOM_RIGHT
CENTER
LEFT
RIGHT
TOP
TOP_LEFT
TOP_RIGHT
labelTextAnchor
(optional, default: TOP_LEFT if vertical, BOTTOM_LEFT if horizontal)
defines the position of the text relative to the label. The possible values are:
BASELINE_CENTER
BASELINE_LEFT
BASELINE_RIGHT
BOTTOM_CENTER
BOTTOM_LEFT
BOTTOM_RIGHT
CENTER
CENTER_LEFT
CENTER_RIGHT
HALF_ASCENT_CENTER
HALF_ASCENT_LEFT
HALF_ASCENT_RIGHT
TOP_CENTER
TOP_LEFT
TOP_RIGHT
When working with charts that support displaying a timeline (usually a Temporal Evolution
with an attribute byTime
set to true), the x-axis can be customised to display the level
of details that suits you best. The following attributes can be used:
timeInterval
(optional, default: MILLISECOND) displays only the last value available for the time period selected. This allows you to display a result trend for the past year where only the last of every month is drawn on the chart (onlyLast="12" timeInterval="MONTH"). The values allowed for this attribute are MILLISECOND, SECOND, MINUTE, HOUR, AM_PM, DAY, WEEK, WEEK_SUNDAY, WEEK_MONDAY, SEMI_MONTH, MONTH, QUARTER and YEAR. Note that for Temporal Evolution with a BAR renderer, this setting defines the width of the bar.
timeIntervalAggregationType
(optional, default: AVG) defines how the values obtained for all versions within an interval are aggregated. The allows aggregation types are:
MIN
MAX
OCC
AVG
DEV
SUM
MED
MOD
By default, the date used for each version is the actual date of when the analysis was run. However, you can override this date and specify the real date of an analysis in the UI using the Version Date field, or via the command line using the --versionDate parameter. Refer to the Command Line Interface and the Online Help for more details.
You can display future or past versions on a chart using the forecast
element on a measure, as shown below.
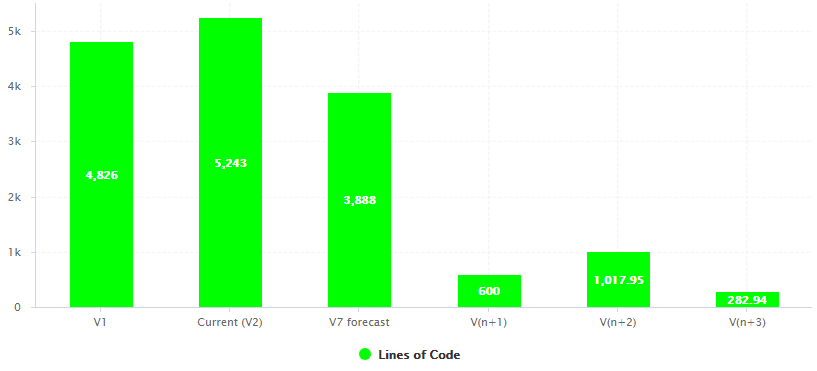
Planned (future) versions on a Temporal Evolution
<chart type="TemporalEvolution" renderer="BAR" id="TE_BAR_FORECAST">
<measure color="GREEN" label="Lines of Code">LC
	<forecast>
		<version value="SLOC" timeValue="DATE(2016,06,30)" label="V7 forecast" />
		<version value="600" timeValue="DATE(2016,07,31)" />
		<estimatedVersion timeValue="DATE(2016,08,31)" />
		<estimatedVersion timeValue="DATE(2016,09,30)" />
	</forecast>
</measure>
</chart>
The forecast points on the chart can be:
The forecast
element accepts the following attributes:
degree
(optional, default: 1) sets the degree
of the polynomial extrapolation used to compute estimated values at a specific date. Supported values are:
1 for linear
2 for quadratic
3 for cubic
minNb
(optional, default: 2) sets the minimum
number of past values to take into account to estimate future values
maxNb
(optional, default: 5) sets the maximum
number of past values to take into account to estimate future values
When using forecast
with dynamically estimated future values,
use the estimatedVersion
element with the following attributes:
When using forecast
with hard coded values for, use the
version
element with the following attributes:
value
(mandatory) is a computation valid for the current artefact type (same limitation as for displayOnlyIf
).
timeValue
(mandatory) is a computation valid for the current artefact type that is used to position the version on a time axis. The result has to be a number of milliseconds since January 1st 1970.
label
(optional, default: V(n+x)) is the label used to represent the
version on the chart.
Displaying estimates for dynamically for the next 6 months is more efficient with chart where values are plotted according to when they were created on a time axis (see the section called “Time Axis Configuration”) and can be done as shown in the following example:
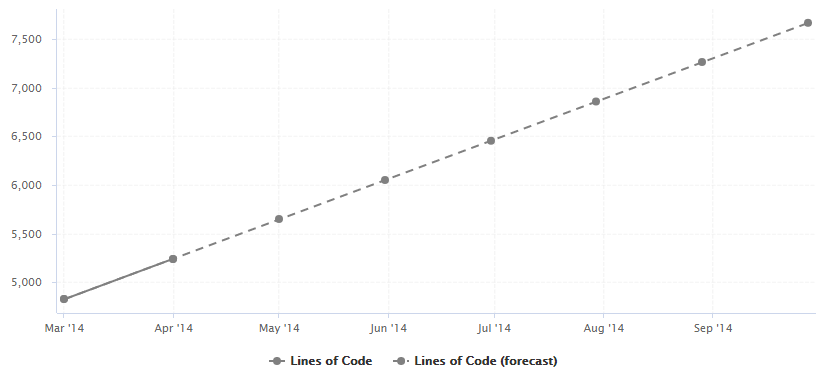
A rolling 6-month projection chart
<chart type="TE" byTime="true" id="FORECAST_ROLLING_EXAMPLE">
<measure label="Lines of Code" color="GRAY">LC</measure>
<measure stroke="DOTTED" label="Lines of Code (forecast)" color="GRAY">LC
	<forecast>
		<estimatedVersion timeValue="CURRENT_VERSION_DATE+DAYS(30)"  />
		<estimatedVersion timeValue="CURRENT_VERSION_DATE+DAYS(60)"  />
		<estimatedVersion timeValue="CURRENT_VERSION_DATE+DAYS(90)"  />
		<estimatedVersion timeValue="CURRENT_VERSION_DATE+DAYS(120)" />
		<estimatedVersion timeValue="CURRENT_VERSION_DATE+DAYS(150)" />
		<estimatedVersion timeValue="CURRENT_VERSION_DATE+DAYS(180)" />
	</forecast>
</measure>
</chart>
CURRENT_VERSION_DATE is a metric defined in the analysis model as follows:
<Measure measureId="CURRENT_VERSION_DATE" defaultValue="-1">
<Computation targetArtefactTypes="PACKAGES;FILE" result="VERSION_DATE()" />
</Measure>
On a Temporal Evolution, you can render goals graphically by defining a starting point, an end date and a value
you want to reach. This is done using the goal
element on your chart, and replaces the
deprecated Temporal Evolution Line With Goal and Temporal Evolution Bar With Goal charts.
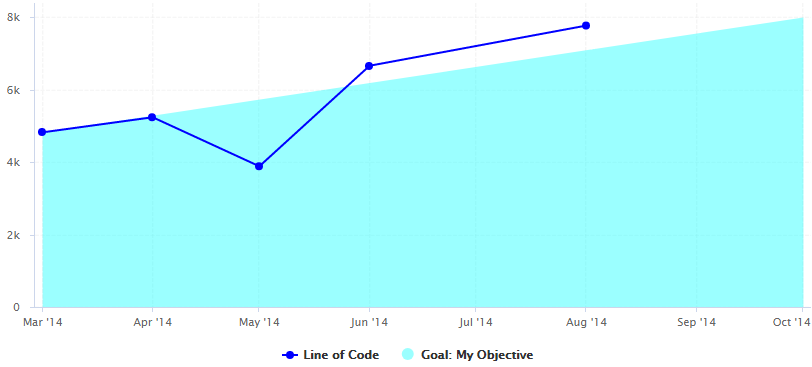
A Temporal Evolution with an area that represents the goal for the metric LC
<chart type="TE" id="GOAL_EXAMPLE" byTime="true">
<dataset renderer="AREA">
	<goal color="CYAN" alpha="100" label="My Objective">
		<forecast>
			<firstMeasureVersion id="LC" />
			<version value="8000" timeValue="DATE(2014,10,01)" />
		</forecast>
	</goal>
</dataset>
<dataset renderer="LINE">
	<measure color="BLUE" label="Line of Code">LC
		<forecast>
			<version value="SLOC" timeValue="DATE(2014,05,01)" label="V3" />
			<version value="6666" timeValue="DATE(2014,06,01)" />
			<version value="3333+4444" timeValue="DATE(2014,08,01)" />
		</forecast>
	</measure>
</dataset>
</chart>
In the example above, the first dataset (rendered as an AREA
) is used for the goal, while the second
(rendered as a LINE
) is used for the display of the LC metric.
The goal
element supports the color
, label
and alpha
attributes as they are described in the section called “Common Attributes for measure and indicator
”.
It accepts a child forecast
element with one or more traditional version
elements
(as described in the section called “Displaying Planned Versions”), as well as an optional firstMeasureVersion
attribute
that will define the starting point to draw the goal. In the example above, the goal is rendered the first time that the metric LC has
a value and is drawn using the value of this metric at this point in time. The goal to reach is hard-coded to 8000 on October 1st 2014,
but you could use any metrics from you model to generate dynamic values.
Using goals, you can easily draw burn down charts for you agile projects.
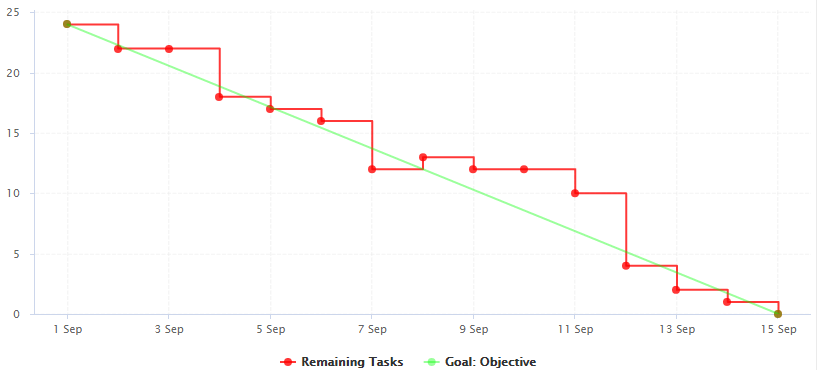
A burn down chart of remaining tasks in a sprint
<chart type="TE" id="BURN_DOWN_CHART" byTime="TRUE" timeInterval="DAY">
<dataset renderer="STEP">
	<measure color="RED" alpha="200" label="Remaining Tasks">NUM_TASKS</measure>
</dataset>
<dataset renderer="LINE">
	<goal color="GREEN" alpha="100" label="Objective">
		<forecast>
			<firstMeasureVersion id="NUM_TASKS" />
			<version value="0" timeValue="SPRINT_START + DAYS(C.SPRINT_LENGTH)" />
		</forecast>
	</goal>
</dataset>
</chart>
In this example, we start drawing the diagonal when NUM_TASKS first has a value for the project, and set the objective to reach zero by dynamically computing the end of the sprint based on the sprint start date and a constant that defines the sprint length.
This section defines how you can integrate information about your project milestones into your charts. When you define milestones in your project (i.e. a series of goals for specific metrics at certain dates in the life of your project), you will be able to:
Display the goals defined for each milestone in your project
Display the changes made to the goals defined for each milestone
Display the date changes for your milestones
Show markers for milestone dates and goals
For more information about adding milestone management to your project, consult the section called “Project Milestones”.
If your project uses milestones, you can use the goal
element to display
all the expected values for a metric for each milestone in the project. In this case, you simply use the name of the metric whose goals
you want to display:
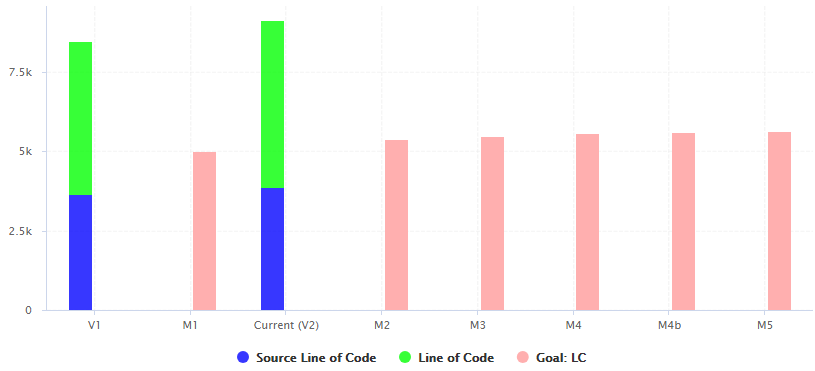
Temporal Evolution displaying the goals for the metric LC for all milestones of the project
<chart type="TemporalEvolution" id="DISPLAYING_GOALS_EXAMPLE" timeInterval="WEEK">
<dataset renderer="STACKED_BAR">
	<measure color="BLUE" alpha="200" label="Source Line of Code">SLOC</measure>
	<measure color="GREEN" alpha="200" label="Line of Code">LC</measure>
</dataset>
<dataset renderer="BAR">
	<goal color="PINK">LC</goal>
</dataset>
</chart>
In the example above, compare the blue bars with the red bars to compare actual analyses (V1, V2) against the goals for each milestone in the project (M1, M2, M3, M4, M4b and M5) for the metric LC.
You can also request the goals as they were at a certain date with the versionDate
attribute and assign a weight
to the goal, allowing you to draw other lines based on a goal:
<chart type="TE" id="DISPLAYING_GOALS_ADVANCED_EXAMPLE" byTime="true">
<dataset renderer="LINE">
	<measure color="RED" label="Line of Code">LC</measure>
	<goal color="ORANGE" versionDate="DATE(2014,03,01)" label="Old">LC</goal>
	<goal color="BLUE" versionDate="DATE(2014,05,01)" label="Current">LC</goal>
	<goal color="GREEN" shape="NONE" stroke="DOTTED" alpha="50" weight="1.5" label="Current 150%">LC</goal>
	<goal color="GRAY" shape="NONE" stroke="DOTTED" alpha="50" weight="1.1" label="Current 110%">LC</goal>
	<goal color="BLUE" shape="NONE" stroke="DOTTED" alpha="50" weight=".9" label="Current 90%">LC</goal>
	<goal color="RED" shape="NONE" stroke="DOTTED" alpha="50" weight=".75" label="Current 75%">LC</goal>
</dataset>
</chart>
In the chart above, you notice how the last 3 milestones have slipped and understand that the goals have been revised with higher expectations by observing the yellow and blue solid lines. The dotted lines can be used as guides to give you an idea of where 75%, 90%, 110% or 150% of your goal lies on the chart.
You can use the goalHistory
element in a chart if you want to track the changes made to your goals.
This is useful in a post mortem when you review deviations from your original goals.
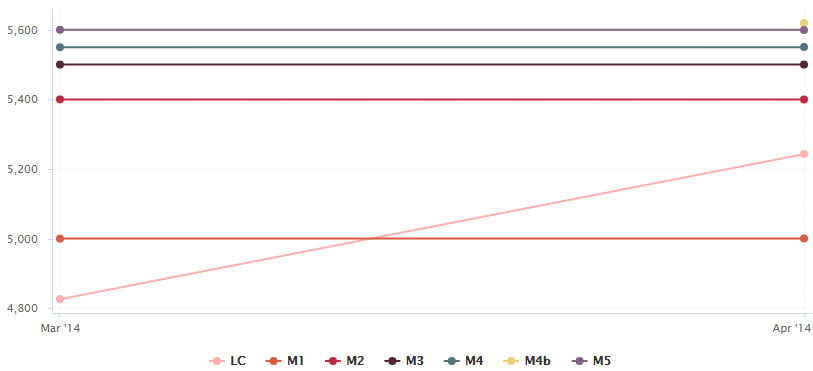
Temporal Evolution displaying the evolution of goals for each milestone of the project
<chart type="TE" id="GOAL_HISTORY_EXAMPLE" byTime="true">
<goalHistory>LC</goalHistory>
<measure color="PINK">LC</measure>
</chart>
The chart in the example above follows the LC metric and also displays the goals for the metric for each milestone in the project. By the second analysis, you can see that the goals for M4 and M5 have been revised, and that a new milestone called M4b has been introduced.
An optional milestone
attribute allows displaying information about one milestone instead of all milestones, as shown below:
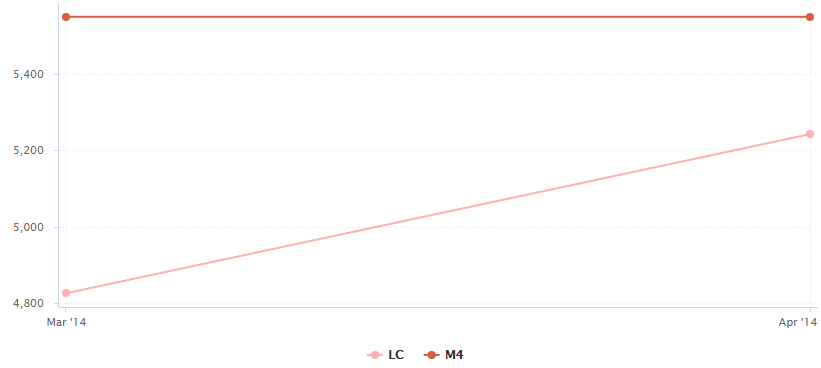
Temporal Evolution displaying the evolution of the goal the M4 milestone
<chart type="TE" id="GOAL_HISTORY_SINGLE_EXAMPLE" byTime="true">
<goalHistory milestone="M4">LC</goalHistory>
<measure color="PINK">LC</measure>
</chart>
You can use keywords instead of using a milestone ID. You can retrieve information about the next, previous, first or last milestones in the project by using:
NEXT
NEXT+STEP
where STEP is a number indicating how many milestones to jump ahead
PREVIOUS
PREVIOUS-STEP
where STEP is a number indicating how many milestones to jump backward
FIRST
LAST
You can use the milestoneHistory
element in a chart if you want to track the date changes made
to your milestones.
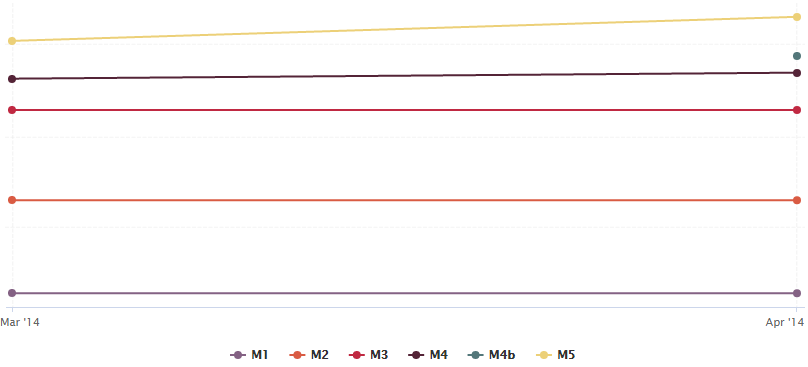
Temporal Evolution displaying changes in milestone dates for the project
<chart type="TE" id="MILESTONES_HISTORY_EXAMPLE" byTime="true">
<dataset renderer="LINE" rangeAxisId="HIDDEN">
	<milestoneHistory />
</dataset>
<rangeAxis id="HIDDEN" visible="false" />
</chart>
The chart in the example above shows the addition of a new M4b milestone and date changes for milestones M4 and M5 in the project, by the time of the second analysis.
An optional milestone
attribute allows displaying information about one milestone instead of all milestones, as shown below:
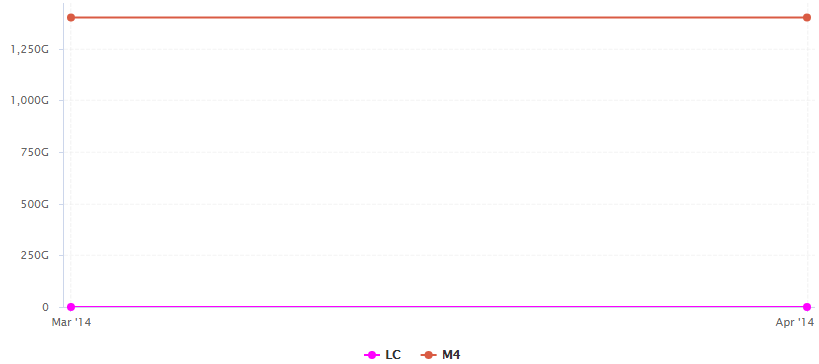
Temporal Evolution displaying the date slip for the M4 milestone
<chart type="TE" id="MILESTONES_HISTORY_SINGLE_EXAMPLE" byTime="true">
<milestoneHistory milestone="M4" />
<measure color="MAGENTA">LC</measure>
</chart>
You can use keywords instead of using a milestone ID. You can retrieve information about the next, previous, first or last milestones in the project by using:
NEXT
NEXT+STEP
where STEP is a number indicating how many milestones to jump ahead
PREVIOUS
PREVIOUS-STEP
where STEP is a number indicating how many milestones to jump backward
FIRST
LAST
You can use markers based on your milestones in your charts. The type of information you can display is:
Horizontal markers based on the value of the current goal for a specific metric
with
fromMilestonesGoal
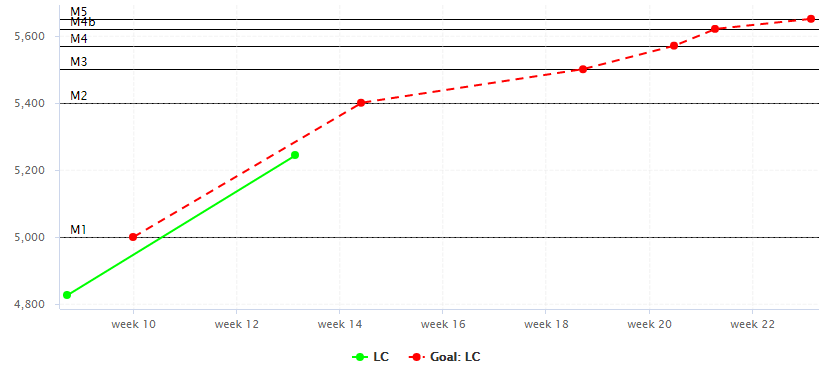
Temporal Evolution displaying markers for the goals for the metric LC for each milestone
<chart type="TE" id="MILESTONES_MARKERS_EXAMPLE" byTime="true">
<goal color="RED" stroke="DOTTED">LC</goal>
<measure color="GREEN">LC</measure>
<markers>
	<marker fromMilestonesGoal="LC" alpha="150" isVertical="false" />
</markers>
</chart>
Vertical markers based on the dates of milestones in the project
with
fromMilestones
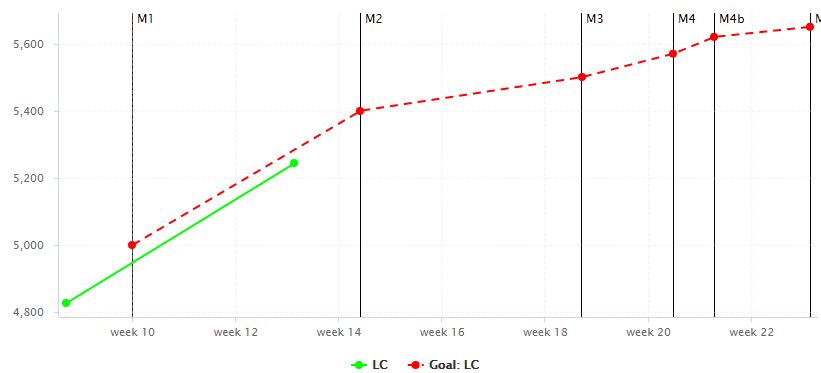
Temporal Evolution displaying markers for the dates of all milestones in the project
<chart type="TE" id="MILESTONES_MARKERS_VERTICAL_EXAMPLE" byTime="true">
<goal color="RED" stroke="DOTTED">LC</goal>
<measure color="GREEN">LC</measure>
<markers>
	<marker fromMilestones="true" alpha="150" isVertical="true" />
</markers>
</chart>
For more information about markers, consult the section called “Using Markers”. Note that in both cases, the marker labels are automatically set to the milestone names.
The Artefact Pie offers a graphical representation of the values of a specific measure for each child artefact in a pie chart. The Artefact Pie requires one measure
to define the size of the pie slice and accepts a colorFromIndicator
attribute to pick the colors of the pie slices based on a scale. Clicking a pie slice takes you to the dashboard of the corresponding artefact.

Artefact Pie
<chart type="ARTEFACTPIE" id="ARTEFACT_PIE_EXAMPLE" colorFromIndicator="ROOT" onlyDirectChildren="false" targetArtefactTypes="FILE">
	<measure>LC</measure>
</chart>
The chart
tag accepts the following attributes:
targetArtefactTypes
allows to filter descendants according to their type.
You can use one or more types. Concrete and abstract types are supported, so it is possible to use an alias,
as described in the section called “Artefact Types”.
For Stacked Bar Chart, Simple Temporal Evolution Stacked Bar Chart, Simple Pie, Simple Bar and Distribution Table, the measure and scale associated to the indicator must be the same for all types
onlyDirectChildren
(optional, default: true) includes artefacts that are direct children of the current artefact
when set to true, or all descendants of the current artefact when set to false.
colorFromIndicator
(optional, default: none) uses the specified indicator's colour scale to assign a colour to each item drawn on the chart.
The Artefact Series chart displays one or more metrics from descendent artefacts. The measure representation is defined by a renderer
attribute (as explained in the section called “Datasets and Renderers” ). The chart also allows clicking on an artefact to display its dashboard.

Artefact Series showing test statistics for child requirements
<chart type="ARTEFACTSERIES" id="ARTEFACT_SERIES_EXAMPLE" targetArtefactTypes="FILE;REQUIREMENT" onlyDirectChildren="false" inverted="true" orderByMeasure="NUM_FAILING_TESTS" renderer="BAR" orientation="HORIZONTAL">
	<measure color="CYAN">NUM_TESTS_CODE</measure>
	<measure color="GREEN">NUM_PASSING_TESTS</measure>
	<measure color="RED">NUM_FAILING_TESTS</measure>
</chart>
The Artefact Series can also be used to draw a stacked bar chart for child artefacts and include a line via the use of several datasets, as shown below:
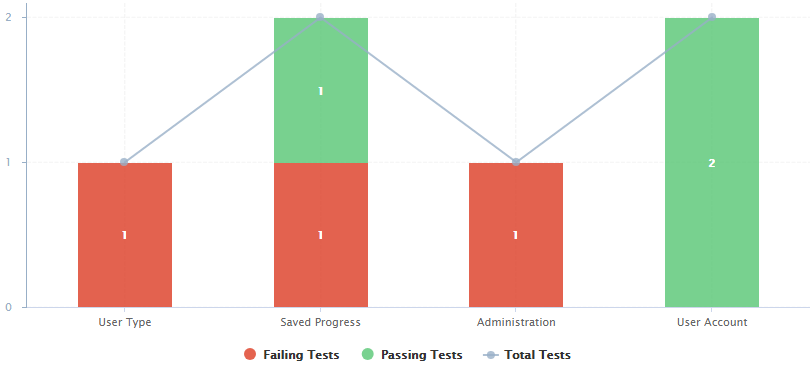
An alternate representation of the same data in an Artefact Series chart
<chart type="ARTEFACTSERIES" id="ARTEFACT_SERIES_STACKED_BAR_EXAMPLE" targetArtefactTypes="FILE;REQUIREMENT" onlyDirectChildren="false" inverted="true" orderByMeasure="NUM_FAILING_TESTS" orientation="VERTICAL">
	<dataset renderer="STACKED_BAR">
		<measure color="RED" >NUM_FAILING_TESTS</measure>
		<measure color="GREEN" >NUM_PASSING_TESTS</measure>
	</dataset>
		<dataset renderer="LINE" rangeAxis="TOTAL">
		<measure color="CYAN">NUM_TESTS_CODE</measure>
	</dataset>
	<rangeAxis id="TOTAL" color="CYAN" min="0" location="left" type="number" numberFormat="INTEGER" />
</chart>
The chart
element suports the following attributes:
targetArtefactTypes
allows to filter descendants according to their type.
You can use one or more types. Concrete and abstract types are supported, so it is possible to use an alias,
as described in the section called “Artefact Types”.
For Stacked Bar Chart, Simple Temporal Evolution Stacked Bar Chart, Simple Pie, Simple Bar and Distribution Table, the measure and scale associated to the indicator must be the same for all types
linkType
(alternative to targetArtefactTypes
) allows specifying a link ID to display
all artefacts linked to the current artefact on the chart. For more information about links, refer to the section called “Artefact Links”.
onlyDirectChildren
(optional, default: true) includes artefacts that are direct children of the current artefact
when set to true, or all descendants of the current artefact when set to false.
asPercentage
(optional, default: false) specifies whether the values are displayed as real values or percentages
displayEmptyData
(optional, default: false) forces the display of artefacts for which there is no corresponding data.
renderer (optional, default: BAR)
allows setting a common renderer for all measures in te chart. This can be omitted and overridden for individual datasets, as explained in the section called “Datasets and Renderers”.
orderByMeasure (optional, default: the first measure in the chart definition)
allows ordering the artefacts on the chart according to the specified measure.
inverted (optional, default: false)
allows reversing the default order of artefacts
You can specify as many measure
sub-elements as necessary for each artefact, using the syntax detailed in the section called “Common Attributes for measure and indicator
”.
The Artefact Table allows displaying a list of child artefacts and one or more of their characteristics in table format, as shown below:
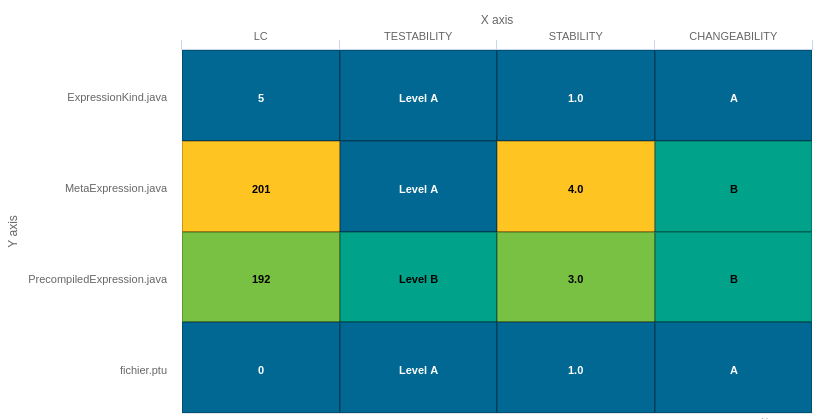
Artefact Table
<chart	type="ARTEFACTTABLE" id="ARTEFACT_TABLE_EXAMPLE" xLabel="X axis"yLabel="Y axis" onlyDirectChildren="true" targetArtefactTypes="FILE">
	<indicator>LC</indicator>
	<indicator displayValueType="NAME">TESTABILITY</indicator>
	<indicator displayValueType="RANK">STABILITY</indicator>
	<indicator displayValueType="MNEMONIC">CHANGEABILITY</indicator>
</chart>
In the example above, the indicators use different displayValueType
to show all the supported values.
The Artefact Table chart
element may have the following attributes:
targetArtefactTypes
allows to filter descendants according to their type. You can use one or more types.
Concrete and abstract types are supported, so it is possible to use an alias, as described in the section called “Artefact Types”.
onlyDirectChildren
(optional, default: false) includes artefacts that are direct children of the current artefact
when set to true, or all descendants of the current artefact when set to false.
orderByMeasure
(optional, alphabetical if omitted) allows sorting the list of artefacts according to the value of the specified measure ID.
inverted
(optional, default: false) allows reversing the sort order defined by the orderByMeasure
attribute.
displayEmptyData
(optional, default: false) forces the display of artefacts for which there is no corresponding data.
The Artefact Table chart takes one or more indicator
sub-elements, which can point to measures or indicators. Note that the table cells are automatically coloured according to the corresponding scale level colour when the metric displayed in the table is an indicator. This behaviour can be overridden by using the colorFromScale
attribute, which takes a scale ID to apply colour from according to the rank of the value displayed.
In addition, you can add a row and column to aggregate the results found in each table row or column using the row
or column
element. Each of these elements accepts the following attributes:
aggregationType
(optional, default: AVG in most charts, SUM in table charts) defines how the values for the
metrics on the chart are aggregated. The supported values are:
MIN
MAX
OCC
AVG
DEV
SUM
MED
MOD
label
(mandatory)
is a string that is displayed as the legend of the row or column.
color
(optional, default: GREY)
is the fill colour for the row or column. [colour syntax]
colorFromScale
(optional, default: empty)
allows filling cells with a colour taken from a specific scale.
The Artefact Time Series chart displays one or more metrics from descendent artefacts on a timeline. It offers the same features as the Artefact Series chart and also provides options to aggregate by time period.
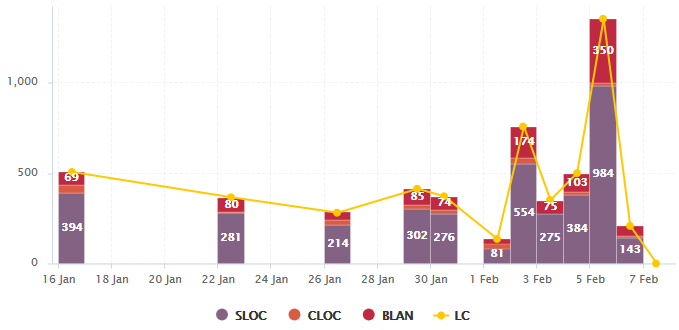
Artefact Time Series showing a daily timeline of files
<chart type="ArtefactTimeSeries" id="ARTEFACTTIMESERIES_EXAMPLE" targetArtefactTypes="FILE" onlyDirectChildren="false" timeMeasure="DATE_FILE" timeInterval="DAY" timeIntervalAggregationType="SUM" byTime="true" renderer="STACKED_BAR">
	<dataset renderer="STACKED_BAR">
		<measure>SLOC</measure>
		<measure>CLOC</measure>
		<measure>BLAN</measure>
	</dataset>

	<dataset renderer="LINE">
		<measure color="ORANGE">LC</measure>
	</dataset>
</chart>
In the example above, files are sorted by creation date on a daily timeline, with bars representing daily aggregates of serveral line count metrics for each files.
The chart
element suports the following attributes:
targetArtefactTypes
allows to filter descendants according to their type.
You can use one or more types. Concrete and abstract types are supported, so it is possible to use an alias,
as described in the section called “Artefact Types”.
For Stacked Bar Chart, Simple Temporal Evolution Stacked Bar Chart, Simple Pie, Simple Bar and Distribution Table, the measure and scale associated to the indicator must be the same for all types
onlyDirectChildren
(optional, default: true) includes artefacts that are direct children of the current artefact
when set to true, or all descendants of the current artefact when set to false.
timeMeasure
(mandatory) is the measure ID (of type DATE) used to place an artefact on the timeline
byTime
(optional, default: false) enforces the timeline display
For interval and aggregation settings, refer to the section called “Parameters for Temporal Charts”.
You can specify as many measure
sub-elements as necessary for each artefact, using the syntax detailed in the section called “Common Attributes for measure and indicator
”.
The Cell Artefact Table offers a tabular representation of descendent artefacts of a certain type with added grouping and filtering possibilities compared to other table charts.
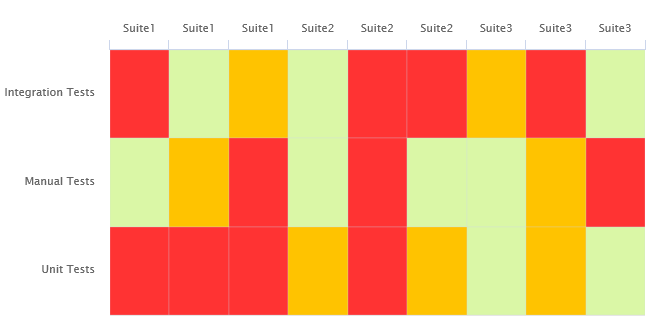
Cell Artefact Table
<chart	type="CellArtefactTable" id="CELLARTEFACTTABLE_EXAMPLE" targetArtefactTypes="SUITE" colorFromIndicator="ROOT" orderByMeasure="RUN_DATE" enabledAxisLabels="true" insideAxisLabels="false" artefactNameAsColumn="true">
	<groups>
		<group type="LINE" ancestorLevel="2" orderBy="NAME" />
	</groups>
</chart>
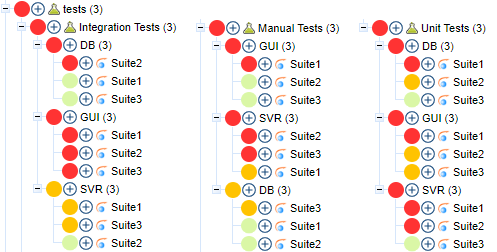
The test tree represented in the example chart shows each test suite as a cell, grouped on the same line by ancestor level -2 (the type of testing activity).
The chart
tag accepts the following attributes:
targetArtefactTypes
allows to filter descendants according to their type.
You can use one or more types. Concrete and abstract types are supported, so it is possible to use an alias,
as described in the section called “Artefact Types”.
For Stacked Bar Chart, Simple Temporal Evolution Stacked Bar Chart, Simple Pie, Simple Bar and Distribution Table, the measure and scale associated to the indicator must be the same for all types
colorFromIndicator
(optional, default: none) uses the specified indicator's colour scale to assign a colour to each item drawn on the chart.
orderByMeasure
(optional, alphabetical if omitted) allows sorting the list of artefacts according to the value of the specified measure ID.
enabledAxisLabels
(optional, default: true) allows showing (true) or hiding (false) axis labels
insideAxisLabels
(optional, default: false) allows printing the axis labels to the right of the y-axis (true) instead of to the left (false)
artefactNameAsColumn
(optional, default: false) allows printing the artefact names inside the cells (false) or at the top of each column (true)
Grouping can be achieved via a group
element defining an ancestorLevel
:
<groups>
	<group type="COLUMNS" ancestorLevel="1" />
	<group type="LINE" ancestorLevel="2" orderBy="NAME" />
	<group type="LINES" ancestorLevel="1" orderBy="NAME" />
</groups>
You can also filter which artefacts are to be displayed as cells checking a condition on their ancestors.
Include tests suites in the chart only if they are under a critical tested component:
<ancestors>
	<where artefactTypes="TEST_COMPONENT" measureId="IS_CRITICAL" value="1" />
</ancestors>
Include test suites in the chart only if they are linked to a library of ASIL level 2 or more
<ancestors>
	<where artefactTypes="LIBRARY" measureId="ASIL_LEVEL" bounds="[2;[" />
</ancestors>
The Dial chart represents the value of the measure associated to an indicator against a backdrop of the scale associated to this indicator. The Dial chart requires one indicator
as a sub-element.
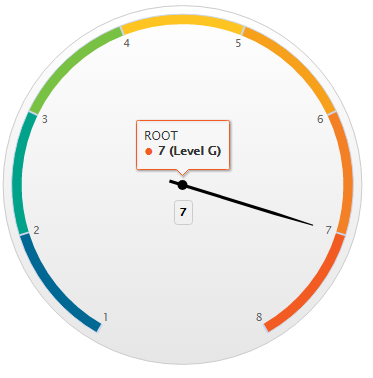
Dial Chart
<chart type="DIAL" id="DIAL_EXAMPLE">
	<indicator>ROOT</indicator>
</chart>
The Dial chart
element may have the following attributes:
The majorTickIncrement
and minorTickCount
parameters only need to be used if you want to completely control the appearance of the chart. Generally, they can be omitted, as the defaults should be smart enough to show what you need.
You can control the bounds of the axis of this chart using the datBounds attributs on each metric,
as explained in the section called “Common Attributes for measure and indicator
”.
The indicator
element supports excluding
certain levels from the chart by using the
excludeLevels
attribute. For
example:
<indicator excludeLevels="LEVELA;LEVELB">LEVEL</indicator>
The Distribution Table is an matrix-like visualisation of two characteristics of an artefact's descendants
Distribution Table
<chart type="DISTRIBUTIONTABLE" id="DIST_TABLE_FIXED_COLOR_EXAMPLE" targetArtefactTypes="FILE" xLabel="Testability" yLabel="Number of Artefacts" topColor="ORANGE" bottomColor="BLUE">
	<indicator>ROOT</indicator>
	<indicator>TESTABILITY</indicator>
	<row aggregationType="SUM" label="Total Col" color="GRAY" />
	<column aggregationType="SUM" label="Total Line" color="GRAY" />
</chart>
The Distribution Table chart
element may have the following attributes:
targetArtefactTypes
allows to filter descendants according to their type. You can use one or more types.
Concrete and abstract types are supported, so it is possible to use an alias, as described in the section called “Artefact Types”.
color
(optional, default: WHITE) is the colour used to fill all the cells in the table. An example Distribution Table using color
is shown later in this section. [colour syntax] .
Instead of using a single colour for the entire table, you can use
topColor
, middleColor
and bottomColor
to colour the top, middle and
bottom sections of the chart respectively in different colours, as in the main example above. [colour syntax]
colorFromScale
(optional, default: none) is the colour scale used to fill the cells in the table according to the rank of each cell. An example Distribution Table using colorFromScale
is shown later in this section.
If several colour attributes are found, they are applied in this order:
The Distribution Table chart takes two indicator
sub-element that will be used to build a matrix of scale levels.
In addition, you can add a row and column to aggregate the results found in each table row or column using the row
or column
element. Each of these elements accepts the following attributes:
aggregationType
(optional, default: AVG in most charts, SUM in table charts) defines how the values for the
metrics on the chart are aggregated. The supported values are:
MIN
MAX
OCC
AVG
DEV
SUM
MED
MOD
label
(mandatory)
is a string that is displayed as the legend of the row or column.
color
(optional, default: GREY)
is the fill colour for the row or column. [colour syntax]
colorFromScale
(optional, default: empty)
allows filling cells with a colour taken from a specific scale.
Some simpler examples of Distribution Table charts can be found below:
Simple Distribution Table
<chart type="DISTRIBUTIONTABLE" id="DIST_TABLE_EXAMPLE" targetArtefactTypes="FILE" xLabel="Testability" yLabel="Number of Artefacts">
	<indicator>ROOT</indicator>
	<indicator>ANALYSABILITY</indicator>
</chart>
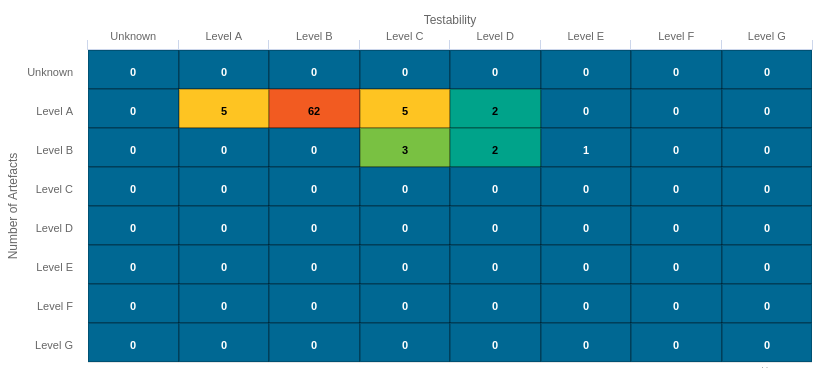
Distribution Table with cells coloured according to a scale
Chart:
<chart type="DISTRIBUTIONTABLE" id="DIST_TABLE_SCALE_COLOR_EXAMPLE" targetArtefactTypes="FILE" xLabel="Testability" yLabel="Number of Artefacts" colorFromScale="SCALE_TEST_BASIC">
	<indicator>ROOT</indicator>
	<indicator>TESTABILITY</indicator>
</chart>


Scale:
<Scale scaleId="SCALE_TEST_BASIC">
	<ScaleLevel levelId="LEVELA" bounds="];1]" rank="1" />
	<ScaleLevel levelId="LEVELB" bounds="]1;2]" rank="2" />
	<ScaleLevel levelId="LEVELC" bounds="]2;4]" rank="3" />
	<ScaleLevel levelId="LEVELD" bounds="]4;8]" rank="4" />
	<ScaleLevel levelId="LEVELE" bounds="]8;16]" rank="5" />
	<ScaleLevel levelId="LEVELF" bounds="]16;32]" rank="6" />
	<ScaleLevel levelId="LEVELG" bounds="]32;[" rank="7" />
</Scale>
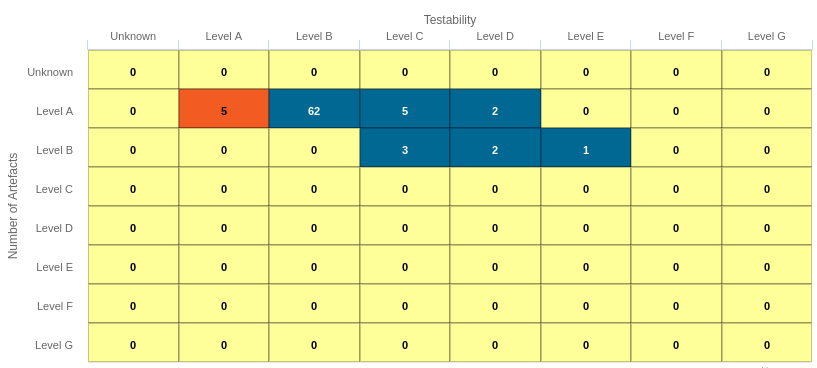
Simple Distribution Table with red/green
Chart:
<chart type="DISTRIBUTIONTABLE" id="DIST_TABLE_SCALE_COLOR_TWO_COLORS_EXAMPLE" targetArtefactTypes="FILE" xLabel="Testability" yLabel="Number of Artefacts" topColorFromScale="SCALE_GREEN" middleColorFromScale="SCALE_RED" bottomColorFromScale="SCALE_RED">
	<indicator>ROOT</indicator>
	<indicator>TESTABILITY</indicator>
</chart>


Scales:

<Scale scaleId="SCALE_GREEN">
	<ScaleLevel levelId="BLANK" bounds="];1[" rank="-1" />
	<ScaleLevel levelId="LEVELA" bounds="[1;[" rank="1" />
</Scale>

<Scale scaleId="SCALE_RED">
	<ScaleLevel levelId="BLANK" bounds="];1[" rank="-1" />
	<ScaleLevel levelId="LEVELG" bounds="[1;[" rank="1" />
</Scale>
A typical Histogram that shows the repartition of a value for the children of the selected artefact It requires one measure
element.
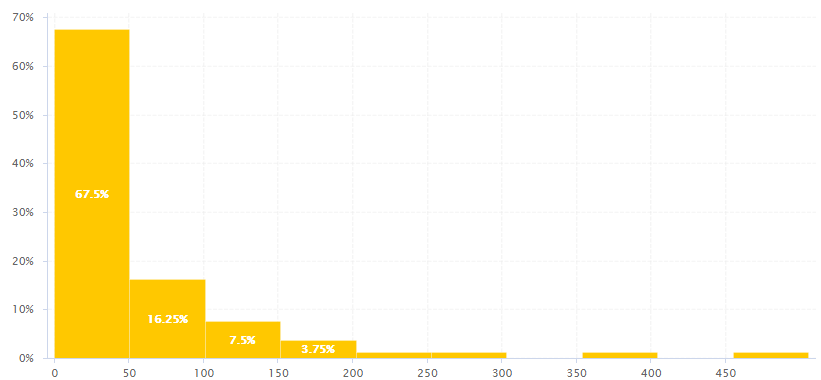
Histogram
<chart type="HISTOGRAM" id="HISTOGRAM_EXAMPLE" targetArtefactTypes="FILE" nbBars="10">
	<measure color="ORANGE">LC</measure>
</chart>
The chart
element may have the following attributes:
targetArtefactTypes
allows to filter descendants according to their type.
You can use one or more types. Concrete and abstract types are supported, so it is possible to use an alias,
as described in the section called “Artefact Types”.
For Stacked Bar Chart, Simple Temporal Evolution Stacked Bar Chart, Simple Pie, Simple Bar and Distribution Table, the measure and scale associated to the indicator must be the same for all types
You can control the bounds of the axis of this chart using the datBounds attributs on each metric,
as explained in the section called “Common Attributes for measure and indicator
”.
The Key Performance Indicator chart is used to display the rating of the root indicator for artefact.
Key Performance Indicator
<chart type="KPI" id="KPI_EXAMPLE" indicatorId="ROOT" />
The chart
accepts the following attributes:
indicatorId
is the reference to an Indicator. See the section called “Descriptions” for more information about the indicatorId
.
You can configure the image displayed by Key Performance Indicator chart by defining an image per scale level in your model:
<SQUORE_HOME>/configuration/models/shared/Analysis/SQuORE_PerformanceLevels_en.properties:
LOP.LEVELA.IMAGE=../Shared/Images/images/perfA.png
LOP.LEVELB.IMAGE=../Shared/Images/images/perfB.png
LOP.LEVELC.IMAGE=../Shared/Images/images/perfC.png
LOP.LEVELD.IMAGE=../Shared/Images/images/perfD.png
LOP.LEVELE.IMAGE=../Shared/Images/images/perfE.png
LOP.LEVELF.IMAGE=../Shared/Images/images/perfF.png
LOP.LEVELG.IMAGE=../Shared/Images/images/perfG.png
For more information about properties files, consult the section called “Descriptions”.
The Indicator now offers a more dynamic way to display a KPI without the need to create images for every level on a scale. You can find out more about this chart in Indicator.
The Kiviat chart displays three or more indicators in a radar-type chart.
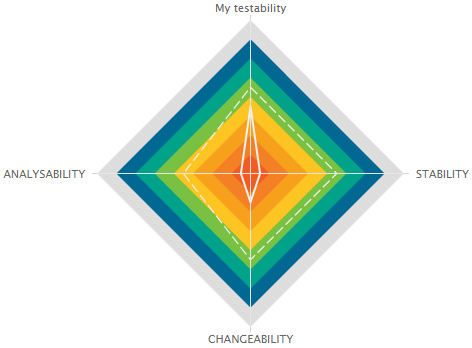
Kiviat
The Kiviat chart takes a set of at least three indicators as sub-elements.
<chart type="KIVIAT" id="KIVIAT_EXAMPLE" isInverted="true">
	<indicator label="My testability" objective="LEVELC">TESTABILITY</indicator>
	<indicator objective="LEVELC">STABILITY</indicator>
	<indicator objective="LEVELC">CHANGEABILITY</indicator>
	<indicator objective="LEVELD">ANALYSABILITY</indicator>
</chart>
The attributes allowed for the chart
element are the following:
The indicator
element accepts a specific, optional objective
attribute that draws a dotted line at the specified level representing the objective line.
The objective attribute accepts:
A scale level (LEVELA)
An indicator ID (TESTABILITY). In this case, both indicators must use the same scale.
A computation (LC+100). The computed value is then used together with the scale of the indicator to define the level to display.
Note that only a scale level is accepted for Kiviat charts in Model/Group Dashboards.
The Indicator displays the rating of the current artefact for a specific indicator.

Indicator with tooltips showing information about the scale for the indicator (left) and the actual rating of the artefact (right)
<chart type="INDICATOR" id="INDICATOR_EXAMPLE" topText="More efficient" bottomText="Less efficient">
	<indicator excludeLevels="UNKNOWN">ROOT</indicator>
</chart>
The chart
takes exactly one indicator
element and
accepts the following attributes:
The colours and level names displayed on the by Indicator are taken from the configuration of the scale levels for your indicator in your model:
<SQUORE_HOME>/configuration/models/shared/Analysis/SQuORE_PerformanceLevels_en.properties:
LOP.LEVELA.MNEMO=A
LOP.LEVELA.NAME=Level A
LOP.LEVELA.COLOR=#006893

LOP.LEVELB.MNEMO=B
LOP.LEVELB.NAME=Level B
LOP.LEVELB.COLOR=#00a38a
...
For more information about properties files, consult the section called “Descriptions”.
The Optimised Bar chart is a bar chart that takes several measure as input. It simply displays a bar chart with the values previously computed.
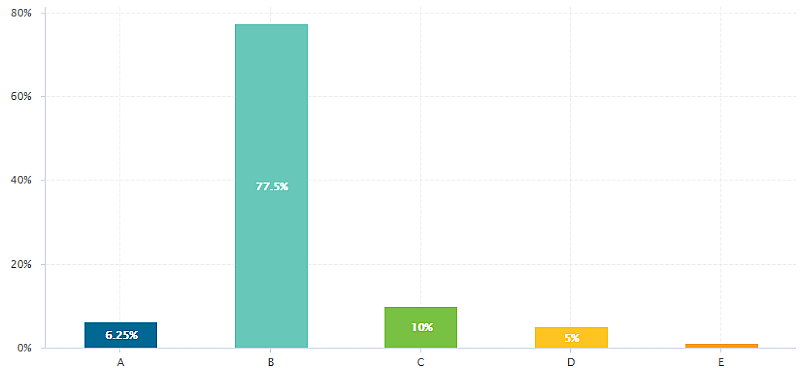
Optimised Bar
<chart type="OPTIMIZEDBAR" id="OPTIMIZED_BAR_EXAMPLE" asPercentage="true">
	<measure color="#006893" label="A">A_FILE</measure>
	<measure color="#67C8B9" label="B">B_FILE</measure>
	<measure color="#79C142" label="C">C_FILE</measure>
	<measure color="#FEC422" label="D">D_FILE</measure>
	<measure color="#F6A01B" label="E">E_FILE</measure>
	<measure color="#F48026" label="F">F_FILE</measure>
	<measure color="#F25B21" label="G">G_FILE</measure>
</chart>
The Optimised Bar requires a minimum of two measure
elements and supports the following attributes:
decimals
(optional, default: 0) is the number of decimals places to be used for displaying values
displayEmptyValue
(optional, default: false) -- Deprecated, should be replaced with displayEmptyData
specifies whether categories with no value or a value of 0 are included on the chart
asPercentage
(optional, default: false) specifies whether the values are displayed as real values or percentages
displayGlobalPercentage
(optional, default: false) (new in 18.0) allows showing the global percentage value for each bar in the tooltip next to the relative percentage value..
The Optimised Pie chart is a pie chart that takes several measure as input. It simply displays a pie chart with the values previously computed.

Optimised Pie Chart
<chart type="OPTIMIZEDPIE" id="OPTIMIZED_PIE_EXAMPLE" decimals="2">
	<measure label="Source">SLOC_ONLY</measure>
	<measure label="Comment">CLOC_ONLY</measure>
	<measure label="Mixed">MLOC</measure>
	<measure color="YELLOW" label="Blank">BLAN</measure>
</chart>
The Optimised Pie requires a minimum of two measure
elements and
supports the following attributes:
The Pivot Table (new in 18.0) displays, combines and summarises information from several metrics, grouping them by indicator level. The Pivot Table displays a column per included metric and a column showing the total count of artefacts for each line.
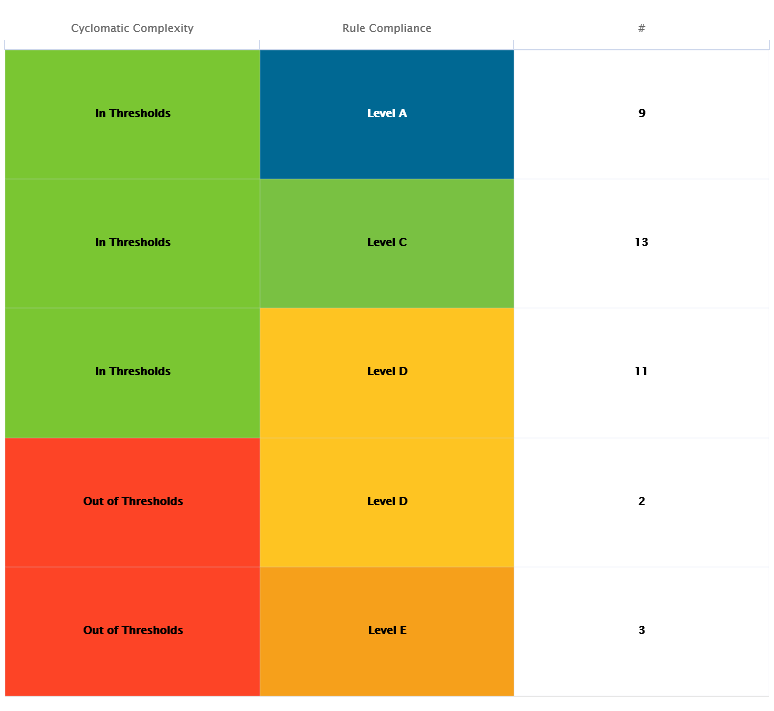
A Pivot Table crossing results of the rule compliance and cyclomatic complexity indicators for all functions in a project
<chart id="PIVOT_TABLE_EXAMPLE" type="PIVOTTABLE" targetArtefactTypes="FUNCTION">
  <indicator>VG</indicator>
  <indicator>RULE_ADH</indicator>
</chart>
The chart
takes one or more indicator
, measure
or info
elements and
accepts the following attributes:
colorFromScale
(optional, default: empty, uses the scale from the first column of the chart) allows filling cells with a colour taken from a specific scale.
orderByCount
(optional, default: false) allows ordering the table according to the count column when set to true instead of using the scale of the first column of the chart.
countBounds
(optional, default: none) allows setting data bounds for the count column. If the value is outside the defined interval, then the line is excluded from the Pivot Table.
inverted
(optional, default: false) allows reversing the sort order of lines in the chart.
displayEmptyData
(optional, default: false) forces the display of artefacts for which there is no corresponding data.
The Quadrant chart displays information about the descendants of the current artefact. Three measures are required to construct the chart: one for the X-axis, one for the Y-axis one for the size of the bubbles. The chart also allows to set markers to define coloured areas.

Quadrant Chart
<chart type="QUADRANT" id="QUADRANT_EXAMPLE" targetArtefactTypes="FILE">
	<xmeasure>CLOC</xmeasure>
	<ymeasure>SLOC</ymeasure>
	<zmeasure>LC</zmeasure>
	<markers>
		<marker value="15" color="BLACK" alpha="50" isVertical="true" />
		<marker value="200" color="BLACK" alpha="50" isVertical="false" />
	</markers>
</chart>
The chart
element may have the following attributes:
targetArtefactTypes
allows to filter descendants according to their type.
You can use one or more types. Concrete and abstract types are supported, so it is possible to use an alias,
as described in the section called “Artefact Types”.
For Stacked Bar Chart, Simple Temporal Evolution Stacked Bar Chart, Simple Pie, Simple Bar and Distribution Table, the measure and scale associated to the indicator must be the same for all types
linkType
(alternative to targetArtefactTypes
) allows specifying a link ID to display
all artefacts linked to the current artefact on the chart. For more information about links, refer to the section called “Artefact Links”.
onlyDirectChildren
(optional, default: false) includes artefacts that are direct children of the current artefact
when set to true, or all descendants of the current artefact when set to false.
colorFromIndicator
(optional, default: none) uses the specified indicator's colour scale to assign a colour to each item drawn on the chart.
The Artefact Scrumboard offers a graphical representation of child artefacts organised into categories (levels on a scale). Each artefact is represented as a sticky note and is clickable so you can reach the artefact's dashboard directly from the scrumboard.

Artefact Scrumboard
<chart type="ARTEFACTSCRUMBOARD" id="ARTEFACT_SCRUMBOARD_EXAMPLE" targetArtefactTypes="FILE" postitByColumn="2" displayEmptyData="true" orderByMeasure="SLOC" invertedLevels="true">
	<indicator excludeLevels="UNKNOWN;LEVELG">ROOT</indicator>
</chart>
The chart
tag accepts the following attributes:
targetArtefactTypes
allows to filter descendants according to their type.
You can use one or more types. Concrete and abstract types are supported, so it is possible to use an alias,
as described in the section called “Artefact Types”.
For Stacked Bar Chart, Simple Temporal Evolution Stacked Bar Chart, Simple Pie, Simple Bar and Distribution Table, the measure and scale associated to the indicator must be the same for all types
onlyDirectChildren
(optional, default: false) includes artefacts that are direct children of the current artefact
when set to true, or all descendants of the current artefact when set to false.
colorFromIndicator
(optional, default: none) uses the specified indicator's colour scale to assign a colour to each item drawn on the chart.
invertedLevels
(optional, default: false) reverses the order of the scale levels on the board when set to true.
postitByColumn
(optional, default: 3) specifies the minimum number of sticky notes to display per line in each category.
maxPostitWidth
(optional, default: dynamic) specifies the maximum width to draw sticky notes. This setting may override the value of postitByColumn in some cases.
displayEmptyData
(optional, default: false) forces the display of all levels in the scale when set to true, even if there are no artefacts for that level.
orderByMeasure
(optional) allows ordering sticky notes in a category according to a specific measure.
inverted
(optional, default: false) reverses the order of sticky notes in each category when set to true (still using the measure defined by orderByMeasure
).
The Artefact Scrumboard requires exactly one indicator
elements to use its scale levels as scrumboard categories.
The Simple Bar chart presents the aggregation of the different ratings found in all the children of the selected artefact as a histogram.

Simple Bar
<chart type="SIMPLEBAR" id="SIMPLE_BAR_EXAMPLE" targetArtefactTypes="FILE">
	<indicator>LEVEL</indicator>
</chart>
The Simple Bar chart
element may have the following attributes:
targetArtefactTypes
allows to filter descendants according to their type.
You can use one or more types. Concrete and abstract types are supported, so it is possible to use an alias,
as described in the section called “Artefact Types”.
For Stacked Bar Chart, Simple Temporal Evolution Stacked Bar Chart, Simple Pie, Simple Bar and Distribution Table, the measure and scale associated to the indicator must be the same for all types
decimals
(optional, default: 0) is the number of decimals places to be used for displaying values
displayEmptyValue
(optional, default: false) -- Deprecated, should be replaced with displayEmptyData
specifies whether categories with no value or a value of 0 are included on the chart
asPercentage
(optional, default: false) specifies whether the values are displayed as real values or percentages
The Simple Bar chart takes only one indicator
or info
as a sub-element.
For more details about how to use textual information, refer to the section called “Common Attributes for info
”
The indicator
element supports hiding or excluding
certain levels from the chart by using the hideLevels
excludeLevels
attribute. The difference between
hiding and excluding a level is that hidden levels are taken into account when displaying percentages while
excluded levels are not. For example:
<indicator excludeLevels="UNKNOWN">LEVEL</indicator>
or
<indicator hideLevels="LEVELA;LEVELB">LEVEL</indicator>
The Simple Pie chart presents the aggregation of the different ratings found in all the children of the selected artefact.
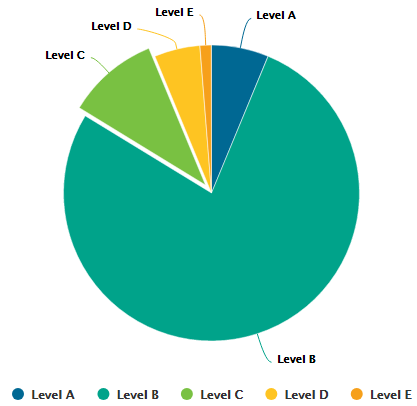
Simple Pie
<chart type="SIMPLEPIE" id="SIMPLE_PIE_EXAMPLE" targetArtefactTypes="FILE">
	<indicator>ROOT</indicator>
</chart>
The Simple Pie chart
element may have the following attributes:
targetArtefactTypes
allows to filter descendants according to their type.
You can use one or more types. Concrete and abstract types are supported, so it is possible to use an alias,
as described in the section called “Artefact Types”.
For Stacked Bar Chart, Simple Temporal Evolution Stacked Bar Chart, Simple Pie, Simple Bar and Distribution Table, the measure and scale associated to the indicator must be the same for all types
displayEmptyValue
(optional, default: false) -- Deprecated, should be replaced with displayEmptyData
specifies whether categories with no value or a value of 0 are included on the chart
decimals
(optional, default: 0) is the number of decimals places to be used for displaying values
The Simple Pie chart takes only one indicator
or info
as a sub-element.
For more details about how to use textual information, refer to the section called “Common Attributes for info
”.
The indicator
element supports excluding
certain levels from the chart by using the
excludeLevels
attribute. For
example:
<indicator excludeLevels="LEVELA;LEVELB">LEVEL</indicator>
Note: This chart is equivalent to using an Optimised Pie Chart with the definition shown below. The pie chart is optimised because the measures it uses have already been computed during the analysis and do not need to be calculated on the fly.
<chart type="OptimizedPie" decimals="2" >
	<measure color="0,81,0" label="A">A_FILE</measure>
	<measure color="3,127,3" label="B">B_FILE</measure>
	<measure color="133,182,2" label="C">C_FILE</measure>
	<measure color="255,255,0" label="D">D_FILE</measure>
	<measure color="255,150,0" label="E">E_FILE</measure>
	<measure color="255,80,0" label="F">F_FILE</measure>
	<measure color="255,0,0" label="G">G_FILE</measure>
</chart>
This chart represents the SQALE Pyramid, representing a minimum of two different measures or indicators as a matrix.
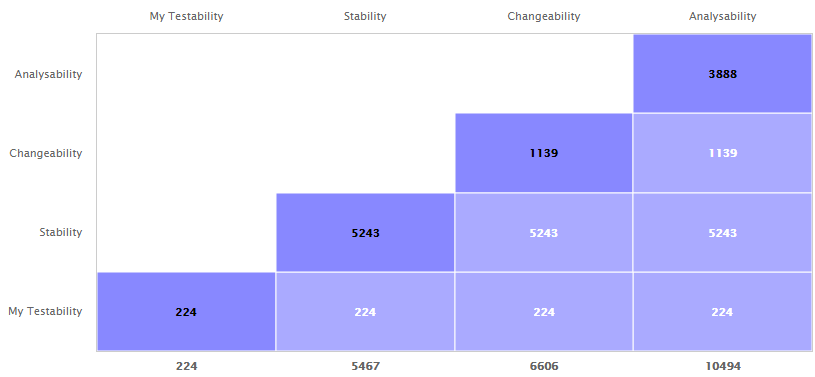
SQALE Pyramid
<chart type="SQALEPYRAMID" id="SQALEPYRAMID_EXAMPLE">
	<measure label="My Testability">CLOC</measure>
	<measure label="Stability">LC</measure>
	<measure label="Changeability">BLAN</measure>
	<measure label="Analysability">SLOC</measure>
</chart>
The Stacked Bar crosses the performance levels of two indicators, measures or textual infos (new in 18.0) for the children of the selected artefact along two axes.
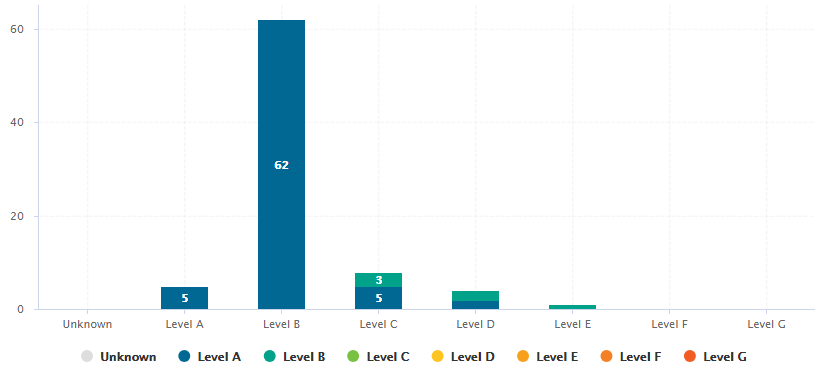
Stacked Bar Chart chart
<chart type="STACKEDBAR" id="STACKED_BAR_EXAMPLE" targetArtefactTypes="FILE"> <indicator>ROOT</indicator> <indicator>TESTABILITY</indicator> </chart>
The chart
element may have the following attributes:
targetArtefactTypes
allows to filter descendants according to their type.
You can use one or more types. Concrete and abstract types are supported, so it is possible to use an alias,
as described in the section called “Artefact Types”.
For Stacked Bar Chart, Simple Temporal Evolution Stacked Bar Chart, Simple Pie, Simple Bar and Distribution Table, the measure and scale associated to the indicator must be the same for all types
displayEmptyData
(optional, default: false) forces the display of artefacts for which there is no corresponding data.
inverted
(optional, default: false) (new in 18.0) reverses the order of the bars on the chart when set to true.
asPercentage
(default: false) displays the values as percentages when set to true.
The chart support two indicator
, measure
or info
(new in 18.0) elements.
The indicator
element supports hiding or excluding
certain levels from the chart by using the hideLevels
excludeLevels
attribute. The difference between
hiding and excluding a level is that hidden levels are taken into account when displaying percentages while
excluded levels are not. For example:
<indicator excludeLevels="UNKNOWN">LEVEL</indicator>
or
<indicator hideLevels="LEVELA;LEVELB">LEVEL</indicator>
The Text Values chart is used to display one or more metrics as a large clickable element in your dashboard. The chart also optionally displays the trend for the displayed metrics.
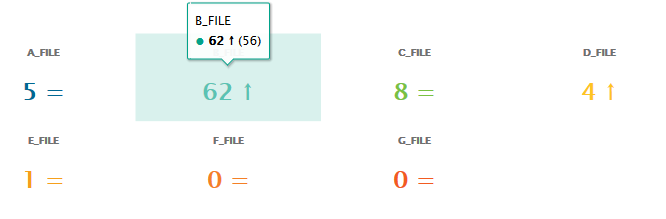
Text Values
<chart type="TEXTVALUES" id="TEXTVALUES_EXAMPLE" layout="4x3" displayEvolution="true"> <measure color="#006893">A_FILE</measure> <measure color="#00a38a">B_FILE</measure> <measure color="#79c142">C_FILE</measure> <measure color="#fec422">D_FILE</measure> <measure color="#f6a01b">E_FILE</measure> <measure color="#f48026">F_FILE</measure> <measure color="#f25b21">G_FILE</measure> </chart>
The chart
accepts the following attributes:
layout
(optional, default: 1x1) defines how to display the metrics on the chart in terms of rows and columns.
titleColor
(optional, default: #707070) is the color of the label for chart's title.
displayEvolution
(optional, default: false) allows displaying trends next to the metric's value on the chart.
The Treemap offers a graphical representation of child artefacts as a set of tiled rectangles. The Treemap requires one measure
to define the size of the tiles and accepts a colorFromIndicator
attribute to pick the colors of the tiles. Tiles are generated from largest to smallest, and from top left to bottom right. Clicking a tile takes you to the dashboard of the corresponding artefact.
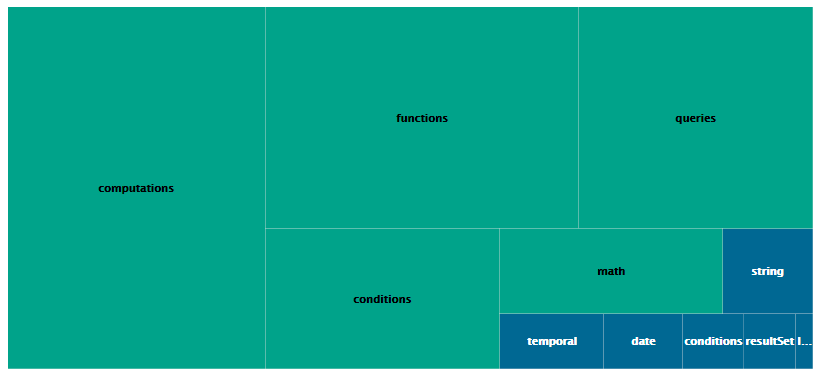
Treemap
<chart type="TREEMAP" id="TREEMAP_EXAMPLE" colorFromIndicator="ROOT" onlyDirectChildren="false" targetArtefactTypes="FOLDER"> <measure>LC</measure> </chart>
The chart
tag accepts the following attributes:
targetArtefactTypes
allows to filter descendants according to their type.
You can use one or more types. Concrete and abstract types are supported, so it is possible to use an alias,
as described in the section called “Artefact Types”.
For Stacked Bar Chart, Simple Temporal Evolution Stacked Bar Chart, Simple Pie, Simple Bar and Distribution Table, the measure and scale associated to the indicator must be the same for all types
linkType
(alternative to targetArtefactTypes
) allows specifying a link ID to display
all artefacts linked to the current artefact on the chart. For more information about links, refer to the section called “Artefact Links”.
onlyDirectChildren
(optional, default: true) includes artefacts that are direct children of the current artefact
when set to true, or all descendants of the current artefact when set to false.
colorFromIndicator
(optional, default: none) uses the specified indicator's colour scale to assign a colour to each item drawn on the chart.
defaultColor
(optional, default: RANDOM colour based on artefact name) uses an indicator's colour scale to assign a colour to each drawn tile. [colour syntax]
artefactsLimit
(optional, default: 2000) allows limiting the number of child artefacts to include.
maxDisplayableLabels
(optional, default: 250) allows you to limit the number of tiles that get a label on a treemap. This is only useful if you have large treemaps that cause performance issues.
The X/Y-Cloud chart is a visual representation of the values of two measures or indicators for the children of the selected artefact. For each child of the requested type, a dot is drawn with the value found for the selected measure.
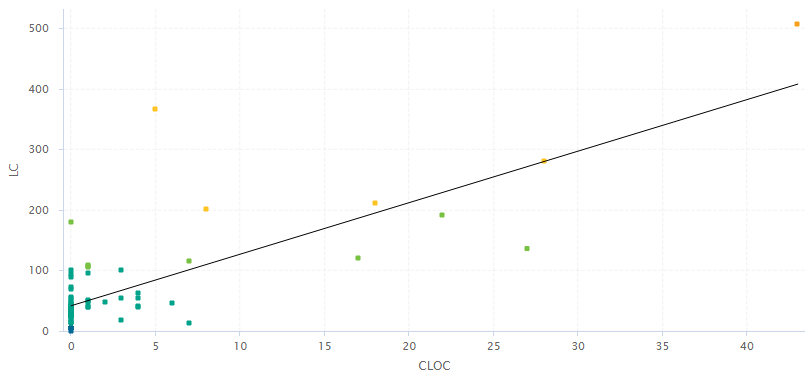
X/Y-Cloud Chart
<chart type="CORRELATEDCLOUD" id="CORRELATED_CLOUD_EXAMPLE" targetArtefactTypes="FILE" coeff="1" colorFromIndicator="LEVEL"> <xmeasure>TESTABILITY</xmeasure> <ymeasure>STABILITY</ymeasure> </chart>
The chart
element may have the following attributes:
targetArtefactTypes
allows to filter descendants according to their type.
You can use one or more types. Concrete and abstract types are supported, so it is possible to use an alias,
as described in the section called “Artefact Types”.
For Stacked Bar Chart, Simple Temporal Evolution Stacked Bar Chart, Simple Pie, Simple Bar and Distribution Table, the measure and scale associated to the indicator must be the same for all types
showPolynomialRegression
(optional, default: true) Whether the polynomial regression is drawn (true) or not drawn (false) on the chart.
coeff
(optional, default: 1) the degree of the drawn polynomial. Supported values are:
1 for linear
2 for quadratic
3 for cubic
colorFromIndicator
(optional, default: none) uses the specified indicator's colour scale to assign a colour to each item drawn on the chart.
shape
(optional, default: SQUARE) defines the shape of the points on the chart. The supported values are:
SQUARE
CIRCLE
DIAMOND
UP_TRIANGLE
DOWN_TRIANGLE
RIGHT_TRIANGLE
LEFT_TRIANGLE
HORIZONTAL_RECTANGLE
VERTICAL_RECTANGLE
HORIZONTAL_ELLIPSE
VERTICAL_ELLIPSE
shapeWidth
(optional, default: 4.0) defines the width of the point on the maximised chart.
miniShapeWidth
(optional, default: 2.0) defines the width of the point on the chart thumbnail.
The chart takes one xmeasure
element and one ymeasure
with the following attributes.
The Y-Cloud chart is a visual representation of the values of a measure or indicator for the children of the selected artefact. For each child of the requested type, a dot is drawn with the value found for the selected measure. The chart requires one indicator
element.
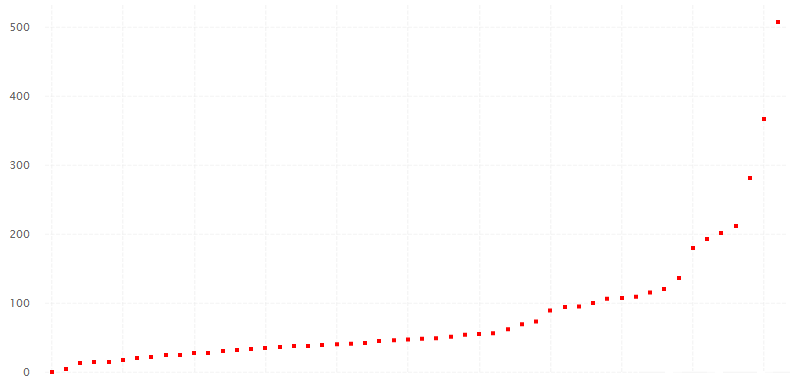
Y-Cloud Chart
<chart type="YCloud" id="YCLOUD_EXAMPLE" targetArtefactTypes="FILE"> <indicator color="RED">LC</indicator> </chart>
The chart
element may have the following attributes:
targetArtefactTypes
allows to filter descendants according to their type.
You can use one or more types. Concrete and abstract types are supported, so it is possible to use an alias,
as described in the section called “Artefact Types”.
For Stacked Bar Chart, Simple Temporal Evolution Stacked Bar Chart, Simple Pie, Simple Bar and Distribution Table, the measure and scale associated to the indicator must be the same for all types
The Temporal Evolution shows the evolution of one or measures over time. The measure representation is defined by a renderer
attribute (as explained in the section called “Datasets and Renderers” for more details). It replaces the deprecated Temporal Evolution Bar and Temporal Evolution Line charts, and allows representing more than one data sets on the one chart.
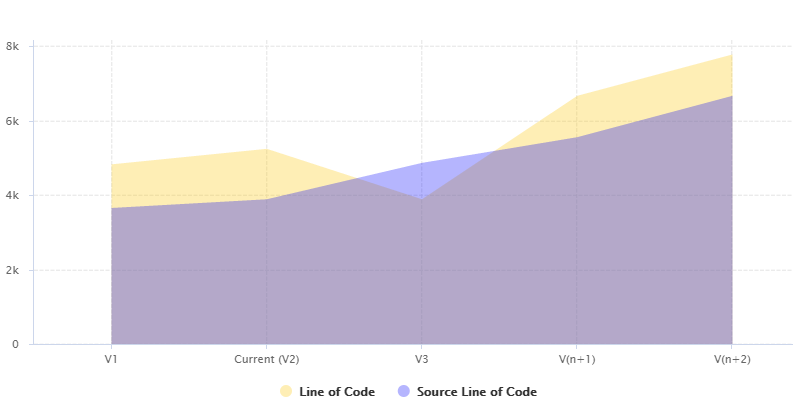
Temporal Evolution using an AREA renderer
<chart type="TEMPORALEVOLUTION" id="TEMPORAL_EVOLUTION_AREA_EXAMPLE" onlyLast="5" renderer="AREA"> <measure color="BLUE" alpha="75" label="Source Line of Code">SLOC <forecast> <version value="4865" timeValue="DATE(2014,05,01)" label="V3" /> <version value="5555" timeValue="DATE(2014,06,01)" /> <version value="2222+4444" timeValue="DATE(2014,08,01)" /> </forecast> </measure> <measure color="ORANGE" alpha="75" label="Line of Code">LC <forecast> <version value="SLOC" timeValue="DATE(2014,05,01)" label="V3" /> <version value="6666" timeValue="DATE(2014,06,01)" /> <version value="3333+4444" timeValue="DATE(2014,08,01)" /> </forecast> </measure> </chart>
The Temporal Evolution can also be used to draw a bar chart or a line chart, as shown below:
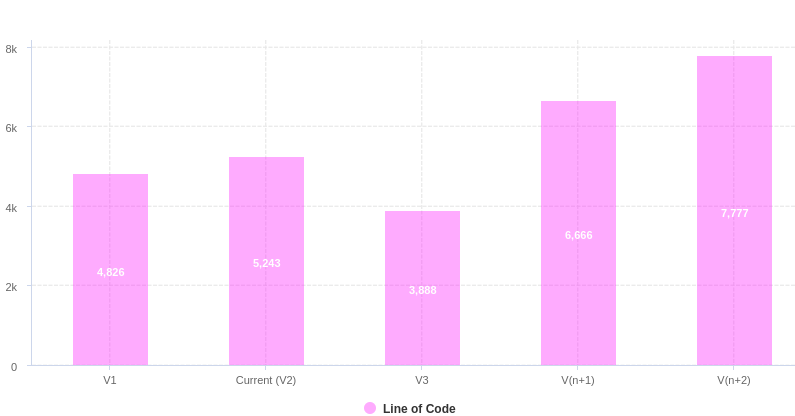
Temporal Evolution using a BAR renderer
<chart type="TEMPORALEVOLUTION" id="TEMPORAL_EVOLUTION_BAR" renderer="BAR" onlyLast="5" exclude="VIEWER"> <measure color="MAGENTA" alpha="85" label="Line of Code">LC <forecast> <version value="SLOC" timeValue="DATE(2014,05,01)" label="V3" /> <version value="6666" timeValue="DATE(2014,06,01)" /> <version value="3333+4444" timeValue="DATE(2014,08,01)" /> </forecast> </measure> </chart>
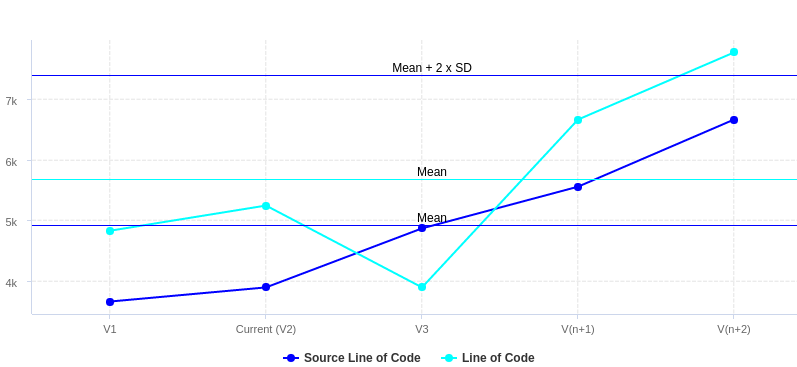
Temporal Evolution using a LINE renderer
<chart type="TEMPORALEVOLUTIONBAR" id="TEMPORAL_EVOLUTION_LINE_EXAMPLE" onlyLast="5" isCChart="true"> <dataset renderer="LINE"> <measure color="BLUE" label="Source Line of Code">SLOC <forecast> <version value="4865" timeValue="DATE(2014,05,01)" label="V3" /> <version value="5555" timeValue="DATE(2014,06,01)" /> <version value="2222+4444" timeValue="DATE(2014,08,01)" /> </forecast> </measure> <measure color="CYAN" label="Line of Code">LC <forecast> <version value="SLOC" timeValue="DATE(2014,05,01)" label="V4" /> <version value="6666" timeValue="DATE(2014,06,01)" /> <version value="3333+4444" timeValue="DATE(2014,08,01)" /> </forecast> </measure> </dataset> </chart>
The chart above is a normal Temporal Evolution where the x-axis uses a regular gap between all versions and uses the version name as the label.
Below is an example of the difference in representation when using the x-axis as a chronological marker.
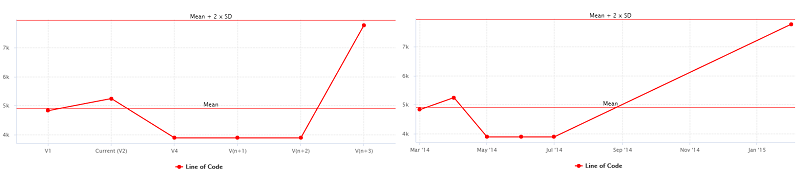
Temporal Evolution with versions distributed evenly on the x-axis, using the version name as the label (left),
or distributed on the x-axis according to the date at which the analysis was carried out.
Labels on the x-axis do to not correspond to the version name this time. (right).
<chart type="TEMPORALEVOLUTIONBAR" id="TEMPORAL_EVOLUTION_LINE_EXAMPLE_2" onlyLast="5" dateFormat="MMM d" byTime="true|false" isCChart="true"> <dataset renderer="LINE"> <measure color="RED" label="Line of Code">LC <forecast> <version value="SLOC" timeValue="DATE(2014,05,01)" label="V4" /> <version value="SLOC" timeValue="DATE(2014,06,01)" /> <version value="SLOC" timeValue="DATE(2014,07,01)" /> <version value="3333+4444" timeValue="DATE(2014,14,01)" /> </forecast> </measure> </dataset> </chart>
The chart
element may have the following attributes:
isCChart (optional, default: false)
transforms the chart in a C-Chart if set to true. This draws three extra lines to the chart at the following values on the y-axis:
mean
mean + (coefficient * standard deviation)
mean - (coefficient * standard deviation)
coeff
(optional, default: 0)
sets the value of the coefficient used to draw the control lines either side of the mean line when
isCChart
is set to true.
onlyLast
(optional, default: no limit)
defines the number of versions to be displayed, starting from the
one that is currently selected.
byTime
(optional, default: false)
defines whether versions are placed on the x-axis according to their analysis date. When activating this mode,
you can use the advanced options for the x-axis defined in the section called “Time Axis Configuration”.
breakOnMissingData
(optional, default: false)
specifies whether the line is interrupted (true) when a value is missing.
timeMeasure
(optional) is the measure ID (of type DATE) to use as the analysis date for a chart where byTime
is true. If not specified, the real analysis date of the version is used.
displayDate
(optional, default: false)
for all charts that display information about several versions. When set to false,
the version name is displayed in the chart. When set to true, the version date is displayed instead.
datePattern (formerly dateFormat)
(optional, default: empty): the date pattern, used when
the displayType is one of DATE,
DATETIME or TIME.
If this attribute is set, both dateStyle and timeStyle attributes are ignored. The date is formatted using the supplied pattern. Any format compatible with the Java Simple Date Format can be used. Refer to http://docs.oracle.com/javase/6/docs/api/java/text/SimpleDateFormat.html for more information.
dateStyle
(optional, default: DEFAULT): the date formatting style,
used when the displayType is one of DATE or DATETIME.
timeStyle
(optional, default: DEFAULT): the time formatting style,
used when the displayType is one of DATETIME or TIME. See above for available styles.
This chart represents the evolution of an indicator across the versions. It takes a single indicator as sub element. The values displayed are calculated on the fly. It is therefore sometimes recommended to use an Temporal Optimised Stacked Bar for performance reasons.
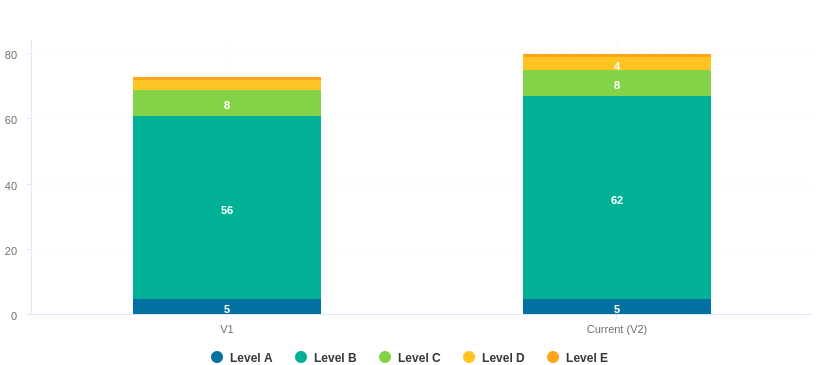
Temporal Optimised Stacked Bar
<chart type="SIMPLETEMPORALEVOLUTIONSTACKEDBAR" id="SIMPLETEMPORALEVOLUTIONSTACKEDBAR_EXAMPLE" targetArtefactTypes="FILE"> <indicator>ROOT</indicator> </chart>
The chart
for the Temporal Optimised Stacked Bar supports the following attributes:
This chart represents the evolution of several measures across several versions. It takes a a minimum of two measures as elements.

Temporal Optimised Stacked Bar
<chart type="OPTIMIZEDTEMPORALEVOLUTIONSTACKEDBAR" id="OPTIMIZED_TEMPORAL_EVOLUTION_STACKED_BAR_EXEMPLE" targetArtefactTypes="FILE"> <measure color="#006893" label="A">A_FILE</measure> <measure color="#00a38a" label="B">B_FILE</measure> <measure color="#79c142" label="C">C_FILE</measure> <measure color="#fec422" label="D">D_FILE</measure> <measure color="#f6a01b" label="E">E_FILE</measure> <measure color="#f48026" label="F">F_FILE</measure> <measure color="#f25b21" label="G">G_FILE</measure> </chart>
The chart
for the Temporal Optimised Stacked Bar does not have any specific attributes.
The Control Flow Chart is a graphical representation of the logical structure of a function using different-coloured shapes reflecting the type of logical break (if, while, switch...) in the code.
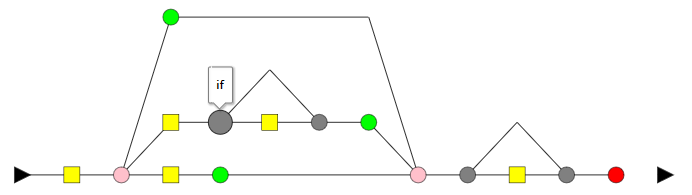
Control Flow Chart
<chart type="CONTROLGRAPH" id="CONTROL_FLOW_GRAPH_EXAMPLE"/>
The chart
for a Control Flow Chart does not have any specific attributes.
The View Source chart is a special chart-like placeholder on a dashboard that allows users to click it to view the source of the current artefact.
Depending on the artefact type, the View Source chart will either display a popup containing the artefact's source code, or will open a link to the artefact's URL. For more information about configuring access to external sources, consult the section called “Links to External Resources”.
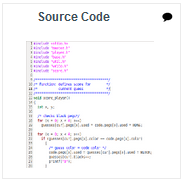
View Source
<chart type="SOURCECODE" id="SOURCE_CODE_EXAMPLE"</chart>
The chart
for the View Source does not have any specific attributes.
Table of Contents
Wizards provide the entry point for Squore users to create and edit
projects and meta-projects. A model can have one or more wizards, depending on
the options that a Squore administrator decides to display to end-users when they create projects.
This is achieved by editing the file Bundle.xml
located in the Wizards folder inside a particular model.
Creating or editing a project in Squore involves going through these three steps after selecting a wizard:
Note: When editing projects, the Data Provider Selection screen is shown or hidden depending on the ability of each Data Provider selected originally to accept new settings. When nothing can be changed, the step is skipped completely.
The syntax of a Bundle.xml file
offering one standard wizard and one meta-project wizard to the user is shown below:
<?xml version="1.0" encoding="UTF-8"?> <Bundle> <!-- attributes common to every wizard in this bundle --> <tags> <tag type="numericValue" name="Project Business Value" measureId="BV" suffix = "FP" defaultValue="0" /> </tags> <wizard wizardId="STD_PROJ" versionPattern="V#N1#" autoBaseline="false" users="demo;admin" groups="users" img="wizardicon.png"> <!-- attributes specific to this wizard --> <tags> <tag type="numericValue" name="Project Cost" measureId="COST" suffix = "M/M" defaultValue="0" /> </tags> <repositories all="true" hide="false"> <repository name="FROMPATH" checkedInUi="true"> <param name="path" value="/media/sources/" /> </repository> </repositories> <tools all="true"> <tool name="SQuORE" optional="false"> <param name="languages" value="cpp:.c,.C,.h,.H;java:.java;csharp:.cs;" availableChoices="cpp;java;csharp" /> </tool> <tool name="Antic_auto" optional="true" checkedInUI="true" projectStatusOnFailure="warning" /> </tools> </wizard> <wizard wizardId="STD_META_PROJECTS" projectsSelection="true" /> </Bundle>
In order for a wizard to appear in Squore, you need to define its ID, default version pattern and icon, and it will become available when clicking on the Create Project button. Note that the availability of a wizard can also be restricted to a set of users or groups. The rest of this chapter covers the settings available for each step of the project wizard.
The wizard
element accepts the following attributes:
wizardId
(mandatory) defines the ID of the wizard, used when creating projects from the command line
projectsSelection
(optional, default: false) defines whether a wizard shows a list of projects so that users can create a meta-project (true) or shows the list of Repository Connectors and Data Providers to create a regular project (false). For more information about meta-projects, see the section called “Project Selection in Meta-Projects”.
versionPattern
(optional) is the pattern to apply to define the version number when a new version is created
img
(mandatory) is the icon used in the web interface to display next to the wizards's name and description
autoBaseline
(optional, default: true) defines whether versions created using this wizard are by default baselines (true) or drafts (false). More information about baselines and drafts can be found in the Getting Started Guide.
users
(optional, no restriction if empty) is a semi-colon-separated list of users which are allowed to see the wizard
groups
(optional, no restriction if empty) is a semi-colon-separated list of Squore groups whose users are allowed to see the wizard
group
(optional, default: empty) defines a default display group for new projects. projects
that belong to the same group are shown in a common subfolder in the Project Portfolio.
hideRulesEdition
(optional, default: true) defines whether the Rules Edition step of the wizard is shown (false) or hidden (true) to users. This step allows users to modify the ruleset of the model to deactivate rules or change their default categories. More information about this feature can be found in the Getting Started Guide.
The users
and groups
attributes are only used to filter the list of
wizards in the web interface. This does not prevent users from creating projects using the wizard from the command line.
The versionPattern parameter allows specifying a pattern to create the version name automatically for every analysis. It supports the following syntax:
#N#: A number that is automatically incremented
#Nn#: A number that is automatically incremented using n digits
#Y2#: The current year in 2-digit format
#Y4#: The current year in 4-digit format
#M#: The current month in two digit format
#D#: The current day in two digit format
#H#: The current hour in 24 hour format
#MN#: The current minute in two digit format
#S#: The current second in two digit format
Any character other than # is allowed in the pattern. As an example, if you want to
produce versions labelled build-198.2013-07-28_13h07m (where 198 is an auto-incremented number and the date and time are the
timestamp of the project creation), you would use the pattern: build-#N3#.#Y4#-#M#-#D#_#H#h#MN#m
Users specify attributes in the first step project
creation or edition at project level. These attributes can also be used for
other artefact types and can be edited after building a project in the Forms tab of the Explorer.
You can define what information can enter when creating a project (or the default values offered to the users) by using the Tags section
of the wizard definition file. The attribute values specified by the user are passed just like measures passed by any other Data Provider.
The values are imported as base measures as long as the model contains a definition that uses the same measure ID.
<tags textAlign="RIGHT" valueAlign="LEFT"> <tag type="numericValue" name="Project Business Value" group="Important Decision Criteria" measureId="BV" suffix = "FP" defaultValue="0" /> <tag type="booleanChoice" name="is Critical" group="Important Decision Criteria" measureId="CRIT" defaultValue="false" /> <tag type="multipleChoice" name="Status: " measureId="STATUS" defaultValue="SNAPSHOT" displayType="radioButton"> <value key="SNAPSHOT" value="1" /> <value key="VALIDATION" value="2" /> <value key="RELEASE" value="3" /> </tag> <tag type="multipleChoice" name="Department: " measureId="DEPART" defaultValue="HR" displayType="comboBox"> <value key="ACCOUNT" value="1" /> <value key="HR" value="2" /> <value key="SALES" value="3" /> <value key="OTHER" value="4"/> </tag> <tag type="date" name="Sprint Start: " measureId="SPRINT_START" defaultValue="TODAY" /> <tag type="date" name="Sprint End: " measureId="SPRINT_END" defaultValue="2012/12/31" /> </tags>
The image below shows how attributes defined in the wizard appear to a Squore user when creating a version of a project:
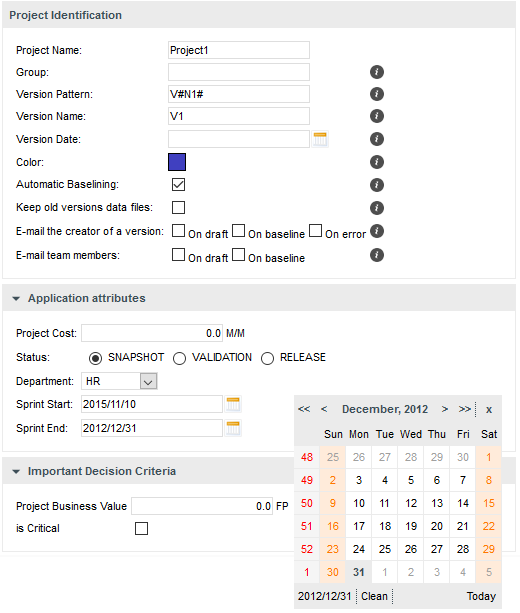
This other image shows how attributes defined in the wizard appear to a Squore user when in the Forms tab of the explorer:
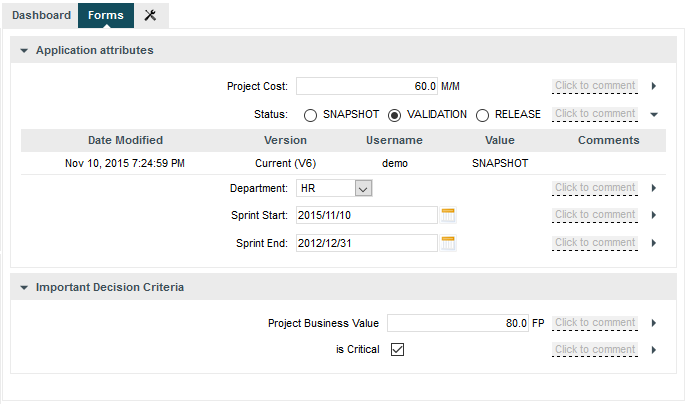
The tags
element is used to group several tag
sub-elements
and accepts the following attributes:
The tag
element accepts the following attributes:
type
(mandatory) defines the type of information accepted as value for this attribute.
The following values are accepted:
text for free text entry
numericValue for numbers
date for dates
booleanChoice for a boolean
multipleChoice for offering a selection as a list
displayType
(optional) allows specifying the display type in the Forms tab and
the project wizard. The following values are accepted:
comboBox for attributes of type multipleChoice
radioButton for attributes of type multipleChoice
input for attributes of type text
textarea for attributes of type text
name
(optional) is the label used to describe the attribute in the UI.measureId
(mandatory) is the ID of the measure that the value is passed to.
suffix
(optional, default: empty) is the label displayed after the value of the metric in the UI
defaultValue
(optional, default: empty) is the default value of the attribute if not specified by
the user. In the case of a date, the value TODAY() can
be used to automatically use today's date as the default value.group
(optional) helps grouping various attributes by category visually in the Forms tab of the Explorer.targetArtefactTypes
(optional, default: APPLICATION) allows associating the attribute to other types of artefacts (more on this below).Note: A tag element can appear within a wizard element or at Bundle level.
In case two tag elements impacting the same measureId exist at both levels, the definition within the
wizard element overrides the one at Bundle-level.
All attributes described above are defined at application level. They are visible and editable when creating a project and in the Form tab of the Explorer if the project is in draft mode. It is possible to associate an attribute to any artefact type by using the targetArtefactTypes attribute, as shown below:
<tag group="Project Status" targetArtefactTypes="APPLICATION;SOURCE_CODE;DOCUMENTATION;FOLDER" type="booleanChoice" name="is tested?" measureId="TESTED" defaultValue="false" />
You may specify whether users can use any available Repository Connectors, which is the default one and
what the default values are for each Repository Connector using the repositories
element in your wizard definition . If you
want to allow any Repository Connector in Squore, do not specify any repositories
element, which is the equivalent of using:
<repositories all="true" hide="false" />
In order to restrict which Repository Connectors are available, use:
<repositories all="false" hide="false"> <repository name="FROMPATH" checkedInUI="true" > <param name="path" value="/media/sources" /> </repository> <repository name="FROMZIP" /> <repository name="SVN" /> </repositories>
The repository
element accepts the following attributes:
name (mandatory) is the name of the Repository Connector to be used.
It must corresponds to one of the Repository Connectors defined in your configuration
(by default under <SQUORE_HOME>/configuration/repositoryConnectors/[name]).
Note: Each repository element accepts name/value pairs as parameters in which you can override
the values defined in the Repository Connector's default configuration.
The following image illustrates how the configuration above is displayed in Squore:
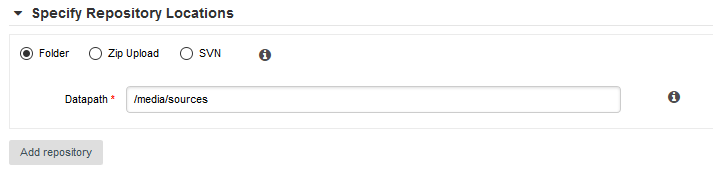
You may specify whether all or some Data Providers are available, and provide their default settings when the project wizard runs.
Data Providers are specified using the tools
element. If you simply want to allow users to pick any Data Provider available in Squore, use:
<tools all="true" expandedInUI="true" />
In order to restrict which Data Providers are available, use:
<tools all="false" expandedInUI="true"> <tool name="SQuORE" optional="false" projectStatusOnFailure="warning" expandedInUI="true" checkedInUI="true" /> <tool name="CheckStyle" optional="true" projectStatusOnFailure="error" checkedInUI="true" /> <tool name="Findbugs_auto" optional="true" projectStatusOnFailure="ignore" checkedInUI="false"> <param name="Findbugs_auto::class_dir" value="/path/to/my/classes" /> </tool> </tools>
The tool
element accepts the following attributes:
name is the name of the Data Provider to be used.
It must corresponds to one of the Data Providers defined in your configuration
(by default under <SQUORE_HOME>/configuration/tools/[name]).
optional (true|false, default: false): When set to false the Data Provider is always included in the analysis, even when not explicitly called from the command line. It also prevents from unchecking it in the web interface. When set to true, the Data Provider is available but not automatically included in an analysis.
projectStatusOnWarning (ignore|warning|error, default: warning) specifies the status to give the analysis if the Data Provider execution finishes in WARN level.
projectStatusOnFailure (ignore|warning|error, default: warning) specifies the status to give the analysis if the Data Provider execution finishes in ERROR or FATAL level.
When set to ignore, the the project ends in the Created state.
When set to warning, the the project ends in the Warning state, which means that a draft is created (even if you required a baseline version to be created).
When set to error, the the project ends in the Error state, which means that no new version is created.
Each tool element accepts name/value pairs as parameters in which you can override
the values defined in the Data Provider's default configuration. These parameters can be shown or hidden in the web UI, as shown below.
<tool name="Findbugs_auto"> <param name="java_path" value="/usr/bin/java" hide="true" /> </tool>
The following image illustrates how the configuration above is displayed in Squore:
When you configure a wizard to create meta-projects, the Data Providers step of the wizard displays a screen that allows you to pick specific versions of existing projects to build a meta project.
Type the name of a project to add it to your selection, and specify the version to include in your meta-project. There are no other configuration options available, the versions of the selected projects will be grouped in a new project, which will be rated as any other project in this model.
This screen is activated via the projectsSelection
attribute in a wizard:
<wizard wizardId="STD_META_PROJECTS" projectsSelection="true" />
If the wizard definition includes the SQuORE Data Provider, users will be able to select the programming languages for the source code to be analysed.
The picture above shows the Data Provider settings for the Squan Sources Data Provider
defined by these lines in the wizard's Bundle.xml:
<tools> <tool name="SQuORE" optional="false"> <param name="languages" value="cpp:.c,.C,.h,.H;java:.java;csharp:.cs;" availableChoices="cpp;java;csharp"" /> </tool> </tools>
The language settings are defined using the following attributes:
availableChoices
defines the languages available for this wizard. The key must be one of the currently supported languages:
supported languages: ABAP, Ada, C, C++, MindC, C#, COBOL, Java, JavaScript, Fortran 77, Fortran 90, Objective-C, PHP, PL/SQL, Python, T-SQL, Visual Basic .NET, XAML, Lustre
corresponding keys: abap, ada, c, cpp, mindc, csharp, cobol, java, javascript, fortran77, fortran90, objectivec, php, plsql, python, tsql, vbnet, xaml, lustre
value
defines the languages checked by default and their extensions when creating a new project, or used by default when not specified explicitly on the command line. One or more languages can be selected, so you can analyse projects containing source code in multiple languages.
You can also specify the list of default extensions for each language by using the
language:extension1,extension2; format. Here is an example of a full language specification:
<param name="languages" value="c:.c,.h;cpp:.cpp,.h;java;csharp" availableChoices="cpp;java;csharp" />
Note: You can set the same extension for more than one language,
but you will not be able to run an analysis that contains two languages using the same extension.
In the example above, see .h is a valid extension for C and C++, but you will
not be able to select both C and C++ as part of the same project because of the extension clash.
Milestones and goals for your project can be configured in the Wizard Bundle. A milestone has a name, a date, and allows you to set a goal for one or more metric in your project. You can configure your wizard to allow users to create milestones and define goals from scratch, or you can define your company milestones and objectives to ensure that they are part of every project created with this wizard.
In order to add support for milestones to your model, configure your wizard to allow users to create milestones and goals:
<Bundle xmlns:xi="http://www.w3.org/2001/XInclude"> <wizard wizardId="ANALYTICS" versionPattern="v#N1#" img="../../Shared/Wizards/squore_logo.png" hideRulesEdition="FALSE"> <milestones canCreateMilestone="TRUE" canCreateGoal="TRUE"> <goals displayableFamilies="ANALYTICS_GOALS" /> </milestones> </wizard> </Bundle>
The
milestones
element allows users to create milestones in
the project wizard (canCreateMilestone="TRUE") and also set goals (canCreateGoal="TRUE").
The goals can be set for metrics of the GOALS family only in this example (displayableFamilies="ANALYTICS_GOALS").
The result in the web UI is the following:
A wizard allowing users to create milestones freely during an analysis
When creating a new project, a user decides to create a Sprint 1 milestone with one objective of 500 for the Technical Debt indicator. Other goals can be set, for the other metrics in the project that belong to the ANALYTICS_GOALS family listed in the dropdown list at the bottom of the table.
If you have company-wide milestones and objectives that need to be set for every project created with the wizard, you can specify the goals directly. Milestones can also be marked as mandatory or optional:
<Bundle xmlns:xi="http://www.w3.org/2001/XInclude"> <wizard wizardId="ANALYTICS_WITH_MILESTONES" versionPattern="v#N1#" img="../../Shared/Wizards/squore_logo.png" hideRulesEdition="FALSE"> <milestones canCreateMilestone="TRUE" canCreateGoal="TRUE"> <goals displayableFamilies="GOALS"> <goal measureId="TECH_DEBT" mandatory="TRUE" highestIsBest="FALSE" /> <goal measureId="ISSUE_BLOCKER" mandatory="TRUE" highestIsBest="TRUE" /> <goal measureId="ISSUE_CRITICAL" mandatory="TRUE" highestIsBest="TRUE" /> <goal measureId="ROKR_SUBSET" mandatory="TRUE" highestIsBest="FALSE" /> </goals> <milestone id="REQUIREMENT_FREEZE" mandatory="TRUE"> <defaultGoal measureId="TECH_DEBT" value="0" /> <defaultGoal measureId="ISSUE_BLOCKER" value="1" /> <defaultGoal measureId="ISSUE_CRITICAL" value="30" /> <defaultGoal measureId="ROKR_SUBSET" value="1" /> </milestone> <milestone id="INFRASTRUCTURE_FREEZE" mandatory="TRUE"> <defaultGoal measureId="TECH_DEBT" value="0" /> <defaultGoal measureId="ISSUE_BLOCKER" value="1" /> <defaultGoal measureId="ISSUE_CRITICAL" value="50" /> <defaultGoal measureId="ROKR_SUBSET" value="1" /> </milestone> <milestone id="CODE_FREEZE" mandatory="TRUE"> <defaultGoal measureId="TECH_DEBT" value="0" /> <defaultGoal measureId="ISSUE_BLOCKER" value="1" /> <defaultGoal measureId="ISSUE_CRITICAL" value="90" /> <defaultGoal measureId="ROKR_SUBSET" value="0.5" /> </milestone> <milestone id="BETA_RELEASE" mandatory="FALSE"> <defaultGoal measureId="TECH_DEBT" value="1" /> <defaultGoal measureId="ISSUE_BLOCKER" value="1" /> <defaultGoal measureId="ISSUE_CRITICAL" value="95" /> <defaultGoal measureId="ROKR_SUBSET" value="0.3" /> </milestone> <milestone id="RELEASE" mandatory="TRUE"> <defaultGoal measureId="TECH_DEBT" value="1" /> <defaultGoal measureId="ISSUE_BLOCKER" value="1" /> <defaultGoal measureId="ISSUE_CRITICAL" value="100" /> <defaultGoal measureId="ROKR_SUBSET" value="0" /> </milestone> </milestones> </wizard> </Bundle>
When creating a new project, the predefined goals are filled in in the web interface, and you can still add a Beta Release milestone (using the default values specified in the wizard bundle) if needed by using the + icon:
A project wizard with preconfigured milestones and goals
The milestones
element accepts the following attributes:
canCreateMilestone
(optional, default: TRUE) defines if a button is available in the web UI to add new milestones
canCreateGoal
(optional, default: TRUE) defines if a button is available in the web UI to add new goals for milestones
hide
(optional, default: FALSE) allows hiding the milestones pane of the wizard in the web interface
The goals
element acceps the following attribute:
The goal
element allows preconfiguring your goals in the project and accepts the following attributes:
measureId
(mandatory) is the ID of the metric to use as a goal
highestIsBest
(optional, default: TRUE) specifies whether a higher value for the metric is better or not.
If this parameter was specified in the metric directly, then default value is the one set at metric-level instead of TRUE.
mandatory
(optional, default: false) defines whether users can remove a goal from the web interface
The milestone
element accepts the following attributes:
The defaultGoal
element accepts the following attributes:
For a complete example of how to use milestones in a Squore project, consult Appendix E, Milestones Tutorial.
Table of Contents
This section will take you through the description of the report format, help you adjust your template to certain roles or artefact types, and define which charts, tables, highlights and other data can be included in a Squore report.
Each model in the Squore Configuration can define a set of reports in
<SQUORE_HOME>/Configuration/models/MyModel/Reports/Bundle.xml.
Availability of these reports can be restricted based on a user's role in the project.
Here is an example configuration file for one report in Bundle.xml:
<?xml version="1.0" encoding="UTF-8"?> <Bundle xmlns:xi="http://www.w3.org/2001/XInclude"> <SquoreReport id="DR_DASHBOARD_REPORT" templatePath="../../Shared/Reports/templates/template.jrxml" logo="header_image.png"> <Role name="DEFAULT;PROJECT_MANAGER;DEVELOPER"> <Report type="APPLICATION;FILE"> <Charts displayComments="true"> <xi:include href="../../Analysis/key_performance_indicator.xml"/> <xi:include href="../../Analysis/Code/ISO9126_Maintainability/MaintainabilityKiviat.xml"/> <xi:include href="../../Analysis/Code/TechnicalDebt/TechnicalDebtTrend.xml"/> <xi:include href="../../Analysis/Code/ArtefactRating/FunctionOptimisedPie.xml"/> </Charts> <Tables> <xi:include href="../Dashboards/tables/line_counting.xml" /> <xi:include href="../Dashboards/tables/dates.xml" /> <xi:include href="../Dashboards/tables/levels.xml" /> <xi:include href="../Dashboards/tables/displayed.xml" /> <xi:include href="../Dashboards/tables/ArtefactsTable.xml" /> </Tables> <Indicators ids="CPXT"/> <Measures ids="VG;TESTS;TESTS_FAILED"/> <Infos ids="BUILD_DESCRIPTION" /> <Data> <Findings id="VIOLATIONS" /> <Findings id="PRACTICES" type="ALL_PRACTICE" /> <FindingOccurrences id="RELAXED_FINDINGS" relaxationState="RELAXED" /> <DefectReports id="WORST" /> <Artefacts id="RELAXED_ARTEFACTS" relaxationState="RELAXED" /> <Artefacts id="EXCLUDED_ARTEFACTS" relaxationState="EXCLUDED" /> <Highlights id="TOP_10_WORST_FILE" filterId="TOP_10_WORST_ARTEFACTS" /> </Data> <SubData> <SubArtefacts id="COMPLEX_MODULES" artefactTypes="MODULES" orderByMeasure="VG" inverted="true" > <Where measureId="CPXT" dataBounds="[0.5;["/> <Charts> <xi:include href="../../Shared/data_provider/squan_sources/dashboard/control_flow_graph.xml" /> <xi:include href="../../software_analytics/Dashboards/issues_distribution_pie.xml" /> <xi:include href="../../software_analytics/Dashboards/quality_kiviat.xml" /> </Charts> <Tables> <xi:include href="../../software_analytics/Dashboards/table_complexity_module.xml" /> <xi:include href="../../software_analytics/Dashboards/table_self_descriptiveness_module.xml" /> <xi:include href="../../software_analytics/Dashboards/table_rule_compliance.xml" /> <xi:include href="../../software_analytics/Dashboards/issue_by_severity_table.xml" /> <xi:include href="../../Shared/Analysis/product_quality/code/line_counting/line_counting_table.xml" /> </Tables> <Measures ids="VG;TESTS;TESTS_FAILED"/> </SubArtefacts> </SubData> </Report> </Role> </SquoreReport> </Bundle>
A Bundle is composed of one or more SquoreReport
elements. Each
SquoreReport
is associated to a JasperReports template file (a file with a .jrxml extension) that defines the
formatting of the final document. The attributes allowed for the SquoreReport
element are the following:
The parameters in Bundle.xml define the data that is exported and fed to the selected template file. The template used
throughout this manual supports all the documented features and is located in
<SQUORE_HOME>/configuration/models/Shared/Reports/templates/template.jrxml.
You can override the default header image in the report file by adding a logo
attribute in Bundle.xml, as shown below:
<SquoreReport id="DR_DASHBOARD_REPORT" ... logo="../../Shared/Reports/templates/header_logo.png">
The path to the header logo file is relative to the location of Bundle.xml.
For best results in the default report template, use a header image with a ratio of 408 by 65 points.
In each SquoreReport
element, one or more Role
elements can be defined to specify which users can generate the report. The only required attribute for the
Role
tag is name
, with a comma-separated list of roles.
If you want your template to be available to any logged-in user, specify the role name DEFAULT.
Each role contains one or more Report
elements, each one with a
type
attribute that specifies for which artefact type the report can be generated.
<Bundle xmlns:xi="http://www.w3.org/2001/XInclude"> <SquoreReport ... > <Role name="DEFAULT;PROJECT_MANAGER;DEVELOPER"> <Report type="APPLICATION;FILE"> ... </Report> </Role> </SquoreReport> </Bundle>
The Charts
element lists the dashboard charts that will be printed in the report.
The Charts
element has one or more chart
sub-elements. The charts available
for reports are the same as the charts used for dashboards. See the section called “The Charts Area” for a complete
list of available charts. Note that you can choose
to include the chart's comments in the report by setting the displayComments
to
true.
<Bundle xmlns:xi="http://www.w3.org/2001/XInclude"> <SquoreReport ... > <Role ... > <Report type="APPLICATION;FILE"> <Charts displayComments="true"> <xi:include href="../../Analysis/key_performance_indicator.xml"/> <xi:include href="../../Analysis/Code/ISO9126_Maintainability/MaintainabilityKiviat.xml"/> </Charts> ... </Report> </Role> </SquoreReport> </Bundle>
Tables
lists the score card tables that will be included in the report.
The Tables
element has one or more table
sub-elements. You can
use the tables created for the dashboard or create a table that is not included in any dashboard.
Refer to the section called “Scorecard Tables” for a complete reference about tables.
<Bundle xmlns:xi="http://www.w3.org/2001/XInclude"> <SquoreReport ... > <Role ... > <Report ... > ... <Tables> <xi:include href="../Dashboards/tables/line_counting.xml" /> <xi:include href="../Dashboards/tables/dates.xml" /> </Tables> ... </Report> </Role> </SquoreReport> </Bundle>
Using the Measures
, Indicators
and Infos
elements
(new in 18.0) in your report definition, you can ouput any metric from your model in your report. Each element takes a
ids
attribute which contains a semicolon-separated list of IDs for the metrics you want to include. When
including an indicator, the measure associated to the indicator is also automatically included.
<Bundle xmlns:xi="http://www.w3.org/2001/XInclude"> <SquoreReport ... > <Role ... > <Report ... > ... <Measures ids="VG;TECH_DEBT" /> <Indicators ids="CPXT" /> <Infos ids="NAME;BUILD_TIME" /> ... </Report> </Role> </SquoreReport> </Bundle>
Using these elements at Report
level exports the metrics for the
current artefact. You can also extract information for child artefacts by including the Measures
,
Indicators
and Infos
in a SubArtefacts
section of the report, as described in the section called “Including Information from Child Artefacts”.
The report bundle allows inserting other data about the artefact using the Data
element to add action items (element: DefectReports
),
violations and practices (element: Findings
), relaxed findings (element: FindingOccurrences
),
highlights (element: Highlights
)
and artefacts (element: Artefacts
).
<Bundle xmlns:xi="http://www.w3.org/2001/XInclude"> <SquoreReport ... > <Role ... > <Report ... > ... <Data> <DefectReports id="WORST" /> <Findings id="VIOLATIONS" /> <Findings id="PRACTICES" type="ALL_PRACTICE" /> <FindingOccurrences id="RELAXED_FINDINGS" relaxationState="RELAXED" /> <Highlights id="TOP_10_WORST_FILE" filterId="TOP_10_WORST_ARTEFACTS" /> <Artefacts id="RELAXED_ARTEFACTS" relaxationState="RELAXED" /> <Artefacts id="EXCLUDED_ARTEFACTS" relaxationState="EXCLUDED" /> </Data> </Report> </Role> </SquoreReport> </Bundle>
Action Items and Findings are sorted in the same way as in the user interface, which you can customise for each model by following the procedure described in the section called “Sort Order for Action Items and Findings”.
The attributes allowed for the Findings
element are the following:
id
(mandatory) is a unique identifier for the list of findings.
type
(optional, default value: NO_FILTER) is the filter to apply to the findings list. The following
values are accepted, so you can generate the same lists as in the web interface:
NO_FILTER
LOST_PRACTICE
ACQUIRED_PRACTICE
DETERIORATED_PRACTICE
IMPROVED_PRACTICE
ALL_PRACTICE
The attributes allowed for the FindingOccurrences
element are the following:
id
(mandatory) is a unique identifier for the list of relaxed findings occurrences.
relaxationState
(mandatory) is the filter to apply to the findings occurrences list. The following
values are accepted, so you can generate the same lists as in the web interface:
RELAXED
RELAXED_DEROGATION
RELAXED_LEGACY
RELAXED_FALSE_POSITIVE
Findings occurrences are sorted by artefact path.
You can include charts and tables from child artefacts in reports by adding a
SubData
node in your report Bundle (new in 18.0). This allows you for
example to generate a report at project level that includes information about every complex function in your project, as shown below:
<Bundle xmlns:xi="http://www.w3.org/2001/XInclude"> <SquoreReport id="SubDataSample" template="..."> <Role name="DEFAULT"> <Report type="APPLICATION"> <Charts> ... </Charts> <SubData> <SubArtefacts id="COMPLEX_MODULES" artefactTypes="MODULES" orderByMeasure="VG" inverted="true"> <Where measureId="CPXT" dataBounds="[0.5;["/> <Charts> <xi:include href="../../Shared/data_provider/squan_sources/dashboard/control_flow_graph.xml" /> <xi:include href="../Dashboards/issues_distribution_pie.xml" /> <xi:include href="../Dashboards/quality_kiviat.xml" /> </Charts> <Tables> <xi:include href="../Dashboards/table_complexity_module.xml" /> <xi:include href="../Dashboards/table_self_descriptiveness_module.xml" /> <xi:include href="../Dashboards/table_rule_compliance.xml" /> <xi:include href="../Dashboards/issue_by_severity_table.xml" /> <xi:include href="../../Shared/Analysis/product_quality/code/line_counting/line_counting_table.xml" /> </Tables> </SubArtefacts> </SubData> </Report> </Role> </SquoreReport> </Bundle>
The SubData
element accepts one or more SubArtefacts
elements with the
following specification:
<SubData> <SubArtefacts id="CONTROL_GRAPH" artefactTypes="FUNCTION" | [linkType="<linkId>"] [onlyDirectChildren="false"] [orderByMeasure="LC"] [inverted="false"] [artefactsLimit=""]> <Where measureId="VG" dataBounds="[10;["|value="10" /> <Charts> <xi:include href="../Dashboards/charts/control_graph.xml" /> </Charts> <Tables> <xi:include href="../Dashboards/tables/table.xml" /> </Tables> </SubArtefacts> </SubData> </Bundle>
id
(mandatory) is an ID to identify the list of child artefacts internally in the report
artefactTypes
or linkType
(mandatory) identify the type of target artefacts to include in the report. For more information about links, refer to the section called “Artefact Links”.
onlyDirectChildren
(optional, default: false) includes artefacts that are direct children of the current artefact
when set to true, or all descendants of the current artefact when set to false.
orderByMeasure
(optional, alphabetical if omitted) allows sorting the list of artefacts according to the value of the specified measure ID.
inverted
(optional, default: false) allows reversing the sort order defined by the orderByMeasure
attribute.
artefactsLimit
(optional, default: none) allows limiting the number of child artefacts to include.
The list of sub-artefacts can be further refined with a Where
element that specifies a value or bounds for a metric, as illustrated in the two examples below.
Including functions with failing tests:
<SubArtefacts id="WITH_FAILED_TESTS" artefactTypes="FUNCTION"> <Where measureId="TEST_FAILURES" dataBounds="[1;[" /> </SubArtefacts>
Including functions no test coverage:
<SubArtefacts id="FULLY_COVERED" artefactTypes="FUNCTION"> <Where measureId="TEST_COVERAGE" value="0" /> </SubArtefacts>
It is possible to modify the look and feel of the default report. The report functionality uses a JasperReports template,
an XML file with a .jrxml extension that can be edited in Jaspersoft Studio
or in a text editor. The main template file (<SQUORE_HOME>/configuration/models/Shared/Reports/templates/template.jrxml)
includes most of the other files in the templates folder as subreports and allows the data sent from Squore to be turned into
the final report document.
For any help with JasperReports, consult the forums at https://community.jaspersoft.com/.
The template is split into the following sections:
Background
Title
PageHeader
ColumnHeader
Details (the body of the report where sub-reports are inserted)
ColumnFooter
PageFooter
LastPageFooter
Summary
Squore provides values for the following variables in the template automatically:
$P{REPORT_DATA_SOURCE}: The full contents of the intermediate report file
$P{appName}: Squore
$P{application}: The name of the project
$P{artefactName}: The name of the artefact
$P{artefactType}: The type of the artefact
$P{author}: The name of the user generating the report
$P{companyName}: Squoring
$P{companyUrl}: https://www.squoring.com/
$P{logo}: The path to the logo to use in the header
$P{model}: The analysis model used
$P{poweredBy}: The path to the powered by Squore logo
$P{reportDate}: The date at which the report was generated
$P{restoreUrl}: The a URL to open the project's dashboard in Squore
$P{supportUrl}: https://support.squoring.com/
$P{version}: The name of the version
$P{versionDate}: The analysis date
For each chart from the dashboard that you include in a report, the following parameters are also available:
$P{CHART_ID}: a unique identifier for the chart based on the chart's original ID
$P{CHART_URL_0} to $P{CHART_URL_X}: used to resolve the path to chart [0] to [X] (based on the chart's position in Bundle.xml
$P{CHART_NAME_0} to $P{CHART_NAME_X}: used to resolve the name of chart [0] to [X] (based on the chart's position in Bundle.xml
Up to 16 charts (and their comment threads) can be included without modifying the default template.
Subreports are activated based on the presence of an XML element in the data sent by Squore. The following lines
checks for the presence of a highlights category in the exported data with the following dataSourceExpression
to
activate the highlights.jrxml subreport:
<detail>
...
<subreport>
...
<dataSourceExpression><![CDATA[((net.sf.jasperreports.engine.data.JRXmlDataSource)$P{REPORT_DATA_SOURCE}).subDataSource("//Highlights")]]></dataSourceExpression>
<subreportExpression><![CDATA["/../../../Shared/Reports/templates/highlights.jasper"]]></subreportExpression>
</subreport>
</detail>The following is a full sample of the data sent by Squore and fed into the report template. Note that this data is only created in memory and not saved to disk when generating a report in Squore. This sample is provided to help you understand how the JasperReports template locates data to extract and format in the final report document.
<?xml version="1.0" encoding="UTF-8"?> <ReportModelResources appName="Squore" application="Earth" artefactName="Earth" artefactType="Application" author="demo" companyName="Squoring Technologies" companyUrl="http://www.squoring.com/" logo="/path/to/header.image" model="software_analytics" poweredBy="/path/to/poweredBy.image" reportDate="2018.02.27 17:55:54 CET" restoreUrl="${artefactURL}?tabName=default" supportUrl="http://support.squoring.com/" version="V6" versionDate="2017.09.05 01:00:00 CEST"> <Charts> <Chart id="INDICATOR" name="Key Performance Indicator" path="/path/to/chart.image"/> <Chart ... /> </Charts> <Tables> <Table id="COMPLEXITY_DENSITY" name="Complexity"> <Line data="10,8 %" evolution="/path/to/trend.image" image="/path/to/level.image" isIcon="true|false" isOnlyText="true|false" name="Ratio of complex modules"/> <Line ... /> </Table> <Table ... > ... </Table> </Tables> <Measures> <Measure evolution="↑" id="VG" name="Cyclomatic Complexity" refValue="335" value="453"/> <Measure ... /> </Measures> <Indicators> <Indicator evolution="/path/to/trendImage.svg" icon="/path/to/icon.svg" id="CPXT" level="Level B" name="Complexity Distribution" refIcon="$/path/to/levelImage.svg" refLevel="Level A"> <Measure evolution="↑" id="CPXT" name="Complexity Distribution" refValue="0.01" value="0.0.3"/> </Indicator> <Indicator ... /> </Indicators> <Infos> <Info id="LANGUAGE" name="Language" refValue="Multiple" value="Multiple"/> <Info ... /> </Infos> <Data> <Findings id="VIOLATIONS" total="247" totalDelta="104" type="Findings" url="${artefactURL}?tabName=findings"> <FindingsDefinition CHARACTERISTIC="Maintainability" SCALE_NATURE="Non Conformity" SCALE_REMEDIATION="High" SCALE_SEVERITY="Critical" <!-- scales and characteristics according to your analysis model --> delta="+1" desc="Functions shall not called themselves either directly or indirectly (see [MISRA-C:2004]: RULE 16.2)." justif="My relaxation comment" measureId="R_NORECURSION" mnemo="NORECURSION" name="Recursion are not allowed" occ="1" toolName="Squan Sources"/> <FindingsDefinition ... /> </Findings> <Findings ... > ... </Findings> <FindingOccurrences id="FINDINGS" relaxationState="RELAXED"> <Artefact name="main(int,char*[])" path="apps/master.c" type="C Function" url="${artefactURL}?tabName=FINDINGS"> <Finding count="1" id="2064416" line="Ligne: 95" new="true" tool="Squan Sources"> <Rule externalId="R_COMPOUND" mnemonic="COMPOUND" name="Missing compound statement"/> <Relaxation date="2018-01-31T10:08:04" status="Derogation (Imported)" user="demo">keeping some conciseness by avoiding using compound {}</Relaxation> </Finding> <Finding ... > ... </Finding> </Artefact> </FindingOccurrences> <DefectReports id="AIS"> <DefectReportsDefinition SCALE_AI_TYPE="Non Regression" SCALE_PRIORITY="High" <!-- scales according to your analysis model --> artefactName="hi_scores_disp(int)" artefactPath="apps/score.c" desc="The object hi_scores_disp(int) has a higher number of 'Blocker' or 'Critical' rules violated since the previous version." id="${ActionItemId}" measureId="${ActionItemId}" name="More 'Blocker' or 'Critical' rules violated" scope="C Function" since="V6" status="Open" url="${artefactURL}?tabName=action-items"> <Reason desc="Code Status reveals that development is in progress (=1). "/> <Reason ... /> </DefectReportsDefinition> <DefectReportsDefinition ... /> </DefectReports> <Highlights col0="New Code Stability Index" col1="Line Count" filterId="TOP_10_MOST_CHANGED_ARTEFACTS" id="MOST_CHANGED" nbColumns="2" title="Top 10 most changed artefacts"> <TopArtefact artefactName="print_instructions_fr()" artefactPath="core/write.c" col0="12,5 %" col1="72" rating="/path/to/level.image" url="${artefactURL}?tabName=highlights"/> <TopArtefact ... /> </Highlights> <Artefacts id="RELAXED_ARTEFACT" relaxationState="RELAXED"> <Artefact name="machine.c" path="apps" relaxationComment="Why I relaxed this..." relaxationDate="2018.02.28 16:11:29 CET" relaxationUser="demo" type="C File"/> <Artefact ... /> </Artefacts> </Data> <SubData> <SubArtefacts id="COMPLEX_MODULES"> <SubArtefact name="machine_plays()" path="apps/machine.c" type="C Function" url="${artefactURL}"> <!-- Each SubArtefact contains Charts, Tables Measures, Indicators and Infos sections similar to the ones at ReportModelResources level --> <Charts> <Chart ... /> </Charts> <Tables> <Table ... /> </Tables> <Measures> <Measure ... /> </Measures> <Indicators> <Indicator ... /> </Indicators> <Infos> <Info ... /> </Infos> </SubArtefact> </SubArtefacts> </SubData> </ReportModelResources>
${artefactURL} is a direct link to open the specified Explorer tab in Squore for the artefact mentioned in the report.
Table of Contents
Each model described in the Squore Configuration may define a set of
exports in the models/MODEL/Exports/Bundle.xml bundle file.
Exports available in the user interface depend on the role of the currently
logged-in user and the selection in the Project Portfolios and the Artefact Tree
views.
Here is an example of a bundle file:
<?xml version="1.0" encoding="UTF-8"?> <Bundle> <Role name="DEFAULT"> <Export type="MODEL"> <ExportScript name="Project Portfolio" script="${scriptDir}/sqexport.pl"> <arg value="-f" /> <arg value="${outputFile}" /> <arg value="versions" /> <arg value="-ml" /> <arg value="-u" /> <arg value="${idUser}" /> <arg value="${idModel}" /> <arg value="${group}" optional="true" /> </ExportScript> </Export> <Export type="APPLICATION"> <ExportScript name="Functions with level G" script="${scriptDir}/sqexport.pl"> <arg value="-f" /> <arg value="${outputFile}" /> <arg value="artefacts" /> <arg value="-mR" /> <arg value="-T" /> <arg value="${types['FUNCTION']}" /> <arg value="-L" /> <arg value="LEVELG" /> <arg value="-u" /> <arg value="${idUser}" /> <arg value="${idModel}" /> </ExportScript> </Export> </Role> </Bundle>
Exports defined for the MODEL type are available when clicking on a model name or a group name in the Project Portfolios (new in 18.0).
The default Squore configuration includes the following scripts by default. Each script is described in an appendix at the end of this manual.
The Bundle.xml file above contains some variables
that are replaced at runtime. The following is the list of variables that
can be used in the ExportScript
and
arg
XML elements.
Note that the ${outputFile} variable is mandatory.
Used to resolve the location of the addons directories on Squore Server, in
which the scripts/export-scripts subdirectory contains the default
scripts.
Used to resolve the location of the configuration directories on Squore Server,
in which the <MODEL_NAME>/Exports subdirectory contains
the scripts you added to the product.
The base URL of the Squore server.
The name of the output file where the export script writes to. The filename is guaranteed to be unique on each call.
The identifier of the logged in user.
The identifier of the model that is currently selected in the Project Portfolios.
The identifier of the group that is currently selected in the Project Portfolios. (new in 18.0)
The identifier of the application that is currently selected in the Project Portfolios.
The identifier of the version that is currently selected in the Project Portfolios.
The identifier of the artefact that is currently selected in the Artefact Tree.
This function resolves at runtime the type aliases of TYPENAME. That may be used to simplify bundles, as you may achieve the exact same thing by manually listing all types. The result is a coma separated list of types.
The list of action items raised by Squore according to the triggers configured in your decision model can be exported out of Squore so it is reused and managed in any third-party application you use to track defects or issues. By default, Squore supports exporting in these formats:
This list can be expanded by adding custom export formats to your configuration.
Before making a new export available, you need to understand the information that is available to export. In order to see the full export, export action items from Squore using the XML export to dumps all the information available to an xml file. Creating a new format is as simple as creating a stylesheet to manipulate the contents of the full export to your liking.
Let's first look at what an export
configuration looks like. On Squore Server, go to <SQUORE_HOME>/Configuration/scripts/export.
Each export format is specified in its own folder. Each export format is defined by two files: transform.xsl
and export.properties. The file file transform.xsl is a stylesheet to define what information
gets exported, and the file export.properties defines the extension and charset of the export file.
Note: The export.properties file is optional. If omitted, Squore will create a file with a ".xml" extension using the UTF-8_BOM character set, as if using the file below:
charsetName = UTF-8_BOM extension = .xml
For more information about available charsets, consult http://docs.oracle.com/javase/6/docs/api/java/nio/charset/Charset.html
After you to define your stylesheet, create a new folder called MyCustomExport
in Squore's configuration folder and create the two definition files needed by saving your stylesheet as transform.xsl
and specifying the desired extension and charset for the report file . The new export format will be available in Squore the next time
you refresh your dashboard.
Table of Contents
The Highlights tab in Squore's Explorer is a flat list of artefacts in predefined categories for a model. These categories are defined in your model by including content in the highlights Bundle.xml file for your model. In this chapter, you will learn to understand the default highlights in the default models and will be able to consult the full reference for formatting a highlights bundle.
The default highlights bundle looks similar to this:
<Bundle> <Role name="DEFAULT"> <Filters type="PACKAGES"> <TopArtefacts id="TOP_10_WORST_ARTEFACTS" order="DESC" resultSize="10"/> <TopDeltaArtefacts id="TOP_10_MOST_DETERIORATED_ARTEFACTS" order="DESC" resultSize="10"/> <TopDeltaArtefacts id="TOP_10_MOST_IMPROVED_ARTEFACTS" order="ASC" resultSize="10"/> <TopNewArtefacts id="ALL_NEW_ARTEFACTS" order="DESC" resultSize="*"/> </Filters> </Role> </Bundle>
Highlight definitions from the Bundle display in the Highlights tab of the Explorer in Squore:
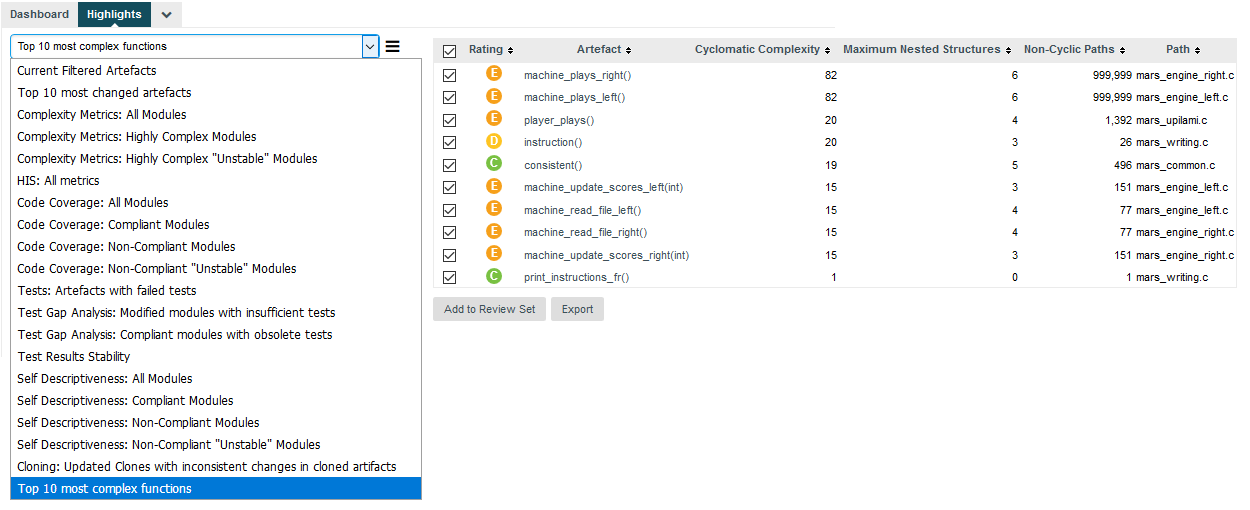
The Highlights tab of the Explorer
Highlight definitions can be created directly in the web interface and can be shared between users and projects. You only need to learn about the syntax of the Highlights bundle if you want to customise the list of default highlights or make new ones available by default in your configuration.
The XML Schema for the highlights bundle is described in highlights.xsd.
The Bundle
element accepts the following sub-elements:
Role
(mandatory) allows grouping several highlight definitions for a particular role. This element has a mandatory name
attribute where you can specify a role ID.
Filters (mandatory)
allows grouping several highlight definitions for a particular artefact type. This element has a mandatory type
attribute where you can specify an artefact type.
TopArtefacts
is a type of highlight definition used to retrieve artefacts with the biggest value for a given measure.
TopDeltaArtefacts
is a type of highlight definition used to retrieve artefacts with the biggest variation in the value of a given measure since an earlier version.
TopNewArtefacts
is a type of highlight definition used retrieve artefacts that are new in the current version, sorted according to the value of a given measure.
The common attributes for all highlight definitions types are as follows:
TopArtefacts
allows the following attributes:
artefactTypes
(optional, default: any) defines the types of artefacts to filter on.
excludingTypes
(optional, default: none) lists the artefact types for which the metric should not be displayed. This allows refining the types entered in the main filter above.
measureId
(optional, default: the measureId associated with the root indicator) is the name of the measure Id to filter on.
order
(optional, default: ASC) is the sort order for the list according to the reference measure ID. Valid values are ASC and DESC.
altMeasureId
(optional, default: empty) is the second measure ID to use for sorting.
altOrder
(required if altMeasureId
is set, default: empty) is the sort order for the second measure ID. Valid values are ASC and DESC.
resultSize
(mandatory) is the number of results to include in the list. Use 10 to display 10 artefacts or * to display all artefacts.
All highlight definitions support the following nested elements, to customise the output:
The Column
allows the following attributes:
measureId
or indicatorId
or infoId
(mandatory) is the ID of the measure, indicator or textual information to display
artefactTypes
(optional, default: the parent value of artefactTypes
) lists the artefact types for which the metric should be displayed. This allows refining the types entered in the main filter above.
excludingTypes
(optional, default: the parent value of excludingTypes
) lists the artefact types for which the metric should not be displayed. This allows refining the types entered in the main filter above.
headerDisplayType
(optional, default: NAME) is the label to display in the header. The supported values are:
NAME for the metric's name
MNEMONIC for the metric's mnemonic
displayType
(optional, default: VALUE) sets the value display type. The supported values are:
VALUE for the metric's numeric value
RANK for the indicator's rank
ICON for the indicator's rank icon
NAME for the indicator level's name
MNEMONIC for the indicator level's mnemonic
DATE for the metric's value, displayed as a UTC date
DATETIME for the metric's value, displayed as a UTC date and time
TIME for the metric's value, displayed as a UTC time
For DATE, DATETIME and TIME, you can specify the required format using the dateStyle, timeStyle and datePattern attributes described below.
decimals
(optional, default: 2) sets the number of decimals, used when the displayType is VALUE.
dateStyle
(optional, default: DEFAULT): the date formatting style,
used when the displayType is one of DATE or DATETIME.
timeStyle
(optional, default: DEFAULT): the time formatting style,
used when the displayType is one of DATETIME or TIME. See above for available styles.
datePattern (formerly dateFormat)
(optional, default: empty): the date pattern, used when
the displayType is one of DATE,
DATETIME or TIME.
If this attribute is set, both dateStyle and timeStyle attributes are ignored. The date is formatted using the supplied pattern. Any format compatible with the Java Simple Date Format can be used. Refer to http://docs.oracle.com/javase/6/docs/api/java/text/SimpleDateFormat.html for more information.
suffix
(optional, default: empty) is the label displayed after the value of the metric in the UI
useBackgroundColor
(optional, default: false) allows you to use the indicator level as the background colour of the cell. This is only valid when using a column with indicatorId
. You can also control the transparency of the background colour with the attribute
alpha
(optional, default: 100) which accepts a value between 0 (transparent) and 255 (opaque).
Either measureId
, infoId
or indicatorId
is required. Note that all display related tags, except headerDisplayType
and displayType
are ignored when infoId
is used.
You can build interactive tutorials to help users understand which areas of Squore to focus on, or help them discover and reach new functionality. This chapter teaches you about the concepts behind the design of a tutorial in Squore and highlights how you can expand on the existing framework.
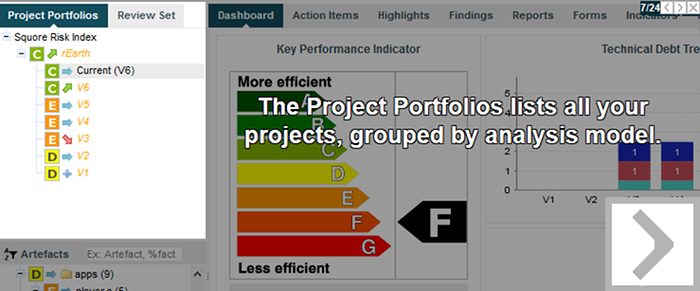
A tutorial explaining the purpose of the Project Portfolios.
Here are the key concepts you should understand about tutorials before reading further:
A tutorial is a series of steps that users follow in the web interface. Each step can highlight parts of the user interface, and display help text to make it obvious what to look at and why. Optionally, a step may allow users to interact with the web interface so they can try out the concept that is being explained by themselves before moving on to the next step of the tutorial.
Steps can be grouped in phases to make the flow of your tutorial more logical and perform actions before a step is executed.
Users launch tutorials from ? > Tutorials, which lists all the available tutorials in two sections: general-purpose tutorials, which apply to the application in general, and model-specific tutorials, which apply to a specific analysis model.
Like most other aspects of Squore, tutorials are fully localisable via the use of properties files.
Before you create your first tutorial, you must decide if it addresses general application
features or if it is specific to a model. Your choice impacts the location of the Bundle.xml file that will
reference your tutorial:
Application tutorials should be referenced in MyConfiguration/configuration/tutorials/Bundle.xml and
their properties must be located in MyConfiguration/configuration/models/Shared/Description/tutorial_en.properties
Model tutorials are referenced in MyConfiguration/configuration/models/MyModel/Tutorials/Bundle.xml and
their properties can be located in any .properties file included in the model's description bundle.
The tutorial selection popup showing general tutorials and model-specific tutorials.
Tutorials use an XML syntax where each help
element is a separate tutorial, made of
several item
elements used to highlight elements of the web interface and define help text to display
next to them. In order to control the flow of the tutorial and the display of elements, you can group items
in phase
elements, and perform pre-requisite actions to carry out before
an element is highlighted.
Here is a simple 4-step example in XML, followed by screenshots of each step:
<help id="DASHBOARD_TOUR" icon="dashboard_tour/icon.png" groups="demo"> <item element="DRILLDOWN" descrId="EXPLAIN_DRILLDOWN" /> <phase type="PROGRESSIVE" textPosition="RIGHT"> <item element="PORTFOLIO_TREE" descrId="EXPLAIN_PORTFOLIOS" maskColor="#2AA0D5"/> <item element="ARTEFACT_TREE" descrId="EXPLAIN_ARTEFACT_TREE" maskColor="#FF193B" /> <item element="MEASURE_TREE" descrId="EXPLAIN_INDICATOR_TREE" maskColor="#B2AB09" /> </phase> </help>
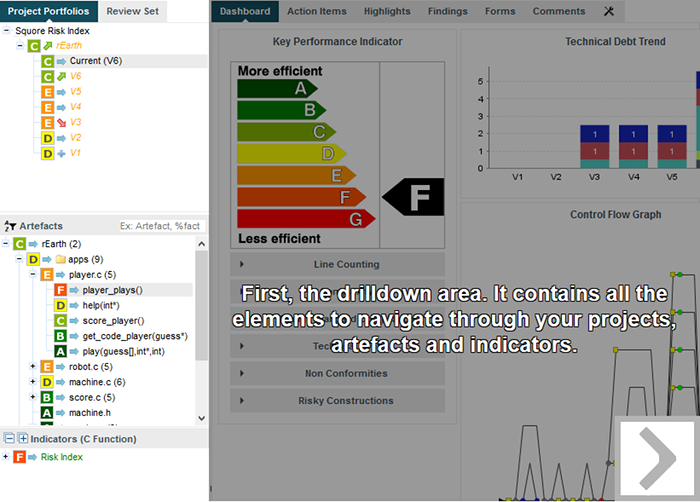
Step 1: Highlight and explain the drilldown panel
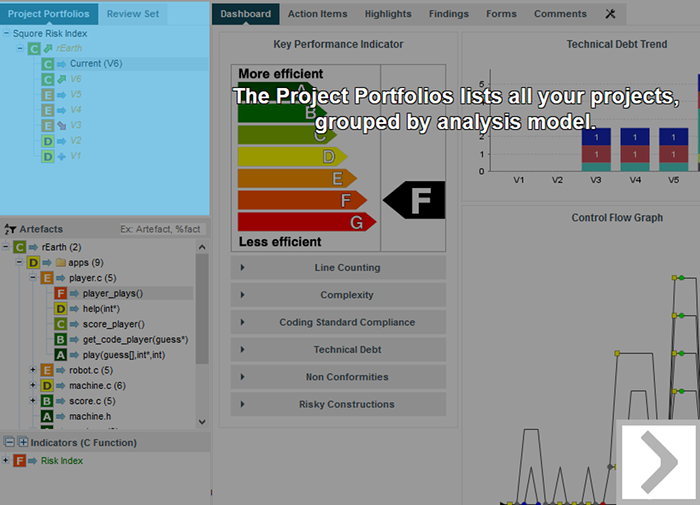
Step 2: Highlight and explain the Project Portfolios
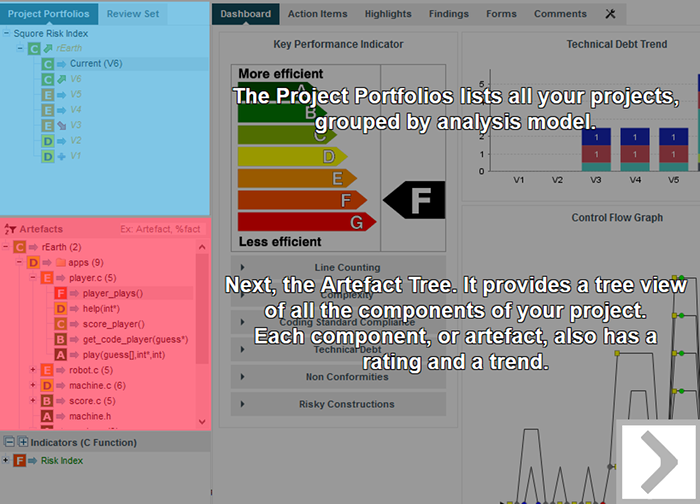
Step 3: Highlight and explain the Artefact Tree, keeping the previous element highlighted, since we are in a progressive phase
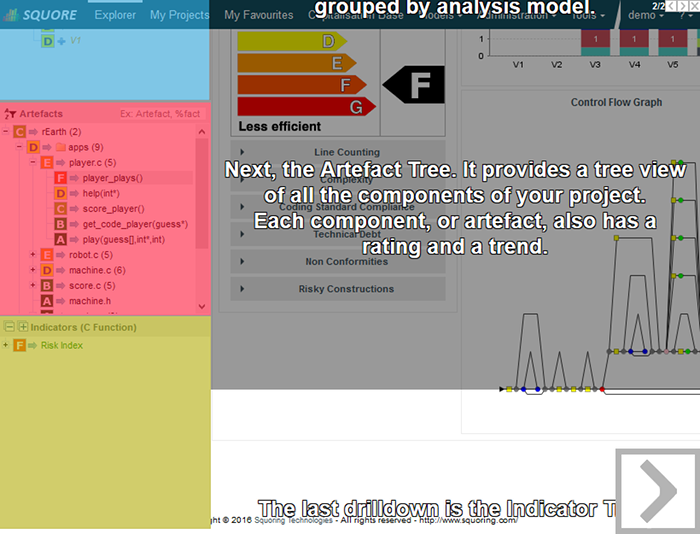
Step 4: Highlight and explain the Indicator Tree in the final step of the progressive phase of the tutorial
More information about the XML syntax you can use to create tutorials is explained in the section called “Tutorial Syntax Reference”.
Each tutorial in your bundle is bound by a help
element. The help
element supports
the following attributes:
id
(mandatory) is the internal ID of the tutorial, which you can use in a properties file to translate as needed (using TUTO.<id>.NAME and TUTO.<id>.DESCR) to display in the correct language in the Tutorials popup in the web interface.
icon
(optional, default: standard tutorial icon) is the path to the icon to display for this tutorial in the tutorial selection popup. The icon is relative to the location of Bundle.xml.
opacity
(optional, default: 0.4) is the opacity of the mask (the grey element that surrounds the highlighted element) for this tutorial. You can specify a value between 0 and 1 where 0 is transparent and 1 is completely opaque.
firstConnectionGroup
(optional, default: none) allows launching this tutorial automatically for users of the specified groups the first time that they log into Squore. This attribute accepts a semicolon-separated list of groups.
users
(optional, default: none) restricts access to the tutorial to the specified users. Use a semicolon to specify a list of several user logins.
groups
(optional, default: none) restricts access to the tutorial to users from the specified groups. Use a semicolon to specify a list of several groups.
profiles
(optional, default: none) restricts access to the tutorial to users who have the specified profiles. Use a semicolon to specify a list of several profiles.
textPosition
(optional, default: EXTERNAL) is the location of the help text relative to the highlighted element. This attribute supports the following values:
INTERNAL to display the text inside the item
LEFT to display the text to the left of the item
RIGHT to display the text to the right of the item
EXTERNAL to display the text dynamically to the left or the right of the item, depending on where more space is available
TOP to display the text above the item
BOTTOM to display the text under the item
textAlign
(optional, default: CENTER) (new in 18.0) defines the alignment of the text. This attribute supports the following values:
CENTER to center the text
LEFT to left-align the text
RIGHT to right-align the text
maskColor
(optional, default: transparent) is the colour of
the mask to display over the highlighted element. This attribute supports the colour syntax detailed in [colour syntax] .
maskOpacity
(optional, default:0.6) is the opacity of the mask over the highlighted element for this tutorial. You can specify a value between 0 and 1 where 0 is transparent and 1 is completely opaque.
textSize
(optional, default: 25) is the size of the help text displayed next to the highlighted element.
textColor
(optional, default: WHITE) is the colour of the help text displayed next to the highlighted element.
The help
element accepts one or more item
or
phase
elements. If you simply want to highlight items one at a time, add item
elements
directly in the help
. Using phase
elements is useful if you want to execute specific
actions or display several items at the same time.
The phase
element accepts the following attributes:
element
(optional, default: none) is the selector of the item to highlight when this phase starts. You can choose any element from the list of predefined selectors described in the section called “Element Selectors”.
param
(optional, default: none) is an optional parameter which you can pass to certain selectors. This parameter is generally used when you specify to highlight a specific chart, metric or artefact as opposed to the first element available. You can read more about the selectors that support parameters in the section called “Element Selectors”.
type
(optional, default: SEQUENTIAL) allows specifying the display behaviour of the child items of this phase. The supported values are:
SEQUENTIAL to highlight items one at a time
PARALLEL to highlight all items in this phase at the same time
PROGRESSIVE to highlight items in succession, retaining the previous highlight at each click
FREE to allow users to perform actions inside the highlighted item
optional
(optional, default: false) allows to skip the
phase automatically if the items or elements it uses are not available for the current user. You can for example create a
tutorial that includes information about the Capitalisation Base that will only be shown to users who can actually use
the Capitalisation Base.
The item
element accepts the following attributes:
element
(mandatory) is the selector of the item to highlight. You can choose any element from the list of predefined selectors described in the section called “Element Selectors”.
param
(optional, default: none) is an optional parameter which you can pass to certain selectors. This parameter is generally used when you specify to highlight a specific chart, metric or artefact as opposed to the first element available. You can read more about the selectors that support parameters in the section called “Element Selectors”.
descrId
(mandatory) is the ID of the help text to display for the highlighted element. Use this ID is used in your properties file to localise the tutorial.
linkId
(optional, default: none) allows creating a link to another tutorial. The value must be the name
of another tutorial defined in the same bundle. You can specify several links by separating them with a /.
You can use a preAction
element in a phase if you want to carry out an action before highlighting
a specific item. The preAction
element supports the following attributes:
action
(mandatory) is the action to perform. The supported actions are:
EXPAND_PORTFOLIO_TREE expands the Project Portfolios down to project level. This action accepts a project name as a parameter, otherwise it uses the first project available.
COLLAPSE_PORTFOLIO_TREE collapses the entire Project Portfolios
SELECT_MODEL selects a model in the Project Portfolios. This action accepts a model name as a parameter, otherwise it uses the first model available.
SELECT_PROJECT expands a project node in the Project Portfolios to show its list of versions and select the most recent one. This action accepts a project name and version as a parameter (e.g.: Earth/V6), otherwise it uses the first project available.
EXPAND_ARTEFACT_TREE expands the Artefact Tree. This action accepts the path to an artefact as a parameter (e.g.: Earth/apps/machine.c), otherwise it uses the first artefact available.
COLLAPSE_ARTEFACT_TREE collapses the entire Artefact Tree.
SELECT_ARTEFACT clicks an artefact in the Artefact Tree to show its dashboard
SELECT_ARTEFACT_LEAF clicks the first lowest-level artefact leaf in the Artefact Tree.
EXPAND_MEASURE_TREE expands the Indicator Tree. This action accepts the path to a metric as a parameter (e.g.: Maintainability/Analysability/Function Analysability), otherwise it uses the first available measure in the tree.
COLLAPSE_MEASURE_TREE collapses the entire Indicator Tree.
SELECT_WIZARD picks a wizard from the list of wizards available in the first step of the project wizard. This action requires a wizardId (e.g.: RISK) as a parameter.
RUN_PROJECT_CREATION clicks the Run button on the summary screen of the project wizard.
param
(optional, default: none) is an optional parameter you can pass to an action if it supports it.
clickIndicator
(optional, default: varies according to the action) allows showing or hiding the click indicator when the action is performed. This attribute supports the values TRUE and FALSE.
It is generally not necessary to specify any preAction
, since each element selector automatically places
the web interface in the right context to highlight the specified item. For example, if you specify that a tutorial should highlight the Findings
tab, the tutorial will open the Explorer and switch to the Findings tab automatically for the first project available. It is only necessary to use a
preAction
if you want a specific project or model to be selected before showing the Findings tab.
The table below lists the selectors that you can use in the
item
or phase
elements of your tutorials. when
a parameter is allowed, it is specified. If no parameter is specified, the first available item is usually
highlighted.
Table 13.1. Available element selectors for tutorials in Squore
| element | param | Highlighted Element |
|---|---|---|
| CUSTOM | The JQuery selector of the element of the Squore UI you want to highlight | - |
| BODY | - | the part of the window containing the Squore UI |
| TOP | - | the entire window |
| BREADCRUMBS | - | the breadcrumbs bar |
| MENU_BAR | - | the menu bar |
| MENU_BAR_HOME | - | the home button in the menu bar |
| MENU_BAR_EXPLORER | - | the Explorer button in the menu bar |
| MENU_BAR_MY_PROJECTS | - | the Projects button in the menu bar |
| MENU_BAR_MY_FAVOURITES | - | the Favourites button in the menu bar |
| MENU_BAR_CAPITALISE | - | the Capitalisation button in the menu bar |
| MENU_BAR_USER | - | the <username> in the menu bar |
| MENU_MODEL | - | the Models button in the menu bar |
| MENU_ADMIN | - | the Administration button in the menu bar |
| MENU_HELP | - | the ? in the menu bar |
| HOME_PAGE | - | the home page |
| HOME_WELCOME | - | the welcome text on the home page |
| HOME_USER | - | the user details section of the home page |
| HOME_WORK | - | the list of tasks available to users on the home page |
| HOME_HELP | - | the help section of the home page |
| HOME_PINNED | - | the list of pinned artefacts on the home page |
| HOME_HISTORY | - | the list of recently visited projects on the home page |
| HOME_EXPLORER | - | the link to the Explorer on the home page |
| HOME_PROJECTS | - | the link to Projects on the home page |
| HOME_CAPITALISE | - | the link to the Capitalisation on the home page |
| SUB_MENU_MODEL | - | the entire Models menu |
| SUB_MENU_MODEL_ROW | a row ID | the specified option in the Models menu |
| SUB_MENU_MODEL_ROW_FIRST | - | the first option in the Models menu |
| SUB_MENU_ADMIN | - | the entire Administration menu |
| SUB_MENU_ADMIN_ROW | a row ID | the specified option in the Administration menu |
| SUB_MENU_ADMIN_ROW_FIRST | - | the first option in the Administration menu |
| SUB_MENU_HELP | - | the entire Help menu |
| SUB_MENU_HELP_ROW | a row ID | the specified option in the Help menu |
| SUB_MENU_HELP_ROW_FIRST | - | the first option available in the Help menu |
| TUTORIAL_POPUP | - | the tutorial selection popup |
| TUTORIAL_POPUP_MODEL | a model ID | the tutorials for the specified model in the tutorial selection popup |
| TUTORIAL_POPUP_MODEL_FIRST | - | the first model-specific tutorial available in the tutorial selection popup |
| TUTORIAL_POPUP_TUTORIAL_NAME | a tutorial's id | the specified tutorial |
| TUTORIAL_POPUP_TUTORIAL_NAME_FIRST | - | the name of the first available tutorial in the tutorial selection popup |
| TUTORIAL_POPUP_TUTORIAL_DESCR | a tutorial's id | the description of the specified tutorial |
| TUTORIAL_POPUP_TUTORIAL_DESCR_FIRST | - | the description of the first available tutorial in the tutorial selection popup |
| EXPLORER | - | the Explorer |
| DRILLDOWN | - | the drilldown pane of the Explorer |
| EXPLORER_TAB | - | the right-hand panel of the Explorer |
| PORTFOLIO_TREE | - | the Project Portfolios |
| ARTEFACT_TREE | - | the Artefact Tree |
| MEASURE_TREE | - | the Indicator Tree |
| EXPLORER_HEADER | - | the Explorer tabs |
| PORTFOLIO_HEADER | - | the Project Portfolios tabs |
| ARTEFACT_TREE_SEARCH | - | the search box in the Artefact Tree |
| ARTEFACT_TREE_FILTER | - | the filter button in the Artefact Tree |
| REVIEW_SET | - | the Review Set |
| PORTFOLIO_TREE_PROJECT | a project name (Earth) or name and version (Earth/V3) | a project and its list of versions in the Project Portfolios |
| PORTFOLIO_TREE_PROJECT_FIRST | - | the first project in the Project Portfolios and its versions |
| MODEL_DASHBOARD | a model ID | the dashboard for the specified model |
| MODEL_CHARTS | a model ID | the charts section of the dashboard for specified model |
| MODEL_CHART_FIRST | a model ID | the first chart in the dashboard of the specified model |
| MODEL_TABLE | a model ID | the table section of the dashboard for the specified model |
| MODEL_TABLE_ROW_FIRST | a model ID | the first table row in the dashboard of the specified model |
| MODEL_CHART | a chart ID | the specified chart in the dashboard for the specified model |
| MODEL_TABLE_ROW | a project name (Earth) or name and version (Earth/V3) | the specified project in the dashboard for the specified model |
| MODEL_CHART_POPUP | a chart ID | the chart viewer with the specified model-level chart |
| MODEL_CHART_POPUP_GRAPH | a chart ID | The chart in the chart viewer |
| MODEL_CHART_POPUP_PREVIOUS_ARROW | a chart ID | the previous arrow in the chart viewer |
| MODEL_CHART_POPUP_NEXT_ARROW | a chart ID | the next arrow in the chart viewer |
| MODEL_CHART_POPUP_NAV_BAR | a chart ID | the carousel in the chart viewer |
| MODEL_CHART_POPUP_ASIDE | a chart ID | the right-hand panel of the chart viewer |
| MODEL_CHART_POPUP_ASIDE_HEAD | a chart ID | the tabs in the right hand panel of the chart viewer |
| MODEL_CHART_POPUP_DESCR | a chart ID | the description panel of the chart viewer |
| FILTER_POPUP | a project name (Earth) or name and version (Earth/V3) | the filter popup |
| FILTER_LEVEL | a project name (Earth) or name and version (Earth/V3) | the levels section of the filter popup |
| FILTER_TYPE | a project name (Earth) or name and version (Earth/V3) | the types section fo the filter popup |
| FILTER_EVOLUTION | a project name (Earth) or name and version (Earth/V3) | the evolution section of the filter popup |
| FILTER_STATUS | a project name (Earth) or name and version (Earth/V3) | the status section of the filter popup |
| ARTEFACT_TREE_LEAF | a project name (Earth) or name and version (Earth/V3) | a lowest-level artefact of a project int he artefact_tree; |
| MEASURE_TREE_LEAF | a project name (Earth) or name and version (Earth/V3) | a lowest-level metric in the Indicator Tree |
| DASHBOARD | a project name (Earth) or name and version (Earth/V3) | the dashboard for a project |
| SCORECARD | a project name (Earth) or name and version (Earth/V3) | the scorecard |
| KPI | a project name (Earth) or name and version (Earth/V3) | the KPI chart in the scorecard |
| CHARTS | a project name (Earth) or name and version (Earth/V3) | the charts section of the dashboard |
| TABLES | a project name (Earth) or name and version (Earth/V3) | the tables in the scorecard |
| CHART_FIRST | a project name (Earth) or name and version (Earth/V3) | the first chart in the dashboard |
| LINE | a project name (Earth) or name and version (Earth/V3) | a line in a table |
| CHART | a chart ID | the specified chart |
| CHART_FIRST | - | the first chart in the dashboard |
| TABLE | a table ID | a table in the scorecard |
| TABLE_FIRST | - | the first table in the scorecard |
| MEASURE_POPUP | a measure, indicator or info ID | the information popup for a metric |
| MEASURE_POPUP_CONTENT | a measure, indicator or info ID | the contents of the information popup for the metric |
| MEASURE_POPUP_LEVELS | a measure, indicator or info ID | the scale for the metric in the information popup |
| MEASURE_POPUP_ROW_FIRST | a measure, indicator or info ID | the first row in the information popup |
| MEASURE_POPUP_ROW | a row ID in the information popup | the specified row in the information popup |
| CHART_POPUP | a chart ID | the chart viewer |
| CHART_POPUP_GRAPH | a chart ID | the chart in the chart viewer |
| CHART_POPUP_COMPARE_OPTION | a chart ID | the compare mode button |
| CHART_POPUP_PREVIOUS_ARROW | a chart ID | the previous arrow in the chart viewer |
| CHART_POPUP_NEXT_ARROW | a chart ID | the next arrow in the chart viewer |
| CHART_POPUP_NAV_BAR | a chart ID | the carousel in the chart viewer |
| CHART_POPUP_ASIDE | a chart ID | the right-hand panel of the chart viewer |
| CHART_POPUP_ASIDE_HEAD | a chart ID | the tabs in the right hand panel of the chart viewer |
| CHART_POPUP_DESCR | a chart ID | the description panel of the chart viewer |
| CHART_POPUP_COMMENTS | a chart ID | the comments panel of the thart viewer |
| CHART_POPUP_FAVORITES | a chart ID | the favourites panel of the chart viewer |
| CHART_POPUP_COMPARATIVE_CHART | a version name | the older version of the chart in the chat viewer in compare mode |
| ACTION_ITEMS | a project name (Earth) or name and version (Earth/V3) | the Action Items tab of the Explorer |
| ACTION_ITEMS_TABLE | a project name (Earth) or name and version (Earth/V3) | the Action Items table |
| ACTION_ITEMS_TABLE_HEAD | a project name (Earth) or name and version (Earth/V3) | the Action Items table header |
| ACTION_ITEMS_TABLE_HEAD_CHECK | a project name (Earth) or name and version (Earth/V3) | the Action Items Select All checkbox |
| ACTION_ITEMS_ADD_REVIEW_SET | a project name (Earth) or name and version (Earth/V3) | the Action Items Add to review set button |
| ACTION_ITEMS_EXPORT_LIST | a project name (Earth) or name and version (Earth/V3) | the Action Items export formats |
| ACTION_ITEMS_EXPORT_BUTTON | a project name (Earth) or name and version (Earth/V3) | the Action Items export button |
| ACTION_ITEMS_SEARCH | a project name (Earth) or name and version (Earth/V3) | the Action Items filtering options |
| ACTION_ITEMS_ROW | a project name (Earth) or name and version (Earth/V3) | a single action item |
| ACTION_ITEMS_REASON | a project name (Earth) or name and version (Earth/V3) | a detailed action item |
| ACTION_ITEMS_ADVANCED_SEARCH | a project name (Earth) or name and version (Earth/V3) | the Action Items advanced filtering options |
| ACTION_ITEMS_ADVANCED_SEARCH_SELECT_FIRST | a project name (Earth) or name and version (Earth/V3) | the Action Items advanced filtering options with a selection applied |
| ACTION_ITEMS_ADVANCED_SEARCH_SELECT | The name of a list of the advanced search | the Action Items with the specified selection applied |
| HIGHLIGHTS | a project name (Earth) or name and version (Earth/V3) | the Highlights tab of the Explorer |
| HIGHLIGHTS_TABLE | a project name (Earth) or name and version (Earth/V3) | the Highlights table |
| HIGHLIGHTS_TABLE_HEAD | a project name (Earth) or name and version (Earth/V3) | the Highlights table header |
| HIGHLIGHTS_TABLE_HEAD_CHECK | a project name (Earth) or name and version (Earth/V3) | the Highlights table Select All checkbox |
| HIGHLIGHTS_SEARCH | a project name (Earth) or name and version (Earth/V3) | the Highlights options |
| HIGHLIGHTS_SEARCH_FILTER | a project name (Earth) or name and version (Earth/V3) | the Highlights categories list |
| HIGHLIGHTS_SEARCH_TYPE | a project name (Earth) or name and version (Earth/V3) | the Highlights artefact type list |
| HIGHLIGHTS_EXPORT_BUTTON | a project name (Earth) or name and version (Earth/V3) | the Highlights export button |
| HIGHLIGHTS_ADD_REVIEW_SET | a project name (Earth) or name and version (Earth/V3) | the Highlights Add to review set button |
| HIGHLIGHTS_ROW_FIRST | a project name (Earth) or name and version (Earth/V3) | the first row of Highlights in the table |
| FINDINGS | a project name (Earth) or name and version (Earth/V3) | the Findings tab of the Explorer |
| FINDINGS_TABLE | a project name (Earth) or name and version (Earth/V3) | the Findings table |
| FINDINGS_TABLE_HEAD | a project name (Earth) or name and version (Earth/V3) | the Findings table header |
| FINDINGS_SEARCH | a project name (Earth) or name and version (Earth/V3) | the Findings filtering controls |
| FINDINGS_RULE | a project name (Earth) or name and version (Earth/V3) | the Findings table |
| FINDINGS_ARTEFACT | a project name (Earth) or name and version (Earth/V3) | artefacts in the Findings table |
| FINDINGS_ROW_FIRST | a project name (Earth) or name and version (Earth/V3) | the first row in the Findings table |
| FINDINGS_ADVANCED_SEARCH | a project name (Earth) or name and version (Earth/V3) | advanced filtering options in the Findings table |
| FINDINGS_ADVANCED_SEARCH_SELECT_FIRST | a project name (Earth) or name and version (Earth/V3) | a selection in the advanced filtering options in the Findings table |
| FINDINGS_ADVANCED_SEARCH_SELECT | The name of a list of the advanced search | a selection in the advanced filtering options in the Findings table |
| REPORTS | a project name (Earth) or name and version (Earth/V3) | the Reports tab of the Explorer |
| REPORTS_REGION | a project name (Earth) or name and version (Earth/V3) | the Reports section |
| REPORTS_OPTIONS | a project name (Earth) or name and version (Earth/V3) | the Reports options |
| REPORTS_OPTION_TEMPLATE | a project name (Earth) or name and version (Earth/V3) | the available report templates |
| REPORTS_OPTION_FORMAT | a project name (Earth) or name and version (Earth/V3) | the available report formats |
| REPORTS_OPTION_SYNTHETIC_VIEW | a project name (Earth) or name and version (Earth/V3) | the synthetic report option |
| REPORTS_CREATE | a project name (Earth) or name and version (Earth/V3) | the Generate button button |
| EXPORT_REGION | a project name (Earth) or name and version (Earth/V3) | the Exports section |
| EXPORT_OPTIONS | a project name (Earth) or name and version (Earth/V3) | the Exports options |
| EXPORT_CREATE | a project name (Earth) or name and version (Earth/V3) | the Exports Create button |
| FORMS | a project name (Earth) or name and version (Earth/V3) | the Forms tab of the Explorer |
| FORMS_ATTRIBUTE | a project name (Earth) or name and version (Earth/V3) | a form attribute name |
| FORMS_ATTRIBUTE_FIELD | a project name (Earth) or name and version (Earth/V3) | a form attribujte value |
| FORMS_ATTRIBUTE_COMMENT | a project name (Earth) or name and version (Earth/V3) | a form attribute justification |
| FORMS_HISTORY | a project name (Earth) or name and version (Earth/V3) | a form value history |
| FORMS_BLOCK | a project name (Earth) or name and version (Earth/V3) | a form block |
| INDICATORS | a project name (Earth) or name and version (Earth/V3) | the Indicators tab of the Explorer |
| INDICATORS_TABLE | a project name (Earth) or name and version (Earth/V3) | the Indicators table |
| INDICATORS_TABLE_HEAD | a project name (Earth) or name and version (Earth/V3) | the Indicators table header |
| INDICATORS_ROW | a project name (Earth) or name and version (Earth/V3) | a row in the Indicators table |
| MEASURES | a project name (Earth) or name and version (Earth/V3) | the Measures tab of the Explorer |
| MEASURES_TABLE | a project name (Earth) or name and version (Earth/V3) | the Measures table |
| MEASURES_TABLE_HEAD | a project name (Earth) or name and version (Earth/V3) | the Measures table header |
| MEASURES_ROW | a project name (Earth) or name and version (Earth/V3) | a row in the Measures table |
| COMMENTS | a project name (Earth) or name and version (Earth/V3) | the Comments tab of the Explorer |
| COMMENTS_TABLE | a project name (Earth) or name and version (Earth/V3) | the Comments table |
| COMMENTS_TABLE_HEAD | a project name (Earth) or name and version (Earth/V3) | the Comments table header |
| COMMENTS_ROW | a project name (Earth) or name and version (Earth/V3) | a row in the Comments header |
| CREATE_PROJECT_BUTTON | - | the Create Project button on the Projects page |
| WIZARD_PANEL | - | the list of wizards in the project creation wizard |
| WIZARD_ROW | a wizard ID | a wizard in the list of wizards in wizards in the project creation wizard |
| WIZARD_ROW_FIRST | - | the first wizard in the list of wizards in the project creation wizard |
| WIZARD_NEXT_BUTTON | - | the Next button on the first page of the project creation wizard |
| GENERAL_INFORMATION | - | the General Information section of the project creation wizard |
| PROJECT_IDENTIFICATION_BLOCK | - | the Project Identification section of the project creation wizard |
| GENERAL_INFO_BLOCK | - | the General Information section of the project creation wizard |
| GENERAL_INFO_ROW | - | a row in the General Information section of the project creation wizard |
| PROJECT_NEXT_BUTTON | - | the Next button on the second page of the project creation wizard |
| DP_PANEL | - | the Data Provider panel in the project creation wizard |
| DP_PANEL_BLOCK | - | the Data Provider panel block in the project creation wizard |
| DP_PANEL_ROW | - | a row in the Data Provider panel block in the project creation wizard |
| DP_PANEL_NEXT_BUTTON | - | the next button on the Data Provider page of the project creation wizard |
| CONFIRMATION_PANEL | - | the summary page of the project creation wizard |
| SUMMARY | - | the summary of parameters specified on the summary page of the project creation wizard |
| CONFIRMATION_PANEL_PARAMETERS | - | the project parameters in command line form |
| RUN_NEW_PROJECT_BUTTON | - | the Run button on the summary page of the project creation wizard |
If you do not find the selector for the element you want to highlight, you can use CUSTOM with your own JQuery selector as a parameter. You can use your browser's developer tools to inspect the web interface and extract the XPath of the element.
Advanced users can also expand on the list of available selectors, by overriding the default
list of selectors available in <SQUORE_HOME>/configuration/tutorials/aliasTuto.xml: Copy the file and place
it in the same relative location in your own configuration folder. You cannot create new actions,
but if an action exists for what you want to do, you can add your selector following the syntax:
<alias name="SELECTOR_ID" path="[JQuery selector with escaped ':' and '.']"/>
Table of Contents
Some configuration options are also available to tweak the Squore user interface.
These options need to be specified in a file called properties.xml located at
the root of your Configuration folder, or in various other Bundle.xml files.
This chapter describes these options and their effect on the user interface.
You can find the XML schema for properties.xml in properties-1.2.xsd.
By default, the Explorer shows the following tabs for all users:

The default set of tabs in the Explorer, the tab displayed by default is the Dashboard tab.
Users can change the displayed tabs by clicking the Tab Manager icon right of the last tab. You can also define the
available tabs and their default state (shown, hidden, default) by editing properties.xml as shown below:
<!-- Active tabs --> <explorerTabs> <tab name="dashboard" default="true"/> <tab name="action-items" mandatory="true"/> <tab name="highlights"/> <tab name="findings"/> <tab name="reports" rendered="false"/> <tab name="attributes"/> <tab name="indicators" rendered="false"/> <tab name="measures" rendered="false"/> <tab name="annotations"/> </explorerTabs>
Each tab
element accepts the following parameters:
name
(mandatory) identifies the tab of the Explorer by name. The supported values are:
dashboard
action-items
highlights
findings
reports
attributes
indicators
measures
annotations
mandatory
(optional, default: false) removes the option to hide the tab from the web UI for all users.
default
(optional, default: false) makes the tab the default tab in Squore. Every link to a project or artefact that does not specifically request a target tab will open the Explorer with this tab active by default. Note that when set to true, the tab is automatically mandatory as well.
rendered
(optional, default: true) specifies whether the tab is shown (true) or hidden (false) by default. Hidden tabs can be shown by checking a box in the Tab Manager. Note that the value of this attribute is ignored if either default
or mandatory
is set to true.
You can use the help
option to add links that will appear in the Help menu in Squore
(? in the main toolbar), as shown below.
<?xml version="1.0" encoding="utf-8" standalone="yes"?> <Bundle> <!-- Customise the help links that appear in the right menu --> <help label="OWASP 25" url="http://cwe.mitre.org/top25/" /> <help label="JBoss Wiki" url="http://www.jboss.org/jbosswiki" profiles="ADMINISTRATOR;" /> </Bundle>
The help
element accepts the following attributes:
A customised Help menu for a user with the ADMINISTRATOR profile.
If you wish to hide some of the models available in Squore, you can use the hideModel
option to prevent some folders under the models folder in the configuration from being read by
Squore, as shown below.
<?xml version="1.0" encoding="utf-8" standalone="yes"?> <Bundle> <!-- Hidden models --> <hideModel name="ISO9126_Maintainability_Xaml" /> </Bundle>
By default, Squore displays all versions of a project created with an earlier version of your model in orange.
The hideObsoleteModels
option allows disabling this behaviour, so that there is no warning
displayed for versions analysed with a different model.
<?xml version="1.0" encoding="utf-8" standalone="yes"?> <Bundle> <!-- Ignore model obsolescence (do not highlight versions analysed with an obsolete model) default=false --> <hideObsoleteModels value="true" /> </Bundle>
If it does not makes sense to display a specific measure in the Indicator Tree or the Model Viewer, you can hide it by editing the Properties bundle of a model. This is useful to remove confusion about how a measure is computed.
In order to hide a measure:
Edit the model's Properties/Bundle.xml.
Add a <hideMeasure targetArtefactTypes="" path="" > element.
Fill in the artefact types for which this measure is hidden (this is optional).
Specify the complete path of the measure to be hidden.
Below is an example of two hidden paths. The first one is only hidden at application level. The second one is always hidden.
configuration/models/[ModelFolder]/Properties/Bundle.xml:
<Bundle> <!-- Hidden measures --> <hideMeasure targetArtefactTypes="APPLICATION" path="I.MAINTAINABILITY/I.ANALYSABILITY/I.FUANA_IDX" /> <hideMeasure path="I.MAINTAINABILITY/I.CHANGEABILITY/I.ROKR_CHAN/D.RKO_CHAN" /> </Bundle>
Note that you should always use the precise notation path elements, with the I., B. or D. to avoid ambiguities.
Using the Properties bundle, you can define the list of categories available for edition in the Analysis Model Editor. By default,
all categories can be edited, but the rulesEdition
element allows you to explicitly limit the list to specific categories.
configuration/models/[ModelFolder]/Properties/Bundle.xml:
<Bundle> <!-- Restrict Analysis Model Editor categories to the list below --> <rulesEdition scales="CUSTOMER_SEVERITY;CUSTOMER_REMEDIATION;SCALE_SCHEDULE" /> </Bundle>
The rulesEdition
element takes a scale
attribute that acceps a semicolon-separated list
of scales to display for each rule in the Analysis Model Editor for this model.
You can define for each model the order that is used to sort items in the Action Items and Findings pages.
This is done by defining one or more scales and adding them to the Properties/Bundle.xml file using the
findingsTab
and actionItemsTab
options, as shown below:
configuration/models/[ModelFolder]/Properties/Bundle.xml: <Bundle> <!-- sort order for columns --> <findingsTab orderBy="SCALE_PRIORITY;SCALE_SEVERITY" /> <actionItemsTab orderBy="SCALE_REMEDIATION;SCALE_SEVERITY" /> </Bundle>
You can define for each model the columns that should be hidden in the Action Items and Findings pages.
This is done by defining one or more scales and adding them to the Properties/Bundle.xml file using the
findingsTab
and actionItemsTab
options, as shown below:
configuration/models/[ModelFolder]/Properties/Bundle.xml: <Bundle> <!-- sort order for columns --> <findingsTab hideColumns="SCALE_PRIORITY;SCALE_SEVERITY" /> <actionItemsTab hideColumns="SCALE_REMEDIATION;SCALE_SEVERITY" /> </Bundle>
On the Findings tab, you can also hide the Characteristics column with the hideCharacteristicsFilter
attribute:
configuration/models/[ModelFolder]/Properties/Bundle.xml: <Bundle> <!-- hide characteristics column (list of families) --> <findingsTab hideCharacteristicsFilter="true" /> </Bundle>
Squore uses a menus folder in its configuration so you can add functionality that will
be available in the user interface to run external tools. These external scripts are launched in Squore Server's context, and can
therefore benefit from Squore's authentication and permission mechanism. They are launched from the web interface via a Tools menu visible to the users whose profile grants access to the Use External Tools feature.
Each external tool is defined within its own sub-folder in menus and appears as a link in
the main Squore toolbar, as shown below:
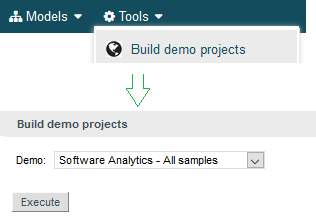
A Tools menu containing an external tool to create a demo environment, and the associated page to configure and launch the script.
The menu in the image above was added using a form.xml and form_en.properties files.
Clicking the Execute button passes the user selections to a script called execute.tcl.
<SQUORE_HOME>/configuration/menus/CreateDemo/form.xml
<?xml version="1.0" encoding="UTF-8"?> <tags baseName="Generic" multiUsers="true" users="demo" groups="demo" image="earth.png"> <tag type="multipleChoice" key="demo" displayType="comboBox" defaultValue="ANALYTICS"> <value key="ANALYTICS" /> <value key="ANALYTICS_C" /> <value key="ANALYTICS_MILESTONES" /> <value key="ANALYTICS_JAVA" /> </tag> <tag type="multipleChoice" key="useAccountCredentials" displayType="radioButton" defaultValue="USE_ACCOUNT_CREDENTIALS" credentialType="USE_ACCOUNT_CREDENTIALS" hide="true"> <value key="NO_CREDENTIALS" /> <value key="USE_ACCOUNT_CREDENTIALS" /> <value key="PERSONAL_CREDENTIALS" /> </tag> <tag type="text" key="username" credentialType="LOGIN" hide="true"/> <tag type="password" key="password" credentialType="PASSWORD" hide="true"/> </tags>
<SQUORE_HOME>/configuration/menus/CreateDemo/form_en.properties
FORM.GENERAL.NAME=Build demo projects FORM.GENERAL.DESCR=Menu to create sample projects for demo purposes. FORM.GENERAL.URL=http://www.squoring.com/ TAG.demo.NAME=Demo: OPT.ANALYTICS.NAME=Software Analytics - All samples OPT.ANALYTICS_C.NAME=Software Analytics - C samples OPT.ANALYTICS_MILESTONES.NAME=Software Analytics - Milestones demo OPT.ANALYTICS_JAVA.NAME=Software Analytics - Java samples
<SQUORE_HOME>/configuration/menus/CreateDemo/execute.tcl
set demo [set ${::toolName}::demo]
set csv [file join [file dirname [info script]] csv]
set today [clock seconds]
proc clock_add {num} {
set days [expr {3600 * 24}]
return [clock format [expr {$::today + ($num * $days)}] -format {%Y-%m-%d}]
}
if {[string equal $demo ANALYTICS] || [string equal $demo ANALYTICS_C]} {
# Earth
create_project --group "C" --teamUser=$user,PROJECT_MANAGER\;$user,QUALITY_ENGINEER\;$user,TESTER\;$user,DEVELOPER --name=Earth --version=V1 "--versionDate=[clock_add -228]T01:00:00" --wizardId=ANALYTICS --color=rgb(130,196,240) -d type=CPPCheck,xml=$squore_home/samples/c/Earth/V1/cppcheck.xml -r type=FROMPATH,path=$squore_home/samples/c/Earth/V1
# ...
}
if {[string equal $demo ANALYTICS] || [string equal $demo ANALYTICS_C] || [string equal $demo ANALYTICS_MILESTONES]} {
# Test Milestone
set project_name Sun
create_project --group "C" --name=$project_name --version=V1 "--versionDate=[clock_add -148]T01:00:00" --teamUser=$user,PROJECT_MANAGER\;$user,QUALITY_ENGINEER\;$user,TESTER\;$user,DEVELOPER \
-M "id=SPRINT1,date=[clock_add -148]T02:00:00,D.TECH_DEBT=1000.0,D.ROKR_SUBSET=50%,D.ISSUE_BLOCKER=10,D.ISSUE_CRITICAL=15,D.ISSUE_MAJOR=20,D.SDESCR=0%"
--wizardId=ANALYTICS --color=rgb(130,196,240) -d type=CPPCheck,xml=$squore_home/samples/c/Earth/V6/cppcheck.xml -r type=FROMPATH,path=$squore_home/samples/c/Earth/V6
# ...
}
if {[string equal $demo ANALYTICS] || [string equal $demo ANALYTICS_JAVA]} {
# JAVA
create_project --group "Java" --teamUser=$user,PROJECT_MANAGER\;$user,QUALITY_ENGINEER\;$user,TESTER\;$user,DEVELOPER --name=Freemind --version=0.9.0 "--versionDate=[clock_add -47]T01:00:00" --wizardId=ANALYTICS --color=rgb(130,196,240) -d type=CheckStyle,xml=$squore_home/samples/java/Freemind/0.9.0/checkstyle.xml -d type=PMD,xml=$squore_home/samples/java/Freemind/0.9.0/pmd.xml -r type=FROMPATH,path=$squore_home/samples/java/Freemind/0.9.0
# ...
}The forms
element accepts the following attributes:
baseName
(mandatory) is the name of folder in Squore's addons folder that contains the executable tcl script. Set the value to Generic in order to
extend the generic framework that allows you to simply create users and projects.
formatLog
(optional, default: true) provides the options to turn off console log colourisation
task
(optional, default: false) displays a link to this tool on the home page in the Tasks section when set to true
multiUsers
(optional, default: false) defines whether only one running instance of the tool is allowed per user (true) or whether only one running instance at a time is allowed for the entire Squore Server (false).
users
(optional, default: empty): a semicolon-separated list of user logins. If specified, this
attribute limits the availability of the menu to the users explicitly listed.
groups
(optional, default: empty): a semicolon-separated list of user groups. If specified, this
attribute limits the availability of the menu to users belonging to the groups explicitly listed.
image
(optional, default: empty) takes the path to an icon that is displayed next to the tool's name in the web interface
You can then add a series of tag
elements that follow the same specification as the one described in the section called “Attributes” to use as parameters on your custom page, with two extra types available:
decoration allows you to display an image followed by some text:
<tag type="decoration" image="custom-logo.png" style="width:500px">This is the text that will be displayed next to the image.</tag>
file allows you choose a file to upload to the server:
<tag type="file" changeable="true" name="Upload this file: " key="file" defaultValue="" acceptedTypes="xls,xlsx"/>
The file is immediately uploaded on the server, and the TCL variable matching the specified key ($file
in the example above) is set to the absolute path of the uploaded file.
Consider the security implications of letting users upload arbitrary files to the server running Squore before using the file upload functionality.
Each tag
element accepts the attribute
required
(optional, default value: false), which allows marking the field as required and displays a red asterisk next to the field label.
The required
attribute is also valid in the form.xml files
you create for your custom Data Providers and Repository Connectors.
The following variables are injected in the script execute.tcl before execution:
outputDir: The directory associated with the menu.
tmpDir: The temporary directory associated with the menu
toolName: The name of the directory of the menu
toolBaseName: The name of the directory of the addons part of the menu
toolDir: The directory where the addons part of the menu can be found
toolkitDir: The directory where the Squore toolkit tcl scripts can be found
logFile: The name of the log file to use for displaying information
External Tools allow using several functions like create_project, which are covered in more details in Appendix C, External Tools Reference.
In models that integrate requirements, test cases or change requests as artefacts, it may be necessary to provide a link to view an artefact in the context of the application where it was created. This can be done in Squore by configuring the View Source chart in the Dashboard to open links in an external applications. This section shows how you can configure external links using Jira as the target application.
Our model collects Jira issues and shows a minimal dashboard or the issue's status, assignee, priority, summary and description, as shown below:
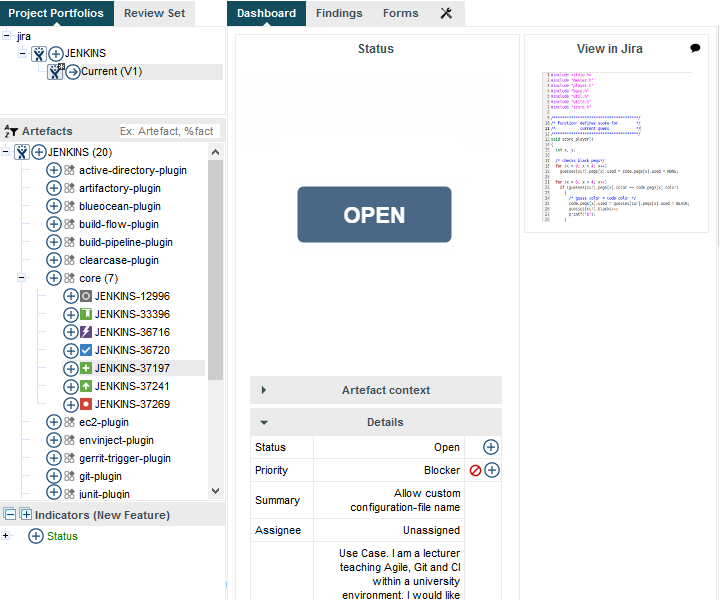
The dashboard of a Jira issue in the Jenkins project
The Jira issue shown above is an artefact of type NEW_FEATURE. In order to
make the View Source chart open the Jira issue in a browser, you simply need to create
a properties file in the sources folder of your configuration, whose name is the artefact type in
lower case.
<my_configuration_folder>/sources/new_feature.properties:
type=url
pattern=https://issues.jenkins-ci.org/browse/{0}
pattern.finding=https://issues.jenkins-ci.org/browse/{0}/activity?from={1}
p0=INFO(ISSUE_ID)
p1=INFO(ASSIGNEE)The syntax of this properties file is as follows:
type is the type of link to create. Only url is currently supported.
pattern is the URL pattern used to generate a link for the View Source chart in the Dashboard. You are free to insert parameters in the URL as needed, as long as you declare them in the properties file.
pattern.findings is the URL pattern used to generate a link for artefacts on the Findings tab. This pattern also supports parameters.
p0, p1... pn are parameters that accept a computation that will return a string for the artefact. In the example above, ISSUE_ID and ASSIGNEE are two text metrics that exist for the NEW_FEATURE artefact type.
You can use the following computations:
INFO(measureId) to retrieve textual information from the current artefact
ARTEFACT_LOCATION() to retrieve the current artefact path
FINDING_LOCATION() to retrieve the precise location of the finding in the current artefact
Table of Contents
The following Data Provider frameworks support importing all kinds of data into Squore. Whether you choose one or the other depends on the ability of your script or executable to produce CSV or XML data. Note that these frameworks are recommended over the legacy frameworks described in the section called “Legacy Frameworks”, which are deprecated as of Squore 18.0.18.
==============
= csv_import =
==============
The csv_import framework allows you to create Data Providers that produce CSV files that the framework will translate into XML files that can be imported in your analysts results. This framework is useful if writing XML files directly from your script is not practical.
Using csv_import, you can import metrics, findings (including relaxed findings), textual information, and links between artefacts (including to and from source code artefacts).
This framework replaces all the legacy frameworks that wrote CSV files in previous versions.
Note that this framework can be called by your Data Provider simply by creating an exec-tool phase that calls the part of the framework located in the configuration folder:
<exec-tool name="csv_import">
<param key="csv" value="${getOutputFile(output.csv)}" />
<param key="separator" value=";" />
<param key="delimiter" value=""" />
</exec-tool>
For a full description of all the parameters that can be used, consult the section called "CSV Import" in the "Data Providers" chapter of this manual.
============================================
= CSV format expected by the data provider =
============================================
- Line to define an artefact (like a parent artefact for instance):
Artefact
- Line to add n metrics to an artefact:
Artefact;(MetricId;Value)*
- Line to add n infos to an artefact:
Artefact;(InfoId;Value)*
- Line to add a key to an artefact:
Artefact;Value
- Line to add a finding to an artefact:
Artefact;RuleId;Message;Location
- Line to add a relaxed finding to an artefact:
Artefact;RuleId;Message;Location;RelaxStatus;RelaxMessage
- Line to add a link between artefacts:
Artefact;LinkId;Artefact
where:
- MetricId is the id of the metric as declared in the Analysis Model
- InfoId is the id of the information to import
- Value is the value of the metric or the information or the key to import (a key is a UUID used to reference an artefact)
- RuleId is the id of the rule violated as declared in the Analysis Model
- Message is the message of the finding, which is displayed after the rule description
- Location is the location of the finding (a line number for findings attached source code artefacts, a url for findings attached to any other kind of artefact)
- RelaxStatus is one of DEROGATION, FALSE_POSITIVE or LEGACY and defines the relaxation stat of the imported finding
- RelaxMessage is the justification message for the relaxation state of the finding
- LinkId is the id of the link to create between artefacts, as declared in the Analysis Model
==========================
= Manipulating Artefacts =
==========================
The following functions are available to locate and manipulate source code artefacts in the project:
- ${artefact(type,path)} ==> Identify an artefact by its type and full path
- ${artefact(type,path,uid)} ==> Identify an artefact by its type and full path and assign it the unique identifier uid
- ${uid(value)} ==> Identify an artefact by its unique identifier (value)
- ${file(path)} ==> Tries to find a source code file matching the "path" in the project
- ${function(fpath,line)} ==> Tries to find a source code function at line "line" in file matching the "fpath" in the project
- ${function(fpath,name)} ==> Tries to find a source code function whose name matches "name" in the file matching the "fpath" in the project
- ${class(fpath,line)} ==> Tries to find a source code class at line "line" in the file matching the "fpath" in the project
- ${class(fpath,name)} ==> Tries to find a source code class whose name matches "name" in the file matching the "fpath" in the project
===============
= Input Files =
===============
The data provider accepts the following files:
Metrics file accepts:
Artefact definition line
Metrics line
Findings file accepts:
Artefact definition line
Findings line
Keys file accepts:
Artefact definition line
Keys line
Information file accepts:
Artefact definition line
Information line
Links file accepts:
Artefact definition line
Links line
It is also possible to mix every kind of line in a single csv file, as long as each line is prefixed with the kind of data it contains.
In this case, the first column must contain one of:
DEFINE (or D): when the line is used to define an artefact
METRIC (or M): to add a metric
INFO (or I): to add an information
KEY (or K): to add a key
FINDING (or F): to add a finding, relaxed or not
LINK (or L): to add link between artefacts
The following is an example of a csv file containing mixed lines:
D;${artefact(CR_FOLDER,/CRsCl)}
M;${artefact(CR,/CRsCl/cr2727,2727)};NB;2
M;${artefact(CR,/CRsCl/cr1010,1010)};NB;4
I;${uid(1010)};NBI;Bad weather
K;${artefact(CR,/CRsCl/cr2727,2727)};#CR2727
I;${artefact(CR,/CRsCl/cr2727,2727)};NBI;Nice Weather
F;${artefact(CR,/CRsCl/cr2727,2727)};BAD;Malformed
M;${uid(2727)};NB_EXT;3
I;${uid(2727)};NBI_EXT;Another Info
F;${uid(2727)};BAD_EXT;Badlyformed
F;${uid(2727)};BAD_EXT1;Badlyformed1;;FALSE_POSITIVE;Everything is in the title]]>
F;${function(machine.c,41)};R_GOTO;"No goto; neither togo;";41
F;${function(machine.c,42)};R_GOTO;No Goto;42;LEGACY;Was done a long time ago
L;${uid(1010)};CR2CR;${uid(2727)}
L;${uid(2727)};CR2CR;${uid(1010)}
=======
= xml =
=======
The xml framework is an implementation of a data provider that allows to import an xml file, potentially after an xsl transformation. The transformed XML file is expected to follow the syntax expected by other data providers (see input-data.xml specification).
This framework can be extended like the other frameworks, by creating a folder for your data provider in your configuration/tools folder and creating a form.xml. Following are three examples of the possible uses of this framework.
Example 1 - User enters an xml path and an xsl path, the xml is transformed using the xsl and then imported
=========
<?xml version="1.0" encoding="UTF-8"?>
<tags baseName="xml">
<tag type="text" key="xml" />
<tag type="text" key="xslt" />
<exec-phase id="add-data">
<exec name="javascript" failOnError="true" failOnStdErr="true">
<arg value="main.js" />
<arg value="--" />
<arg value="${outputDirectory}" />
<arg tag="xml" />
<arg tag="xslt" />
</exec>
</exec-phase>
</tags>
Example 2 - The user enter an xml path, the xsl file is predefined (input-data.xsl) and present in the same directory as form.xml
=========
<?xml version="1.0" encoding="UTF-8"?>
<tags baseName="xml">
<tag type="text" key="xml" />
<exec-phase id="add-data">
<exec name="javascript" failOnError="true" failOnStdErr="true">
<arg value="main.js" />
<arg value="--" />
<arg value="${outputDirectory}" />
<arg tag="xml" />
<arg value="${getToolConfigDir(input-data.xsl)}" />
</exec>
</exec-phase>
</tags>
Example 3 - The user enter an xml path of a file already in the expected format
=========
<?xml version="1.0" encoding="UTF-8"?>
<tags baseName="xml">
<tag type="text" key="xml" />
<exec-phase id="add-data">
<exec name="javascript" failOnError="true" failOnStdErr="true">
<arg value="main.js" />
<arg value="--" />
<arg value="${outputDirectory}" />
<arg tag="xml" />
</exec>
</exec-phase>
</tags>
Legacy Data Provider frameworks and their capabilities
Csv
The Csv framework is used to import metrics or textual information and attach them to artefacts of type Application or File. While parsing one or more input CSV files, if it finds the same metric for the same artefact several times, it will only use the last occurrence of the metric and ignore the previous ones. Note that the type of artefacts you can attach metrics to is limited to Application and File artefacts. If you are working with File artefacts, you can let the Data Provider create the artefacts by itself if they do not exist already. Refer to the full Csv Reference for more information.
csv_findings
The csv_findings framework is used to import findings in a project and attach them to artefacts of type Application, File or Function. It takes a single CSV file as input and is the only framework that allows you to import relaxed findings directly. Refer to the full csv_findings Reference for more information.
CsvPerl
The CsvPerl framework offers the same functionality as Csv, but instead of dealing with the raw input files directly, it allows you to run a perl script to modify them and produce a CSV file with the expected input format for the Csv framework. Refer to the full CsvPerl Reference for more information.
FindingsPerl
The FindingsPerl framework is used to import findings and attach them to existing artefacts. Optionally, if an artefact cannot be found in your project, the finding can be attached to the root node of the project instead. When launching a Data Provider based on the FindingsPerl framework, a perl script is run first. This perl script is used to generate a CSV file with the expected format which will then be parsed by the framework. Refer to the full FindingsPerl Reference for more information.
Generic
The Generic framework is the most flexible Data Provider framework, since it allows attaching metrics, findings, textual information and links to artefacts. If the artefacts do not exist in your project, they will be created automatically. It takes one or more CSV files as input (one per type of information you want to import) and works with any type of artefact. Refer to the full Generic Reference for more information.
GenericPerl
The GenericPerl framework is an extension of the Generic framework that starts by running a perl script in order to generate the metrics, findings, information and links files. It is useful if you have an input file whose format needs to be converted to match the one expected by the Generic framework, or if you need to retrieve and modify information exported from a web service on your network. Refer to the full GenericPerl Reference for more information.
ExcelMetrics
The ExcelMetrics framework is used to extract information from one or more Microsoft Excel files (.xls or .xslx). A detailed configuration file allows defining how the Excel document should be read and what information should be extracted. This framework allows importing metrics, findings and textual information to existing artefacts or artefacts that will be created by the Data Provider. Refer to the full ExcelMetrics Reference for more information.
After you choose the framework to extend, you should follow these steps to make your custom Data Provider known to Squore:
Create a new configuration tools folder to save your work in your
custom configuration folder: MyConfiguration/configuration/tools.
Create a new folder for your data provider inside the new tools
folder: CustomDP. This folder needs to contain the following files:
form.xml defines the input parameters for the Data Provider, and the base framework to use, as described in the section called “Data Provider Parameters”
form_en.properties contains the strings displayed in the web interface for this Data Provider, as described in the section called “Localising your Data Provider”
config.tcl contains the parameters for your custom Data Provider that are specific to the selected framework
CustomDP.pl is the perl script that is executed automatically if your custom Data Provider uses one of the *Perl frameworks.
Edit Squore Server's configuration file to register your new configuration path, as described in the Installation and Administration Guide.
Log into the web interface as a Squore administrator and reload the configuration.
Your new Data Provider is now known to Squore and can be triggered in analyses. Note that you may have to modify your Squore configuration to make your wizard aware of the new Data Provider and your model aware of the new metrics it provides. Refer to the relevant sections of the Configuration Guide for more information.
=======
= Csv =
=======
The Csv framework is used to import metrics or textual information and attach them to artefacts of type Application, File or Function. While parsing one or more input CSV files, if it finds the same metric for the same artefact several times, it will only use the last occurrence of the metric and ignore the previous ones. Note that the type of artefacts you can attach metrics to is limited to Application, File and Function artefacts. If you are working with File artefacts, you can let the Data Provider create the artefacts by itself if they do not exist already.
============
= form.xml =
============
You can customise form.xml to either:
- specify the path to a single CSV file to import
- specify a pattern to import all csv files matching this pattern in a directory
In order to import a single CSV file:
=====================================
<?xml version="1.0" encoding="UTF-8"?>
<tags baseName="Csv" needSources="true">
<tag type="text" key="csv" defaultValue="/path/to/mydata.csv" />
</tags>
Notes:
- The csv key is mandatory.
- Since Csv-based data providers commonly rely on artefacts created by Squan Sources, you can set the needSources attribute to force users to specify at least one repository connector when creating a project.
In order to import all files matching a pattern in a folder:
===========================================================
<?xml version="1.0" encoding="UTF-8"?>
<tags baseName="Csv" needSources="true">
<!-- Root directory containing Csv files to import-->
<tag type="text" key="dir" defaultValue="/path/to/mydata" />
<!-- Pattern that needs to be matched by a file name in order to import it-->
<tag type="text" key="ext" defaultValue="*.csv" />
<!-- search for files in sub-folders -->
<tag type="booleanChoice" defaultValue="true" key="sub" />
</tags>
Notes:
- The dir and ext keys are mandatory
- The sub key is optional (and its value set to false if not specified)
==============
= config.tcl =
==============
Sample config.tcl file:
=======================
# The separator used in the input CSV file
# Usually \t or ;
set Separator "\t"
# The delimiter used in the input CSV file
# This is normally left empty, except when you know that some of the values in the CSV file
# contain the separator itself, for example:
# "A text containing ; the separator";no problem;end
# In this case, you need to set the delimiter to \" in order for the data provider to find 3 values instead of 4.
# To include the delimiter itself in a value, you need to escape it by duplicating it, for example:
# "A text containing "" the delimiter";no problemo;end
# Default: none
set Delimiter \"
# ArtefactLevel is one of:
# Application: to import data at application level
# File: to import data at file level. In this case ArtefactKey has to be set
# to the value of the header (key) of the column containing the file path
# in the input CSV file.
# Function : to import data at function level, in this case:
# ArtefactKey has to be set to the value of the header (key) of the column containing the path of the file
# FunctionKey has to be set to the value of the header (key) of the column containing the name and signature of the function
# Note that the values are case-sensitive.
set ArtefactLevel File
set ArtefactKey File
# Should the File paths be case-insensitive?
# true or false (default)
# This is used when searching for a matching artefact in already-existing artefacts.
set PathsAreCaseInsensitive "false"
# Should file artefacts declared in the input CSV file be created automatically?
# true (default) or false
set CreateMissingFile "true"
# FileOrganisation defines the layout of the input CSV file and is one of:
# header::column: values are referenced from the column header
# header::line: NOT AVAILABLE
# alternate::line: lines are a sequence of {Key Value}
# alternate::column: columns are a sequence of {Key Value}
# There are more examples of possible CSV layouts later in this document
set FileOrganisation header::column
# Metric2Key contains a case-sensitive list of paired metric IDs:
# {MeasureID KeyName [Format]}
# where:
# - MeasureID is the id of the measure as defined in your analysis model
# - KeyName, depending on the FileOrganisation, is either the name of the column or the name
# in the cell preceding the value to import as found in the input CSV file
# - Format is the optional format of the data, the only accepted format
# is "text" to attach textual information to an artefact, for normal metrics omit this field
set Metric2Key {
{BRANCHES Branchs}
{VERSIONS Versions}
{CREATED Created}
{IDENTICAL Identical}
{ADDED Added}
{REMOV Removed}
{MODIF Modified}
{COMMENT Comment text}
}
==========================
= Sample CSV Input Files =
==========================
Example 1:
==========
FileOrganisation : header::column
ArtefactLevel : File
ArtefactKey : Path
Path Branchs Versions
./foo.c 15 105
./bar.c 12 58
Example 2:
==========
FileOrganisation : alternate::line
ArtefactLevel : File
ArtefactKey : Path
Path ./foo.c Branchs 15 Versions 105
Path ./bar.c Branchs 12 Versions 58
Example 3:
==========
FileOrganisation : header::column
ArtefactLevel : Application
ChangeRequest Corrected Open
27 15 11
Example 4:
==========
FileOrganisation : alternate::column
ArtefactLevel : Application
ChangeRequest 15
Corrected 11
Example 5:
==========
FileOrganisation : alternate::column
ArtefactLevel : File
ArtefactKey : Path
Path ./foo.c
Branchs 15
Versions 105
Path ./bar.c
Branchs 12
Versions 58
Example 6:
==========
FileOrganisation : header::column
ArtefactLevel : Function
ArtefactKey : Path
FunctionKey : Name
Path Name Decisions Tested
./foo.c end_game(int*,int*) 15 3
./bar.c bar(char) 12 6
Working With Paths:
===================
- Path seperators are unified: you do not need to worry about handling differences between Windows and Linux
- With the option PathsAreCaseInsensitive, case is ignored when searching for files in the Squore internal data
- Paths known by Squore are relative paths starting at the root of what was specified in the repository connector durign the analysis. This relative path is the one used to match with a path in a csv file.
Here is a valid example of file matching:
1. You provide C:\A\B\C\D as the root folder in a repository connector
2. C:\A\B\C\D contains E\e.c then Squore will know E/e.c as a file
3. You provide a csv file produced on linux and containing
/tmp/X/Y/E/e.c as path, then Squore will be able to match it with the known file.
Squore uses the longest possible match.
In case of conflict, no file is found and a message is sent to the log.
================ = csv_findings = ================ The csv_findings data provider is used to import findings (rule violations) and attach them to artefacts of type Application, File or Function. The format of the csv file given as parameter has to be: FILE;FUNCTION;RULE_ID;MESSAGE;LINE;COL;STATUS;STATUS_MESSAGE;TOOL where: ===== FILE : is the full path of the file where the finding is located FUNCTION : is the name of the function where the finding is located RULE_ID : is the Squore ID of the rule which is violated MESSAGE : is the specific message of the violation LINE: is the line number where the violation occurs COL: (optional, leave empty if not provided) is the column number where the violation occurs STATUS: (optional, leave empty if not provided) is the staus of the relaxation if the violation has to be relaxed (DEROGATION, FALSE_POSITIVE, LEGACY) STATUS_MSG: (optional, leave empty if not provided) is the message for the relaxation when relaxed TOOL: is the tool providing the violation The header line is read and ignored (it has to be there) The separator (semicolon by default) can be changed in the config.tcl file (see below) The delimiter (no delimiter by default) can be changed in the config.tcl (see below) ============== = config.tcl = ============== Sample config.tcl file: ======================= # The separator used in the input CSV file # Usually ; or \t set Separator \; # The delimiter used in the CSV input file # This is normally left empty, except when you know that some of the values in the CSV file # contain the separator itself, for example: # "A text containing ; the separator";no problem;end # In this case, you need to set the delimiter to \" in order for the data provider to find 3 values instead of 4. # To include the delimiter itself in a value, you need to escape it by duplicating it, for example: # "A text containing "" the delimiter";no problemo;end # Default: none set Delimiter \"
===========
= CsvPerl =
===========
The CsvPerl framework offers the same functionality as Csv, but instead of dealing with the raw input files directly, it allows you to run a perl script to modify them and produce a CSV file with the expected input format for the Csv framework.
============
= form.xml =
============
In your form.xml, specify the input parameters you need for your Data Provider.
Our example will use two parameters: a path to a CSV file and another text parameter:
<?xml version="1.0" encoding="UTF-8"?>
<tags baseName="CsvPerl" needSources="true">
<tag type="text" key="csv" defaultValue="/path/to/csv" />
<tag type="text" key="param" defaultValue="MyValue" />
</tags>
- Since Csv-based data providers commonly rely on artefacts created by Squan Sources, you can set the needSources attribute to force users to specify at least one repository connector when creating a project.
==============
= config.tcl =
==============
Refer to the description of config.tcl for the Csv framework.
For CsvPerl one more option is possible:
# The variable NeedSources is used to request the perl script to be executed once for each
# repository node of the project. In that case an additional parameter is sent to the
# perl script (see below for its position)
#set ::NeedSources 1
==========================
= Sample CSV Input Files =
==========================
Refer to the examples for the Csv framework.
===============
= Perl Script =
===============
The perl scipt will receive as arguments:
- all parameters defined in form.xml (as -${key} $value)
- the input directory to process (only if ::NeedSources is set to 1 in the config.tcl file)
- the location of the output directory where temporary files can be generated
- the full path of the csv file to be generated
For the form.xml we created earlier in this document, the command line will be:
perl <configuration_folder>/tools/CustomDP/CustomDP.pl -csv /path/to/csv -param MyValue <output_folder> <output_folder>/CustomDP.csv
Example of perl script:
======================
#!/usr/bin/perl
use strict;
use warnings;
$|=1 ;
($csvKey, $csvValue, $paramKey, $paramValue, $output_folder, $output_csv) = @ARGV;
# Parse input CSV file
# ...
# Write results to CSV
open(CSVFILE, ">" . ${output_csv}) || die "perl: can not write: $!\n";
binmode(CSVFILE, ":utf8");
print CSVFILE "ChangeRequest;15";
close CSVFILE;
exit 0;===========
= Generic =
===========
The Generic framework is the most flexible Data Provider framework, since it allows attaching metrics, findings, textual information and links to artefacts. If the artefacts do not exist in your project, they will be created automatically. It takes one or more CSV files as input (one per type of information you want to import) and works with any type of artefact.
============
= form.xml =
============
In form.xml, allow users to specify the path to a CSV file for each type of data you want to import.
You can set needSources to true or false, depending on whether or not you want to require the use of a repository connector when your custom Data Provider is used.
Example of form.xml file:
=========================
<?xml version="1.0" encoding="UTF-8"?>
<tags baseName="Generic" needSources="false">
<!-- Path to CSV file containing Metrics data -->
<tag type="text" key="csv" defaultValue="mydata.csv" />
<!-- Path to CSV file containing Findings data: -->
<tag type="text" key="fdg" defaultValue="mydata_fdg.csv" />
<!-- Path to CSV file containing Information data: -->
<tag type="text" key="inf" defaultValue="mydata_inf.csv" />
<!-- Path to CSV file containing Links data: -->
<tag type="text" key="lnk" defaultValue="mydata_lnk.csv" />
</tags>
Note: All tags are optional. You only need to specify the tag element for the type of data you want to import with your custom Data Provider.
==============
= config.tcl =
==============
Sample config.tcl file:
=======================
# The separator used in the input csv files
# Usually \t or ; or ,
# In our example below, a space is used.
set Separator " "
# The delimiter used in the input CSV file
# This is normally left empty, except when you know that some of the values in the CSV file
# contain the separator itself, for example:
# "A text containing ; the separator";no problem;end
# In this case, you need to set the delimiter to \" in order for the data provider to find 3 values instead of 4.
# To include the delimiter itself in a value, you need to escape it by duplicating it, for example:
# "A text containing "" the delimiter";no problemo;end
# Default: none
set Delimiter \"
# The path separator in an artefact's path
# in the input CSV file.
# Note that artefact is spellt with an "i"
# and not an "e" in this option.
set ArtifactPathSeparator "/"
# If the data provider needs to specify a different toolName (optional)
set SpecifyToolName 1
# Metric2Key contains a case-sensitive list of paired metric IDs:
# {MeasureID KeyName [Format]}
# where:
# - MeasureID is the id of the measure as defined in your analysis model
# - KeyName is the name in the cell preceding the value to import as found in the input CSV file
# - Format is the optional format of the data, the only accepted format
# is "text" to attach textual information to an artefact. Note that the same result can also
# be achieved with Info2Key (see below). For normal metrics omit this field.
set Metric2Key {
{CHANGES Changed}
}
# Finding2Key contains a case-sensitive list of paired rule IDs:
# {FindingID KeyName}
# where:
# - FindingID is the id of the rule as defined in your analysis model
# - KeyName is the name in the finding name in the input CSV file
set Finding2Key {
{R_NOTLINKED NotLinked}
}
# Info2Key contains a case-sensitive list of paired info IDs:
# {InfoID KeyName}
# where:
# - InfoID is the id of the textual information as defiend in your analysis model
# - KeyName is the name of the information name in the input CSV file
set Info2Key
{SPECIAL_LABEL Label}
}
# Ignore findings for artefacts that are not part of the project (orphan findings)
# When set to 1, the findings are ignored
# When set to 0, the findings are imported and attached to the APPLICATION node
# (default: 1)
set IgnoreIfArtefactNotFound 1
# If data in csv concerns source code artefacts (File, Class or Function), the way to
# match file paths can be case-insensitive
# true or false (default)
# This is used when searching for a matching artefact in already-existing artefacts.
set PathsAreCaseInsensitive "false"
# For findings of a type that is not in your ruleset, set a default rule ID.
# The value for this parameter must be a valid rule ID from your analysys model.
# (default: empty)
set UnknownRuleId UNKNOWN_RULE
# Save the total count of orphan findings as a metric at application level
# Specify the ID of the metric to use in your analysys model
# to store the information
# (default: empty)
set OrphanArteCountId NB_ORPHANS
# Save the total count of unknown rules as a metric at application level
# Specify the ID of the metric to use in your analysys model
# to store the information
# (default: empty)
set OrphanRulesCountId NB_UNKNOWN_RULES
# Save the list of unknown rule IDs as textual information at application level
# Specify the ID of the metric to use in your analysys model
# to store the information
# (default: empty)
set OrphanRulesListId UNKNOWN_RULES_INFO
====================
= CSV File Format =
====================
All the examples listed below assume the use of the following config.tcl:
set Separator ","
set ArtifactPathSeparator "/"
set Metric2Key {
{CHANGES Changed}
}
set Finding2Key {
{R_NOTLINKED NotLinked}
}
set Info2Key
{SPECIAL_LABEL Label}
}
How to reference an artefact:
============================
==> artefact_type artefact_path
Example:
REQ_MODULES,Requirements
REQ_MODULE,Requirements/Module
REQUIREMENT,Requirements/Module/My_Req
References the following artefact
Application
Requirements (type: REQ_MODULES)
Module (type: REQ_MODULE)
My_Req (type: REQUIREMENT)
Note: For source code artefacts there are 3 special artefact kinds:
==> FILE file_path
==> CLASS file_path (Name|Line)
==> FUNCTION file_path (Name|Line)
Examples:
FUNCTION src/file.c 23
references the function which contains line 23 in the source file src/file.c, if no
function found the line whole line of the csv file is ignored.
FUNCTION src/file.c foo()
references a function named foo in source file src/file.c. If more than one function foo
is defined in this file, then the signature of the function (which is optional) is used
to find the best match.
Layout for Metrics File:
========================
==> artefact_type artefact_path (Key Value)*
When the parent artefact type is not given it defaults to <artefact_type>_FOLDER.
Example:
REQ_MODULE,Requirements/Module
REQUIREMENT,Requirements/Module/My_Req,Changed,1
will produce the following artefact tree:
Application
Requirements (type: REQ_MODULE_FOLDER)
Module (type: REQ_MODULE)
My_Req : (type: REQUIREMENT) with 1 metric CHANGES = 1
Note: the key "Changed" is mapped to the metric "CHANGES", as specified by the Metric2Key parameter, so that it matches what is expected by the model.
Layout for Findings File:
=========================
==> artefact_type artefact_path key message
When the parent artefact type is not given it defaults to <artefact_type>_FOLDER.
Example:
REQ_MODULE,Requirements/Module
REQUIREMENT,Requirements/Module/My_Req,NotLinked,A Requiremement should always been linked
will produce the following artefact tree:
Application
Requirements (type: REQ_MODULE_FOLDER)
Module (type: REQ_MODULE)
My_Req (type: REQUIREMENT) with 1 finding R_NOTLINKED whose description is "A Requiremement should always been linked"
Note: the key "NotLinked" is mapped to the finding "R_NOTLINKED", as specified by the Finding2Key parameter, so that it matches what is expected by the model.
Layout for Textual Information File:
====================================
==> artefact_type artefact_path label value
When the parent artefact type is not given it defaults to <artefact_type>_FOLDER.
Example:
REQ_MODULE,Requirements/Module
REQUIREMENT,Requirements/Module/My_Req,Label,This is the label of the req
will produce the following artefact tree:
Application
Requirements (type: REQ_MODULE_FOLDER)
Module (type: REQ_MODULE)
My_Req (type: REQUIREMENT) with 1 information of type SPECIAL_LABEL whose content is "This is the label of the req"
Note: the label "Label" is mapped to the finding "SPECIAL_LABEL", as specified by the Info2Key parameter, so that it matches what is expected by the model.
Layout for Links File:
======================
==> artefact_type artefact_path dest_artefact_type dest_artefact_path link_type
When the parent artefact type is not given it defaults to <artefact_type>_FOLDER
Example:
REQ_MODULE Requirements/Module
TEST_MODULE Tests/Module
REQUIREMENT Requirements/Module/My_Req TEST Tests/Module/My_test TESTED_BY
will produce the following artefact tree:
Application
Requirements (type: REQ_MODULE_FOLDER)
Module (type: REQ_MODULE)
My_Req (type: REQUIREMENT) ------>
Tests (type: TEST_MODULE_FOLDER) |
Module (type: TEST_MODULE) |
My_Test (type: TEST) <------------+ link (type: TESTED_BY)
The TESTED_BY relationship is created with My_Req as source of the link and My_test as the destination
CSV file organisation when SpecifyToolName is set to 1
======================================================
When the variable SpecifyToolName is set to 1 (or true) a column has to be added
at the beginning of each line in each csv file. This column can be empty or filled with a different toolName.
Example:
,REQ_MODULE,Requirements/Module
MyReqChecker,REQUIREMENT,Requirements/Module/My_Req Label,This is the label of the req
The finding of type Label will be set as reported by the tool "MyReqChecker".===============
= GenericPerl =
===============
The GenericPerl framework is an extension of the Generic framework that starts by running a perl script in order to generate the metrics, findings, information and links files. It is useful if you have an input file whose format needs to be converted to match the one expected by the Generic framework, or if you need to retrieve and modify information exported from a web service on your network.
============
= form.xml =
============
In your form.xml, specify the input parameters you need for your Data Provider.
Our example will use two parameters: a path to a CSV file and another text parameter:
<?xml version="1.0" encoding="UTF-8"?>
<tags baseName="CsvPerl" needSources="false">
<tag type="text" key="csv" defaultValue="/path/to/csv" />
<tag type="text" key="param" defaultValue="MyValue" />
</tags>
==============
= config.tcl =
==============
Refer to the description of config.tcl for the Generic framework for the basic options.
Additionally, the following options are available for the GenericPerl framework, in order to know which type of information your custom Data Provider should try to import.
# If the data provider needs to specify a different toolName (optional)
#set SpecifyToolName 1
# Set to 1 to import metrics csv file, 0 otherwise
# ImportMetrics
# When set to 1, your custom Data Provider (CustomDP) will try to import
# metrics from a file called CustomDP.mtr.csv that your perl script
# should generate according to the expected format described in the
# documentation of the Generic framework.
set ImportMetrics 1
# ImportInfos
# When set to 1, your custom Data Provider (CustomDP) will try to import
# textual information from a file called CustomDP.inf.csv that your perl script
# should generate according to the expected format described in the
# documentation of the Generic framework.
set ImportInfos 0
# ImportFindings
# When set to 1, your custom Data Provider (CustomDP) will try to import
# findings from a file called CustomDP.fdg.csv that your perl script
# should generate according to the expected format described in the
# documentation of the Generic framework.
set ImportFindings 1
# ImportLinks
# When set to 1, your custom Data Provider (CustomDP) will try to import
# artefact links from a file called CustomDP.lnk.csv that your perl script
# should generate according to the expected format described in the
# documentation of the Generic framework.
set ImportLinks 0
# Ignore findings for artefacts that are not part of the project (orphan findings)
# When set to 1, the findings are ignored
# When set to 0, the findings are imported and attached to the APPLICATION node
# (default: 1)
set IgnoreIfArtefactNotFound 1
# For findings of a type that is not in your ruleset, set a default rule ID.
# The value for this parameter must be a valid rule ID from your analysys model.
# (default: empty)
set UnknownRuleId UNKNOWN_RULE
# Save the total count of orphan findings as a metric at application level
# Specify the ID of the metric to use in your analysys model
# to store the information
# (default: empty)
set OrphanArteCountId NB_ORPHANS
# Save the total count of unknown rules as a metric at application level
# Specify the ID of the metric to use in your analysys model
# to store the information
# (default: empty)
set OrphanRulesCountId NB_UNKNOWN_RULES
# Save the list of unknown rule IDs as textual information at application level
# Specify the ID of the metric to use in your analysys model
# to store the information
# (default: empty)
set OrphanRulesListId UNKNOWN_RULES_INFO
====================
= CSV File Format =
====================
Refer to the examples in the Generic framework.
===============
= Perl Script =
===============
The perl scipt will receive as arguments:
- all parameters defined in form.xml (as -${key} $value)
- the location of the output directory where temporary files can be generated
- the full path of the metric csv file to be generated (if ImportMetrics is set to 1 in config.tcl)
- the full path of the findings csv file to be generated (if ImportFindings is set to 1 in config.tcl)
- the full path of the textual information csv file to be generated (if ImportInfos is set to 1 in config.tcl)
- the full path of the links csv file to be generated (if ImportLinks is set to 1 in config.tcl)
- the full path to the output directory used by this data provider in the previous analysis
For the form.xml and config.tcl we created earlier in this document, the command line will be:
perl <configuration_folder>/tools/CustomDP/CustomDP.pl -csv /path/to/csv -param MyValue <output_folder> <output_folder>/CustomDP.mtr.csv <output_folder>/CustomDP.fdg.csv <previous_output_folder>
The following perl functions are made available in the perl environment so you can use them in your script:
- get_tag_value(key) (returns the value for $key parameter from your form.xml)
- get_output_metric()
- get_output_finding()
- get_output_info()
- get_output_link()
- get_output_dir()
- get_input_dir() (returns the folder containing sources if needSources is set to 1)
- get_previous_dir()
Example of perl script:
======================
#!/usr/bin/perl
use strict;
use warnings;
$|=1 ;
# Parse input CSV file
my $csvFile = get_tag_value("csv");
my $param = get_tag_value("param");
# ...
# Write metrics to CSV
open(METRICS_FILE, ">" . get_output_metric()) || die "perl: can not write: $!\n";
binmode(METRICS_FILE, ":utf8");
print METRICS_FILE "REQUIREMENTS;Requirements/All_Requirements;NB_REQ;15";
close METRICS_FILE;
# Write findings to CSV
open(FINDINGS_FILE, ">" . get_output_findings()) || die "perl: can not write: $!\n";
binmode(FINDINGS_FILE, ":utf8");
print FINDINGS_FILE "REQUIREMENTS;Requirements/All_Requirements;R_LOW_REQS;\"The minimum number of requirement should be at least 25.\"";
close FINDINGS_FILE;
exit 0;================
= FindingsPerl =
================
The FindingsPerl framework is used to import findings and attach them to existing artefacts. Optionally, if an artefact cannot be found in your project, the finding can be attached to the root node of the project instead. When launching a Data Provider based on the FindingsPerl framework, a perl script is run first. This perl script is used to generate a CSV file with the expected format which will then be parsed by the framework.
============
= form.xml =
============
In your form.xml, specify the input parameters you need for your Data Provider.
Our example will use two parameters: a path to a CSV file and another text parameter:
<?xml version="1.0" encoding="UTF-8"?>
<tags baseName="CsvPerl" needSources="true">
<tag type="text" key="csv" defaultValue="/path/to/csv" />
<tag type="text" key="param" defaultValue="MyValue" />
</tags>
- Since FindingsPerl-based data providers commonly rely on artefacts created by Squan Sources, you can set the needSources attribute to force users to specify at least one repository connector when creating a project.
==============
= config.tcl =
==============
Sample config.tcl file:
=======================
# The separator to be used in the generated CSV file
# Usually \t or ;
set Separator ";"
# The delimiter used in the input CSV file
# This is normally left empty, except when you know that some of the values in the CSV file
# contain the separator itself, for example:
# "A text containing ; the separator";no problem;end
# In this case, you need to set the delimiter to \" in order for the data provider to find 3 values instead of 4.
# To include the delimiter itself in a value, you need to escape it by duplicating it, for example:
# "A text containing "" the delimiter";no problemo;end
# Default: none
set Delimiter \"
# Should the perl script execcuted once for each repository node of the project ?
# 1 or 0 (default)
# If true an additional parameter is sent to the
# perl script (see below for its position)
set ::NeedSources 0
# Should the violated rules definitions be generated?
# true or false (default)
# This creates a ruleset file with rules that are not already
# part of your analysis model so you can review it and add
# the rules manually if needed.
set generateRulesDefinitions false
# Should the File paths be case-insensitive?
# true or false (default)
# This is used when searching for a matching artefact in already-existing artefacts.
set PathsAreCaseInsensitive false
# Should file artefacts declared in the input CSV file be created automatically?
# true (default) or false
set CreateMissingFile true
# Ignore findings for artefacts that are not part of the project (orphan findings)
# When set to 0, the findings are imported and attached to the APPLICATION node instead of the real artefact
# When set to 1, the findings are not imported at all
# (default: 0)
set IgnoreIfArtefactNotFound 0
# For findings of a type that is not in your ruleset, set a default rule ID.
# The value for this parameter must be a valid rule ID from your analysis model.
# (default: empty)
set UnknownRuleId UNKNOWN_RULE
# Save the total count of orphan findings as a metric at application level
# Specify the ID of the metric to use in your analysys model
# to store the information
# (default: empty)
set OrphanArteCountId NB_ORPHANS
# Save the total count of unknown rules as a metric at application level
# Specify the ID of the metric to use in your analysys model
# to store the information
# (default: empty)
set OrphanRulesCountId NB_UNKNOWN_RULES
# Save the list of unknown rule IDs as textual information at application level
# Specify the ID of the metric to use in your analysys model
# to store the information
# (default: empty)
set OrphanRulesListId UNKNOWN_RULES_INFO
# The tool version to specify in the generated rules definitions
# The default value is ""
# Note that the toolName is the name of the folder you created
# for your custom Data Provider
set ToolVersion ""
# FileOrganisation defines the layout of the CSV file that is produced by your perl script:
# header::column: values are referenced from the column header
# header::line: NOT AVAILABLE
# alternate::line: NOT AVAILABLE
# alternate::column: NOT AVAILABLE
set FileOrganisation header::column
# In order to attach a finding to an artefact of type FILE:
# - Tool (optional) if present it overrides the name of the tool providing the finding
# - Path has to be the path of the file
# - Type has to be set to FILE
# - Line can be either empty or the line in the file where the finding is located
# Rule is the rule identifier, can be used as is or translated using Rule2Key
# Descr is the description message, which can be empty
#
# In order to attach a finding to an artefact of type FUNCTION:
# - Tool (optional) if present it overrides the name of the tool providing the finding
# - Path has to be the path of the file containing the function
# - Type has to be FUNCTION
# - If line is an integer, the system will try to find an artefact function
# at the given line of the file
# - If no Line or Line is not an integer, Name is used to find an artefact in
# the given file having name and signature as found in this column.
# (Line and Name are optional columns)
# Rule2Key contains a case-sensitive list of paired rule IDs:
# {RuleID KeyName}
# where:
# - RuleID is the id of the rule as defined in your analysis model
# - KeyName is the rule ID as written by your perl script in the produced CSV file
# Note: Rules that are not mapped keep their original name. The list of unmapped rules is in the log file generated by your Data Provider.
set Rule2Key {
{ ExtractedRuleID_1 MappedRuleId_1 }
{ ExtractedRuleID_2 MappedRuleId_2 }
}
====================
= CSV File Format =
====================
According to the options defined earlier in config.tcl, a valid csv file would be:
Path;Type;Line;Name;Rule;Descr
/src/project/module1/f1.c;FILE;12;;R1;Rule R1 is violated because variable v1
/src/project/module1/f1.c;FUNCTION;202;;R4;Rule R4 is violated because function f1
/src/project/module2/f2.c;FUNCTION;42;;R1;Rule R1 is violated because variable v2
/src/project/module2/f2.c;FUNCTION;;skip_line(int);R1;Rule R1 is violated because variable v2
Working With Paths:
===================
- Path seperators are unified: you do not need to worry about handling differences between Windows and Linux
- With the option PathsAreCaseInsensitive, case is ignored when searching for files in the Squore internal data
- Paths known by Squore are relative paths starting at the root of what was specified in the repository connector durign the analysis. This relative path is the one used to match with a path in a csv file.
Here is a valid example of file matching:
1. You provide C:\A\B\C\D as the root folder in a repository connector
2. C:\A\B\C\D contains E\e.c then Squore will know E/e.c as a file
3. You provide a csv file produced on linux and containing
/tmp/X/Y/E/e.c as path, then Squore will be able to match it with the known file.
Squore uses the longest possible match.
In case of conflict, no file is found and a message is sent to the log.
===============
= Perl Script =
===============
The perl scipt will receive as arguments:
- all parameters defined in form.xml (as -${key} $value)
- the input directory to process (only if ::NeedSources is set to 1)
- the location of the output directory where temporary files can be generated
- the full path of the findings csv file to be generated
For the form.xml and config.tcl we created earlier in this document, the command line will be:
perl <configuration_folder>/tools/CustomDP/CustomDP.pl -csv /path/to/csv -param MyValue <output_folder> <output_folder>/CustomDP.fdg.csv <output_folder>/CustomDP.fdg.csv
Example of perl script:
======================
#!/usr/bin/perl
use strict;
use warnings;
$|=1 ;
($csvKey, $csvValue, $paramKey, $paramValue, $output_folder, $output_csv) = @ARGV;
# Parse input CSV file
# ...
# Write results to CSV
open(CSVFILE, ">" . ${output_csv}) || die "perl: can not write: $!\n";
binmode(CSVFILE, ":utf8");
print CSVFILE "Path;Type;Line;Name;Rule;Descr";
print CSVFILE "/src/project/module1/f1.c;FILE;12;;R1;Rule R1 is violated because variable v1";
close CSVFILE;
exit 0;================
= ExcelMetrics =
================
The ExcelMetrics framework is used to extract information from one or more Microsoft Excel files (.xls or .xslx). A detailed configuration file allows defining how the Excel document should be read and what information should be extracted. This framework allows importing metrics, findings and textual information to existing artefacts or artefacts that will be created by the Data Provider.
============
= form.xml =
============
You can customise form.xml to either:
- specify the path to a single Excel file to import
- specify a pattern to import all Excel files matching this pattern in a directory
In order to import a single Excel file:
=====================================
<?xml version="1.0" encoding="UTF-8"?>
<tags baseName="ExcelMetrics" needSources="false">
<tag type="text" key="excel" defaultValue="/path/to/mydata.xslx" />
</tags>
Notes:
- The excel key is mandatory.
In order to import all files matching a patter in a folder:
===========================================================
<?xml version="1.0" encoding="UTF-8"?>
<tags baseName="ExcelMetrics" needSources="false">
<!-- Root directory containing Excel files to import-->
<tag type="text" key="dir" defaultValue="/path/to/mydata" />
<!-- Pattern that needs to be matched by a file name in order to import it-->
<tag type="text" key="ext" defaultValue="*.xlsx" />
<!-- search for files in sub-folders -->
<tag type="booleanChoice" defaultValue="true" key="sub" />
</tags>
Notes:
- The dir and ext keys are mandatory
- The sub key is optional (and its value set to false if not specified)
==============
= config.tcl =
==============
Sample config.tcl file:
=======================
# The separator to be used in the generated csv file
# Usually \t or ; or ,
set Separator ";"
# The delimiter used in the input CSV file
# This is normally left empty, except when you know that some of the values in the CSV file
# contain the separator itself, for example:
# "A text containing ; the separator";no problem;end
# In this case, you need to set the delimiter to \" in order for the data provider to find 3 values instead of 4.
# To include the delimiter itself in a value, you need to escape it by duplicating it, for example:
# "A text containing "" the delimiter";no problemo;end
# Default: none
set Delimiter \"
# The path separator in an artefact's path
# in the generated CSV file.
set ArtefactPathSeparator "/"
# Ignore findings for artefacts that are not part of the project (orphan findings)
# When set to 1, the findings are ignored
# When set to 0, the findings are imported and attached to the APPLICATION node
# (default: 1)
set IgnoreIfArtefactNotFound 1
# For findings of a type that is not in your ruleset, set a default rule ID.
# The value for this parameter must be a valid rule ID from your analysys model.
# (default: empty)
set UnknownRuleId UNKNOWN_RULE
# Save the total count of orphan findings as a metric at application level
# Specify the ID of the metric to use in your analysys model
# to store the information
# (default: empty)
set OrphanArteCountId NB_ORPHANS
# Save the total count of unknown rules as a metric at application level
# Specify the ID of the metric to use in your analysys model
# to store the information
# (default: empty)
set OrphanRulesCountId NB_UNKNOWN_RULES
# Save the list of unknown rule IDs as textual information at application level
# Specify the ID of the metric to use in your analysys model
# to store the information
# (default: empty)
set OrphanRulesListId UNKNOWN_RULES_INFO
# The list of the Excel sheets to read, each sheet has the number of the first line to read
# A Perl regexp pattern can be used instead of the name of the sheet (the first sheet matching
# the pattern will be considered)
set Sheets {{Baselines 5} {ChangeNotes 5}}
# ######################
# # COMMON DEFINITIONS #
# ######################
#
# - <value> is a list of column specifications whose values will be concatened. When no column name is present, the
# text is taken as it appears. Optional sheet name can be added (with ! char to separate from the column name)
# Examples:
# - {C:} the value will be the value in column C on the current row
# - {C: B:} the value will be the concatenation of values found in column C and B of the current row
# - {Deliveries} the value will be Deliveries
# - {BJ: " - " BL:} the value will be the concatenation of value found in column BJ,
# string " - " and the value found in column BL fo the current row
# - {OtherSheet!C:} the value will be the value in column C from the sheet OtherSheet on the current row
#
# - <condition> is a list of conditions. An empty condition is always true. A condition is a column name followed by colon,
# optionally followed by a perl regexp. Optional sheet name can be added (with ! char to separate from the column name)
# Examples:
# - {B:} the value in column B must be empty on the current row
# - {B:.+} the value in column B can not be empty on the current row
# - {B:R_.+} the value in column B is a word starting by R_ on the current row
# - {A: B:.+ C:R_.+} the value in column A must be empty and the value in column B must contain something and
# the column C contains a word starting with R_ on the current row
# - {OtherSheet!B:.+} the value in column B from sheet OtherSheet on the current row can not be empty.
# #############
# # ARTEFACTS #
# #############
# The variable is a list of artefact hierarchy specification:
# {ArtefactHierarchySpec1 ArtefactHierarchySpec2 ... ArtefactHierarchySpecN}
# where each ArtefactHierarchySpecx is a list of ArtefactSpec
#
# An ArtefactSpec is a list of items, each item being:
# {<(sheetName!)?artefactType> <conditions> <name> <parentType>? <parentName>?}
# where:
# - <(sheetName!)?artefactType>: allows specifying the type. Optional sheetName can be added (with ! char to separate from the type) to limit
# the artefact search in one specific sheet. When Sheets are given with regexp, the same regexp has to be used
# for the sheetName.
# If the type is followed by a question mark (?), this level of artefact is optional.
# If the type is followed by a plus char (+), this level is repeatable on the next row
# - <condition>: see COMMON DEFINITIONS
# - <value>: the name of the artefact to build, see COMMON DEFINITIONS
#
# - <parentType>: This element is optional. When present, it means that the current element will be attached to a parent having this type
# - <parentValue>: This is a list like <value> to build the name of the artefact of type <parentType>. If such artefact is not found,
# the current artefact does not match
#
# Note: to add metrics at application level, specify an APPLICATION artefact which will match only one line:
# e.g. {APPLICATION {A:.+} {}} will recognize as application the line having column A not empty.
set ArtefactsSpecs {
{
{DELIVERY {} {Deliveries}}
{RELEASE {E:.+} {E:}}
{SPRINT {O:SW_Software} {Q:}}
}
{
{DELIVERY {} {Deliveries}}
{RELEASE {O:SY_System} {Q:}}
}
{
{WP {BL:.+ AF:.+} {BJ: " - " BL:} SPRINT {AF:}}
{ChangeNotes!TASK {D:(added|changed|unchanged) T:imes} {W: AD:}}
}
{
{WP {} {{Unplanned imes}} SPRINT {AF:}}
{TASK {BL: D:(added|changed|unchanged) T:imes W:.+} {W: AD:}}
}
}
# ###########
# # METRICS #
# ###########
# Specification of metrics to be retreived
# This is a list where each element is:
# {<artefactTypeList> <metricId> <condition> <value> <format>}
# Where:
# - <artefactTypeList>: the list of artefact types for which the metric has to be used
# each element of the list is (sheetName!)?artefactType where sheetName is used
# to restrict search to only one sheet. sheetName is optional.
# - <metricId>: the name of the MeasureId to be injected into Squore, as defined in your analysis model
# - <confition>: see COMMON DEFINITIONS above. This is the condition for the metric to be generated.
# - <value> : see COMMON DEFINITIONS above. This is the value for the metric (can be built from multi column)
# - <format> : optional, defaults to NUMBER
# Possible format are:
# * DATE_FR, DATE_EN for date stored as string
# * DATE for cell formatted as date
# * NUMBER_FR, NUMBER_EN for number stored as string
# * NUMBER for cell formatted as number
# * LINES for counting the number of text lines in a cell
# - <formatPattern> : optional
# Only used by the LINES format.
# This is a pattern (can contain perl regexp) used to filter lines to count
set MetricsSpecs {
{{RELEASE SPRINT} TIMESTAMP {} {A:} DATE_EN}
{{RELEASE SPRINT} DATE_ACTUAL_RELEASE {} {S:} DATE_EN}
{{RELEASE SPRINT} DATE_FINISH {} {T:} DATE_EN}
{{RELEASE SPRINT} DELIVERY_STATUS {} {U:}}
{{WP} WP_STATUS {} {BO:}}
{{ChangeNotes!TASK} IS_UNPLAN {} {BL:}}
{{TASK WP} DATE_LABEL {} {BP:} DATE_EN}
{{TASK WP} DATE_INTEG_PLAN {} {BD:} DATE_EN}
{{TASK} TASK_STATUS {} {AE:}}
{{TASK} TASK_TYPE {} {AB:}}
}
# ############
# # FINDINGS #
# ############
# This is a list where each element is:
# {<artefactTypeList> <findingId> <condition> <value> <localisation>}
# Where:
# - <artefactTypeList>: the list of artefact type for which the metric has to be used
# each element of the list is (sheetName!)?artefactType where sheetName is used
# to restrict search to only one sheet. sheetName is optional.
# - <findingId>: the name of the FindingId to be injected into Squore, as defined in your analysis model
# - <confition>: see COMMON DEFINITIONS above. This is the condition for the finding to be triggered.
# - <value>: see COMMON DEFINITIONS above. This is the value for the message of the finding (can be built from multi column)
# - <localisation>: this a <value> representing the localisation of the finding (free text)
set FindingsSpecs {
{{WP} {BAD_WP} {BL:.+ AF:.+} {{This WP is not in a correct state } AF:.+} {A:}}
}
# #######################
# # TEXTUAL INFORMATION #
# #######################
# This is a list where each element is:
# {<artefactTypeList> <infoId> <condition> <value>}
# Where:
# - <artefactTypeList> the list of artefact types for which the info has to be used
# each element of the list is (sheetName!)?artefactType where sheetName is used
# to restrict search to only one sheet. sheetName is optional.
# - <infoId> : is the name of the Information to be attached to the artefact, as defined in your analysis model
# - <confition> : see COMMON DEFINITIONS above. This is the condition for the info to be generated.
# - <value> : see COMMON DEFINITIONS above. This is the value for the info (can be built from multi column)
set InfosSpecs {
{{TASK} ASSIGN_TO {} {XB:}}
}
# ########################
# # LABEL TRANSFORMATION #
# ########################
# This is a list value specification for MeasureId or InfoId:
# <MeasureId|InfoId> { {<LABEL1> <value1>} ... {<LABELn> <valuen>}}
# Where:
# - <MeasureId|InfoId> : is either a MeasureId, an InfoId, or * if it is available for every measureid/infoid
# - <LABELx> : is the label to macth (can contain perl regexp)
# - <valuex> : is the value to replace the label by, it has to match the correct format for the metrics (no format for infoid)
#
# Note: only metrics which are labels in the excel file or information which need to be rewriten, need to be described here.
set Label2ValueSpec {
{
STATUS {
{OPENED 0}
{ANALYZED 1}
{CLOSED 2}
{.* -1}
}
}
{
* {
{FATAL 0}
{ERROR 1}
{WARNING 2}
{{LEVEL:\s*0} 1}
{{LEVEL:\s*1} 2}
{{LEVEL:\s*[2-9]+} 3}
}
}
}
Note that a sample Excel file with its associated config.tcl is available in $SQUORE_HOME/addons/tools/ExcelMetrics in order to further explain available configuration options.Table of Contents
<?xml version="1.0" encoding="UTF-8"?> <xs:schema xmlns:xs="http://www.w3.org/2001/XMLSchema" elementFormDefault="qualified"> <xs:simpleType name="id"> <xs:restriction base="xs:string"> <xs:pattern value="[A-Z_][A-Z0-9_]+" /> </xs:restriction> </xs:simpleType> <xs:simpleType name="relax-status"> <xs:restriction base="id"> <xs:enumeration value="RELAXED_DEROGATION"/> <xs:enumeration value="RELAXED_LEGACY"/> <xs:enumeration value="RELAXED_FALSE_POSITIVE"/> </xs:restriction> </xs:simpleType> <xs:element name="bundle"> <xs:complexType> <xs:choice maxOccurs="unbounded"> <xs:element ref="artifact"/> <xs:element ref="finding"/> <xs:element ref="info"/> <xs:element ref="link"/> <xs:element ref="metric"/> </xs:choice> <xs:attribute name="version" use="required" type="xs:integer" fixed="2"/> </xs:complexType> </xs:element> <xs:element name="artifact"> <xs:complexType> <xs:sequence> <xs:choice minOccurs="0" maxOccurs="unbounded"> <xs:element ref="artifact"/> <xs:element ref="finding"/> <xs:element ref="metric"/> <xs:element ref="key"/> <xs:element ref="info"/> <xs:element ref="link"/> <xs:element ref="milestone"/> </xs:choice> </xs:sequence> <xs:attribute name="alias"/> <xs:attribute name="art-location"/> <xs:attribute name="id"/> <xs:attribute name="local-art-location"/> <xs:attribute name="local-key"/> <xs:attribute name="local-parent"/> <xs:attribute name="location"/> <xs:attribute name="name"/> <xs:attribute name="parent"/> <xs:attribute name="path"/> <xs:attribute name="type" use="required" type="id"/> <xs:attribute name="view-path"/> </xs:complexType> </xs:element> <xs:element name="info"> <xs:complexType> <xs:attribute name="local-ref"/> <xs:attribute name="name" use="required" type="id"/> <xs:attribute name="ref"/> <xs:attribute name="tool"/> <xs:attribute name="value" use="required"/> </xs:complexType> </xs:element> <xs:element name="key"> <xs:complexType> <xs:attribute name="value" use="required"/> </xs:complexType> </xs:element> <xs:element name="metric"> <xs:complexType> <xs:attribute name="local-ref"/> <xs:attribute name="name" use="required" type="id"/> <xs:attribute name="ref"/> <xs:attribute name="tool"/> <xs:attribute name="value" type="xs:decimal" use="required"/> </xs:complexType> </xs:element> <xs:element name="link"> <xs:complexType> <xs:attribute name="dst"/> <xs:attribute name="local-dst" type="xs:integer"/> <xs:attribute name="local-src" type="xs:integer"/> <xs:attribute name="name" use="required" type="id"/> <xs:attribute name="src"/> </xs:complexType> </xs:element> <xs:element name="finding"> <xs:complexType> <xs:sequence> <xs:element minOccurs="0" maxOccurs="unbounded" ref="location"/> <xs:element minOccurs="0" maxOccurs="1" ref="relax"/> </xs:sequence> <xs:attribute name="descr"/> <xs:attribute name="local-ref"/> <xs:attribute name="location" use="required"/> <xs:attribute name="name" use="required" type="id"/> <xs:attribute name="p0"/> <xs:attribute name="p1"/> <xs:attribute name="p2"/> <xs:attribute name="p3"/> <xs:attribute name="p4"/> <xs:attribute name="p5"/> <xs:attribute name="p6"/> <xs:attribute name="p7"/> <xs:attribute name="p8"/> <xs:attribute name="p9"/> <xs:attribute name="ref"/> <xs:attribute name="tool"/> </xs:complexType> </xs:element> <xs:element name="location"> <xs:complexType> <xs:attribute name="local-ref"/> <xs:attribute name="location" use="required"/> <xs:attribute name="ref"/> </xs:complexType> </xs:element> <xs:element name="relax"> <xs:complexType> <xs:simpleContent> <xs:extension base="xs:string"> <xs:attribute name="status" type="relax-status"/> </xs:extension> </xs:simpleContent> </xs:complexType> </xs:element> <xs:element name="milestone"> <xs:complexType> <xs:sequence> <xs:element minOccurs="0" maxOccurs="unbounded" ref="goal"/> </xs:sequence> <xs:attribute name="date" type="xs:integer"/> <xs:attribute name="name" use="required" type="id"/> </xs:complexType> </xs:element> <xs:element name="goal"> <xs:complexType> <xs:attribute name="name" use="required" type="id"/> <xs:attribute name="value" use="required" type="xs:decimal"/> </xs:complexType> </xs:element> </xs:schema>
<?xml version="1.0" encoding="UTF-8"?> <xs:schema xmlns:xs="http://www.w3.org/2001/XMLSchema" elementFormDefault="qualified"> <xs:simpleType name="id"> <xs:restriction base="xs:string"> <xs:pattern value='[A-Z_][A-Z0-9_]+' /> </xs:restriction> </xs:simpleType> <xs:simpleType name="project-status"> <xs:restriction base="id"> <xs:enumeration value="IGNORE"/> <xs:enumeration value="WARNING"/> <xs:enumeration value="ERROR"/> </xs:restriction> </xs:simpleType> <xs:element name="tags"> <xs:complexType> <xs:sequence> <xs:element maxOccurs="0" ref="tag"/> <xs:element maxOccurs="0" ref="exec-phase"/> </xs:sequence> <xs:attribute name="baseName"/> <xs:attribute name="deleteTmpSrc" type="xs:boolean"/> <xs:attribute name="image"/> <xs:attribute name="needSources" type="xs:boolean"/> <xs:attribute name="projectStatusOnFailure" type="project-status"/> </xs:complexType> </xs:element> <xs:element name="tag"> <xs:complexType> <xs:sequence> <xs:element minOccurs="0" maxOccurs="unbounded" ref="value"/> </xs:sequence> <xs:attribute name="changeable" type="xs:boolean"/> <xs:attribute name="credentialType"/> <xs:attribute name="defaultValue"/> <xs:attribute name="displayType"/> <xs:attribute name="key" use="required"/> <xs:attribute name="optionTitle"/> <xs:attribute name="required" type="xs:boolean"/> <xs:attribute name="style"/> <xs:attribute name="type" use="required"/> </xs:complexType> </xs:element> <xs:element name="value"> <xs:complexType> <xs:attribute name="key" use="required"/> <xs:attribute name="option"/> </xs:complexType> </xs:element> <xs:element name="exec-phase"> <xs:complexType> <xs:sequence> <xs:element minOccurs="0" ref="exec"/> <xs:element minOccurs="0" ref="exec-tool"/> </xs:sequence> <xs:attribute name="id" use="required"/> </xs:complexType> </xs:element> <xs:element name="exec"> <xs:complexType> <xs:sequence> <xs:element maxOccurs="0" ref="arg"/> </xs:sequence> <xs:attribute name="name" use="required"/> </xs:complexType> </xs:element> <xs:element name="arg"> <xs:complexType> <xs:attribute name="tag"/> <xs:attribute name="value"/> <xs:attribute name="defaultValue"/> </xs:complexType> </xs:element> <xs:element name="exec-tool"> <xs:complexType> <xs:sequence> <xs:element maxOccurs="0" ref="param"/> </xs:sequence> <xs:attribute name="name" use="required"/> </xs:complexType> </xs:element> <xs:element name="param"> <xs:complexType> <xs:attribute name="key" use="required"/> <xs:attribute name="tag"/> <xs:attribute name="value"/> <xs:attribute name="defaultValue"/> </xs:complexType> </xs:element> </xs:schema>
<?xml version="1.0" encoding="UTF-8"?> <xs:schema xmlns:xs="http://www.w3.org/2001/XMLSchema" version="1.0"> <xs:element name="Bundle" type="bundleType"/> <xs:complexType name="bundleType"> <xs:sequence> <xs:choice minOccurs="0" maxOccurs="unbounded"> <xs:element name="help" type="helpType" minOccurs="0" maxOccurs="unbounded"/> <xs:element name="hideObsoleteModels" type="obsoleteType" minOccurs="0" maxOccurs="1"/> <xs:element name="hideModel" type="hiddenType" minOccurs="0" maxOccurs="unbounded"/> <xs:element name="explorerTabs" type="tabsType" minOccurs="0" maxOccurs="1"/> <xs:element name="explorerTrees" type="treesType" minOccurs="0" maxOccurs="1"/> <xs:element name="option" type="optionType" minOccurs="0" maxOccurs="unbounded"/> </xs:choice> </xs:sequence> <xs:attribute name="version" use="required" type="xs:string"/> </xs:complexType> <xs:complexType name="helpType"> <xs:attribute name="label" use="required" type="xs:string"/> <xs:attribute name="url" use="required" type="xs:anyURI"/> <xs:attribute name="profiles" use="optional" type="xs:string"/> </xs:complexType> <xs:complexType name="optionType"> <xs:attribute name="name" use="required" type="xs:string"/> <xs:attribute name="value" use="required" type="xs:string"/> </xs:complexType> <xs:complexType name="obsoleteType"> <xs:attribute name="value" use="optional" default="false" type="xs:boolean"/> </xs:complexType> <xs:complexType name="hiddenType"> <xs:attribute name="name" use="required" type="xs:string"/> </xs:complexType> <xs:complexType name="tabsType"> <xs:sequence maxOccurs="unbounded"> <xs:element name="tab" type="tabType" maxOccurs="unbounded"/> </xs:sequence> <xs:attribute name="hideSettings" use="optional" default="false" type="xs:boolean"/> </xs:complexType> <xs:complexType name="tabType"> <xs:attribute name="name" use="required" type="xs:string"/> <xs:attribute name="default" use="optional" default="false" type="xs:boolean"/> <xs:attribute name="mandatory" use="optional" default="false" type="xs:boolean"/> <xs:attribute name="rendered" use="optional" default="true" type="xs:boolean"/> </xs:complexType> <xs:complexType name="treesType"> <xs:sequence maxOccurs="unbounded"> <xs:element name="tree" type="treeType" maxOccurs="unbounded"/> </xs:sequence> </xs:complexType> <xs:complexType name="treeType"> <xs:attribute name="name" use="required" type="xs:string"/> <xs:attribute name="rendered" use="optional" default="true" type="xs:boolean"/> </xs:complexType> </xs:schema>
<?xml version="1.0" encoding="UTF-8"?> <xs:schema xmlns:xs="http://www.w3.org/2001/XMLSchema" version="1.0"> <xs:element name="squore" type="squoreType"/> <xs:complexType name="squoreType"> <xs:sequence> <xs:element name="paths" type="pathsType"/> <xs:element name="database" type="databaseType" minOccurs="0"/> <xs:element name="phantomjs" type="phantomjsType" minOccurs="0"/> <xs:element name="configuration" type="directoriesType"/> <xs:element name="addons" type="directoriesType"/> <xs:element name="client" type="dataDirectoriesType" minOccurs="0"/> <xs:element name="tmp" type="directoryType" minOccurs="0"/> <xs:element name="projects" type="projectType" minOccurs="0"/> <xs:element name="sources" type="directoryType" minOccurs="0"/> <xs:element name="workspace" type="directoryType" minOccurs="0"/> </xs:sequence> <xs:attribute name="type" use="required" type="xs:string"/> <xs:attribute name="version" use="required" type="xs:string"/> </xs:complexType> <xs:complexType name="pathsType"> <xs:sequence maxOccurs="unbounded"> <xs:element name="path" type="pathType"/> </xs:sequence> </xs:complexType> <xs:complexType name="pathType"> <xs:attribute name="name" use="required" type="xs:string"/> <xs:attribute name="path" use="required" type="xs:string"/> </xs:complexType> <xs:complexType name="directoriesType"> <xs:sequence maxOccurs="unbounded"> <xs:element name="path" type="directoryType"/> </xs:sequence> </xs:complexType> <xs:complexType name="directoryType"> <xs:attribute name="directory" use="required" type="xs:string"/> </xs:complexType> <xs:complexType name="databaseType"> <xs:sequence> <xs:element name="postgresql" type="directoryType" minOccurs="0"/> <xs:element name="cluster" type="directoryType" minOccurs="0"/> <xs:element name="backup" type="directoryType"/> <xs:element name="security" type="securityType" minOccurs="0"/> </xs:sequence> </xs:complexType> <xs:complexType name="phantomjsType"> <xs:sequence> <xs:element name="socket-binding" type="socketBindingType" minOccurs="0"/> </xs:sequence> </xs:complexType> <xs:complexType name="socketBindingType"> <xs:attribute name="address" type="xs:string" default="127.0.0.1"/> <xs:attribute name="port" type="xs:short" default="3003"/> <xs:attribute name="squore-url" type="xs:string" default=""/> <xs:attribute name="distant-url" type="xs:string" default=""/> </xs:complexType> <xs:complexType name="securityType"> <xs:sequence> <xs:element name="user-name" type="xs:string"/> </xs:sequence> </xs:complexType> <xs:complexType name="dataDirectoriesType"> <xs:sequence> <xs:element name="tmp" type="directoryType" minOccurs="0"/> <xs:element name="projects" type="projectType" minOccurs="0"/> <xs:element name="sources" type="directoryType" minOccurs="0"/> </xs:sequence> </xs:complexType> <xs:complexType name="projectType"> <xs:sequence> <xs:element name="data-providers" type="dpType" minOccurs="0"/> </xs:sequence> <xs:attribute name="directory" use="required" type="xs:string"/> </xs:complexType> <xs:complexType name="dpType"> <xs:attribute name="keep-data-files" use="required" type="xs:boolean"/> </xs:complexType> </xs:schema>
<?xml version="1.0" encoding="UTF-8"?> <xs:schema xmlns:xs="http://www.w3.org/2001/XMLSchema" elementFormDefault="qualified"> <xs:simpleType name="id"> <xs:restriction base="xs:string"> <xs:pattern value='[A-Z_][A-Z0-9_]+' /> </xs:restriction> </xs:simpleType> <xs:simpleType name="list-id"> <xs:restriction base="xs:string"> <xs:pattern value='[A-Z_][A-Z0-9_]+(;[A-Z_][A-Z0-9_]+)*' /> </xs:restriction> </xs:simpleType> <xs:simpleType name="families"> <xs:restriction base="xs:string"> <xs:pattern value='[A-Z0-9_]+(;[A-Z_][A-Z0-9_]+)*' /> </xs:restriction> </xs:simpleType> <xs:simpleType name="categories"> <xs:restriction base="xs:string"> <xs:pattern value='[A-Z_][A-Z0-9_]+\.[A-Z_][A-Z0-9_]+(;[A-Z_][A-Z0-9_]+\.[A-Z_][A-Z0-9_]+)*' /> </xs:restriction> </xs:simpleType> <xs:simpleType name="measure-type"> <xs:restriction base="id"> <xs:enumeration value="METRIC"/> <xs:enumeration value="RULE"/> </xs:restriction> </xs:simpleType> <xs:simpleType name="format"> <xs:restriction base="id"> <xs:enumeration value="NUMBER"/> <xs:enumeration value="PERCENT"/> <xs:enumeration value="INTEGER"/> <xs:enumeration value="DATE"/> <xs:enumeration value="DATETIME"/> <xs:enumeration value="TIME"/> <xs:enumeration value="DAYS"/> <xs:enumeration value="HOURS"/> <xs:enumeration value="MINUTES"/> <xs:enumeration value="SECONDS"/> <xs:enumeration value="MILLISECONDS"/> <xs:enumeration value="MAN_DAYS"/> <xs:enumeration value="MAN_HOURS"/> <xs:enumeration value="MAN_MINUTES"/> <xs:enumeration value="MAN_SECONDS"/> <xs:enumeration value="MAN_MILLISECONDS"/> </xs:restriction> </xs:simpleType> <xs:simpleType name="datetime-style"> <xs:restriction base="id"> <xs:enumeration value="DEFAULT"/> <xs:enumeration value="SHORT"/> <xs:enumeration value="MEDIUM"/> <xs:enumeration value="LONG"/> <xs:enumeration value="FULL"/> </xs:restriction> </xs:simpleType> <xs:simpleType name="rounding-mode"> <xs:restriction base="id"> <xs:enumeration value="UP"/> <xs:enumeration value="DOWN"/> <xs:enumeration value="CEILING"/> <xs:enumeration value="FLOOR"/> <xs:enumeration value="HALF_UP"/> <xs:enumeration value="HALF_DOWN"/> <xs:enumeration value="HALF_EVEN"/> </xs:restriction> </xs:simpleType> <xs:simpleType name="bounds-type"> <xs:restriction base="xs:string"> <xs:pattern value='[\[\]]((-)*[0-9](\.[0-9]+)?)*;((-)*[0-9](.[0-9]+)?)*[\[\]]' /> </xs:restriction> </xs:simpleType> <xs:simpleType name="path-scope"> <xs:restriction base="id"> <xs:enumeration value="CHILDREN"/> <xs:enumeration value="DESCENDANTS"/> </xs:restriction> </xs:simpleType> <xs:complexType name="elements"> <xs:sequence> <xs:choice minOccurs="0" maxOccurs="unbounded"> <xs:element ref="ArtefactType"/> <xs:element ref="Indicator"/> <xs:element ref="Measure"/> <xs:element ref="Package"/> <xs:element ref="package"/> <xs:element ref="Scale"/> <xs:element ref="ScaleMacro"/> <xs:element ref="Constant"/> <xs:element ref="RootIndicator"/> <xs:element ref="UpdateRules"/> <xs:element ref="UpdateRule"/> <xs:element ref="Link"/> <xs:element ref="ComputedLink"/> </xs:choice> </xs:sequence> <xs:attribute name="providedBy"/> <xs:attribute name="name"/> <xs:attribute name="storedOnlyIfDisplayed" type="xs:boolean"/> </xs:complexType> <xs:element name="Bundle" type="elements" /> <xs:element name="Package" type="elements"/> <xs:element name="package" type="elements"/> <xs:element name="Constant"> <xs:complexType> <xs:attribute name="id" use="required" type="id"/> <xs:attribute name="value" use="required"/> </xs:complexType> </xs:element> <xs:element name="RootIndicator"> <xs:complexType> <xs:attribute name="artefactTypes" use="required" type="list-id"/> <xs:attribute name="indicatorId" use="required" type="id"/> </xs:complexType> </xs:element> <xs:element name="UpdateRules"> <xs:complexType> <xs:sequence> <xs:element minOccurs="0" maxOccurs="unbounded" ref="UpdateRule"/> </xs:sequence> </xs:complexType> </xs:element> <xs:element name="UpdateRule"> <xs:complexType> <xs:attribute name="categories" type="categories"/> <xs:attribute name="disabled" type="xs:boolean"/> <xs:attribute name="measureId" use="required" type="id"/> </xs:complexType> </xs:element> <xs:element name="Measure"> <xs:complexType> <xs:sequence> <xs:element minOccurs="0" maxOccurs="unbounded" ref="Computation"/> </xs:sequence> <xs:attribute name="acceptMissingValue" type="xs:boolean"/> <xs:attribute name="categories" type="categories"/> <xs:attribute name="dataBounds" type="bounds-type"/> <xs:attribute name="dateStyle" type="datetime-style"/> <xs:attribute name="decimals" type="xs:integer"/> <xs:attribute name="defaultValue" type="xs:decimal"/> <xs:attribute name="excludingTypes" type="list-id"/> <xs:attribute name="invalidValue"/> <xs:attribute name="families" type="families"/> <xs:attribute name="format" type="format"/> <xs:attribute name="manual" type="xs:boolean"/> <xs:attribute name="measureId" use="required" type="id"/> <xs:attribute name="noValue"/> <xs:attribute name="pattern"/> <xs:attribute name="roundingMode" type="rounding-mode"/> <xs:attribute name="suffix"/> <xs:attribute name="targetArtefactTypes"/> <xs:attribute name="timeStyle" type="datetime-style"/> <xs:attribute name="toolName"/> <xs:attribute name="toolVersion"/> <xs:attribute name="type" type="measure-type"/> <xs:attribute name="usedForRelaxation" type="xs:boolean"/> </xs:complexType> </xs:element> <xs:element name="Computation"> <xs:complexType> <xs:attribute name="continueOnRelaxed" type="xs:boolean"/> <xs:attribute name="excludingTypes" type="list-id"/> <xs:attribute name="result" use="required"/> <xs:attribute name="stored" type="xs:boolean"/> <xs:attribute name="targetArtefactTypes" use="required" type="list-id"/> </xs:complexType> </xs:element> <xs:element name="Indicator"> <xs:complexType> <xs:attribute name="displayedScale" type="id"/> <xs:attribute name="displayedValue" type="id"/> <xs:attribute name="displayTypes" type="list-id"/> <xs:attribute name="excludingTypes" type="list-id"/> <xs:attribute name="families" type="families"/> <xs:attribute name="indicatorId" use="required" type="id"/> <xs:attribute name="measureId" type="id"/> <xs:attribute name="scaleId" type="id"/> <xs:attribute name="targetArtefactTypes" type="list-id"/> </xs:complexType> </xs:element> <xs:element name="Scale"> <xs:complexType> <xs:sequence> <xs:element minOccurs="0" maxOccurs="unbounded" ref="ScaleLevel"/> </xs:sequence> <xs:attribute name="isDynamic" type="xs:boolean"/> <xs:attribute name="macro" type="id"/> <xs:attribute name="scaleId" use="required" type="id"/> <xs:attribute name="targetArtefactTypes" type="list-id"/> <xs:attribute name="vars"/> </xs:complexType> </xs:element> <xs:element name="ScaleMacro"> <xs:complexType> <xs:sequence> <xs:element maxOccurs="unbounded" ref="ScaleLevel"/> </xs:sequence> <xs:attribute name="id" use="required" type="id"/> <xs:attribute name="isDynamic" type="xs:boolean"/> </xs:complexType> </xs:element> <xs:element name="ArtefactType"> <xs:complexType> <xs:attribute name="heirs" type="list-id"/> <xs:attribute name="id" use="required" type="id"/> <xs:attribute name="manual" type="xs:boolean"/> <xs:attribute name="parents" type="list-id"/> </xs:complexType> </xs:element> <xs:element name="ScaleLevel"> <xs:complexType> <xs:attribute name="bounds" use="required"/> <xs:attribute name="levelId" use="required" type="id"/> <xs:attribute name="rank" use="required"/> </xs:complexType> </xs:element> <xs:element name="Link"> <xs:complexType> <xs:attribute name="id" use="required" type="id"/> <xs:attribute name="inArtefactTypes" type="list-id"/> <xs:attribute name="outArtefactTypes" type="list-id"/> <xs:attribute name="srcArtefactTypes" type="list-id"/> <xs:attribute name="dstArtefactTypes" type="list-id"/> </xs:complexType> </xs:element> <xs:element name="ComputedLink"> <xs:complexType> <xs:sequence> <xs:element minOccurs="1" maxOccurs="1" ref="StartPath"/> <xs:element minOccurs="0" maxOccurs="unbounded" ref="NextPath"/> </xs:sequence> <xs:attribute name="id" use="required" type="id"/> </xs:complexType> </xs:element> <xs:element name="StartPath"> <xs:complexType> <xs:attribute name="link" type="id"/> <xs:attribute name="scope" type="path-scope"/> <xs:attribute name="srcArtefactTypes" type="list-id"/> <xs:attribute name="dstArtefactTypes" type="list-id"/> <xs:attribute name="srcCondition"/> <xs:attribute name="dstCondition"/> <xs:attribute name="recurse" type="xs:boolean"/> <xs:attribute name="keepIntermediateLinks" type="xs:boolean"/> </xs:complexType> </xs:element> <xs:element name="NextPath"> <xs:complexType> <xs:attribute name="link" type="id"/> <xs:attribute name="scope" type="path-scope"/> <xs:attribute name="dstArtefactTypes" type="list-id"/> <xs:attribute name="dstCondition"/> <xs:attribute name="recurse" type="xs:boolean"/> <xs:attribute name="keepIntermediateLinks" type="xs:boolean"/> </xs:complexType> </xs:element> </xs:schema>
<?xml version="1.0" encoding="UTF-8"?> <xs:schema xmlns:xs="http://www.w3.org/2001/XMLSchema" elementFormDefault="qualified"> <xs:simpleType name="id"> <xs:restriction base="xs:string"> <xs:pattern value='[A-Z_][A-Z0-9_]+' /> </xs:restriction> </xs:simpleType> <xs:simpleType name="list-id"> <xs:restriction base="xs:string"> <xs:pattern value='[A-Z_][A-Z0-9_]+(;[A-Z_][A-Z0-9_]+)*' /> </xs:restriction> </xs:simpleType> <xs:simpleType name="categories"> <xs:restriction base="xs:string"> <xs:pattern value='[A-Z_][A-Z0-9_]+\.[A-Z_][A-Z0-9_]+(;[A-Z_][A-Z0-9_]+\.[A-Z_][A-Z0-9_]+)*' /> </xs:restriction> </xs:simpleType> <xs:simpleType name="criterion-type"> <xs:restriction base="id"> <xs:enumeration value="BENEFIT"/> <xs:enumeration value="COST"/> </xs:restriction> </xs:simpleType> <xs:simpleType name="preference-level"> <xs:restriction base="id"> <xs:enumeration value="VERY_LOW"/> <xs:enumeration value="LOW"/> <xs:enumeration value="MEDIUM"/> <xs:enumeration value="HIGH"/> <xs:enumeration value="VERY_HIGH"/> </xs:restriction> </xs:simpleType> <xs:complexType name="elements"> <xs:sequence> <xs:choice minOccurs="0" maxOccurs="unbounded"> <xs:element ref="Package"/> <xs:element ref="package"/> <xs:element ref="DecisionCriteria"/> <xs:element ref="DecisionCriterion"/> <xs:element ref="FindingsActionPlan"/> </xs:choice> </xs:sequence> </xs:complexType> <xs:element name="Bundle" type="elements"/> <xs:element name="Package" type="elements"/> <xs:element name="package" type="elements"/> <xs:element name="DecisionCriteria" type="elements"/> <xs:element name="DecisionCriterion"> <xs:complexType> <xs:sequence> <xs:element ref="Triggers"/> </xs:sequence> <xs:attribute name="categories" type="categories"/> <xs:attribute name="dcId" use="required" type="id"/> <xs:attribute name="excludingTypes" type="list-id"/> <xs:attribute name="families" type="list-id"/> <xs:attribute name="roles" type="list-id"/> <xs:attribute name="targetArtefactTypes" use="required" type="list-id"/> </xs:complexType> </xs:element> <xs:element name="Triggers"> <xs:complexType> <xs:sequence> <xs:element maxOccurs="unbounded" ref="Trigger"/> </xs:sequence> </xs:complexType> </xs:element> <xs:element name="Trigger"> <xs:complexType> <xs:sequence> <xs:element maxOccurs="unbounded" ref="Test"/> </xs:sequence> </xs:complexType> </xs:element> <xs:element name="Test"> <xs:complexType> <xs:attribute name="bounds"/> <xs:attribute name="descrId" type="id"/> <xs:attribute name="expr" use="required"/> <xs:attribute name="p0"/> <xs:attribute name="p1"/> <xs:attribute name="p2"/> <xs:attribute name="p3"/> <xs:attribute name="p4"/> <xs:attribute name="p5"/> <xs:attribute name="p6"/> <xs:attribute name="p7"/> <xs:attribute name="p8"/> <xs:attribute name="p9"/> <xs:attribute name="suspect"/> </xs:complexType> </xs:element> <xs:element name="FindingsActionPlan"> <xs:complexType> <xs:sequence> <xs:choice minOccurs="0" maxOccurs="unbounded"> <xs:element ref="CategoryCriterion"/> <xs:element ref="OccurrencesCriterion"/> <xs:element ref="VariableCriterion"/> </xs:choice> </xs:sequence> <xs:attribute name="limit" type="xs:integer"/> <xs:attribute name="priorityScaleId" type="id"/> </xs:complexType> </xs:element> <xs:element name="CategoryCriterion"> <xs:complexType> <xs:attribute name="type" type="criterion-type"/> <xs:attribute name="preferenceLevel" type="preference-level"/> <xs:attribute name="scaleId" use="required" type="id"/> <xs:attribute name="excludeLevels" type="list-id"/> </xs:complexType> </xs:element> <xs:element name="OccurrencesCriterion"> <xs:complexType> <xs:attribute name="type" type="criterion-type"/> <xs:attribute name="preferenceLevel" type="preference-level"/> <xs:attribute name="scaleId" type="id"/> <xs:attribute name="excludeLevels" type="list-id"/> </xs:complexType> </xs:element> <xs:element name="VariableCriterion"> <xs:complexType> <xs:attribute name="type" type="criterion-type"/> <xs:attribute name="preferenceLevel" type="preference-level"/> <xs:attribute name="indicatorId" use="required" type="id"/> <xs:attribute name="excludeLevels" type="list-id"/> </xs:complexType> </xs:element> </xs:schema>
<?xml version="1.0" encoding="UTF-8"?> <xs:schema xmlns:xs="http://www.w3.org/2001/XMLSchema" elementFormDefault="qualified"> <xs:complexType name="elements"> <xs:sequence> <xs:choice minOccurs="0" maxOccurs="unbounded"> <xs:element ref="Package"/> <xs:element ref="package"/> <xs:element ref="Properties"/> </xs:choice> </xs:sequence> </xs:complexType> <xs:element name="Bundle"> <xs:complexType> <xs:sequence> <xs:choice minOccurs="0" maxOccurs="unbounded"> <xs:element ref="Package"/> <xs:element ref="package"/> <xs:element ref="Properties"/> </xs:choice> </xs:sequence> <xs:attribute name="available"/> <xs:attribute name="default"/> </xs:complexType> </xs:element> <xs:element name="Package" type="elements"/> <xs:element name="package" type="elements"/> <xs:element name="Properties"> <xs:complexType> <xs:attribute name="src" use="required"/> </xs:complexType> </xs:element> </xs:schema>
<?xml version="1.0" encoding="UTF-8"?> <xs:schema xmlns:xs="http://www.w3.org/2001/XMLSchema" elementFormDefault="qualified"> <xs:simpleType name="type-id"> <xs:restriction base="xs:string"> <xs:pattern value='[A-Z0-9_]*' /> </xs:restriction> </xs:simpleType> <xs:element name="Bundle"> <xs:complexType> <xs:sequence minOccurs="0" maxOccurs="unbounded"> <xs:element ref="Role" /> </xs:sequence> </xs:complexType> </xs:element> <xs:element name="Role"> <xs:complexType> <xs:sequence minOccurs="0" maxOccurs="unbounded"> <xs:element ref="Export" /> </xs:sequence> <xs:attribute name="name" use="required" type="xs:string" /> </xs:complexType> </xs:element> <xs:element name="Export"> <xs:complexType> <xs:sequence maxOccurs="unbounded"> <xs:element ref="ExportScript" /> </xs:sequence> <xs:attribute name="type" use="required" type="type-id" /> </xs:complexType> </xs:element> <xs:element name="ExportScript"> <xs:complexType> <xs:sequence> <xs:element minOccurs="0" maxOccurs="unbounded" ref="arg" /> </xs:sequence> <xs:attribute name="name" use="required" type="xs:string" /> <xs:attribute name="script" use="required" type="xs:string" /> </xs:complexType> </xs:element> <xs:element name="arg"> <xs:complexType> <xs:attribute name="value" use="required" type="xs:string" /> <xs:attribute name="optional" use="optional" type="xs:boolean" default="false" /> </xs:complexType> </xs:element> </xs:schema>
<?xml version="1.0" encoding="UTF-8"?> <xs:schema xmlns:xs="http://www.w3.org/2001/XMLSchema"> <xs:simpleType name="id"> <xs:restriction base="xs:string"> <xs:pattern value='[A-Z0-9_]*' /> </xs:restriction> </xs:simpleType> <xs:simpleType name="measure-id"> <xs:restriction base="xs:string"> <xs:pattern value='([BD].)?[A-Z0-9_]*' /> </xs:restriction> </xs:simpleType> <xs:simpleType name="info-id"> <xs:restriction base="xs:string"> <xs:pattern value='[A-Z0-9_]*' /> </xs:restriction> </xs:simpleType> <xs:simpleType name="indicator-id"> <xs:restriction base="xs:string"> <xs:pattern value='([I].)?[A-Z0-9_]*' /> </xs:restriction> </xs:simpleType> <xs:simpleType name="bounds-type"> <xs:restriction base="xs:string"> <xs:pattern value='[\[\]]((-)*[0-9](\.[0-9]+)?)*;((-)*[0-9](.[0-9]+)?)*[\[\]]' /> </xs:restriction> </xs:simpleType> <xs:simpleType name="top-order"> <xs:restriction base="xs:string"> <xs:enumeration value="ASC" /> <xs:enumeration value="DESC" /> </xs:restriction> </xs:simpleType> <xs:simpleType name="result-size"> <xs:union> <xs:simpleType> <xs:restriction base="xs:positiveInteger" /> </xs:simpleType> <xs:simpleType> <xs:restriction base="xs:string"> <xs:enumeration value="*" /> </xs:restriction> </xs:simpleType> </xs:union> </xs:simpleType> <xs:simpleType name="header-display-type"> <xs:restriction base="xs:string"> <xs:enumeration value="MNEMONIC" /> <xs:enumeration value="NAME" /> </xs:restriction> </xs:simpleType> <xs:simpleType name="display-type"> <xs:restriction base="xs:string"> <xs:enumeration value="VALUE" /> <xs:enumeration value="RANK" /> <xs:enumeration value="ICON" /> <xs:enumeration value="DATE" /> <xs:enumeration value="DATETIME" /> <xs:enumeration value="TIME" /> <xs:enumeration value="NAME" /> <xs:enumeration value="MNEMONIC" /> </xs:restriction> </xs:simpleType> <xs:simpleType name="date-style"> <xs:restriction base="xs:string"> <xs:enumeration value="SHORT" /> <xs:enumeration value="MEDIUM" /> <xs:enumeration value="DEFAULT" /> <xs:enumeration value="LONG" /> <xs:enumeration value="FULL" /> </xs:restriction> </xs:simpleType> <xs:element name="Bundle"> <xs:complexType> <xs:sequence maxOccurs="unbounded"> <xs:element ref="Role" /> </xs:sequence> </xs:complexType> </xs:element> <xs:element name="Role"> <xs:complexType> <xs:sequence maxOccurs="unbounded"> <xs:element ref="Filters" /> </xs:sequence> <xs:attribute name="name" use="required" type="xs:string" /> <xs:attribute name="preSelectedType" use="optional" type="xs:string" /> </xs:complexType> </xs:element> <xs:element name="Filters"> <xs:complexType> <xs:sequence maxOccurs="unbounded"> <xs:choice> <xs:element ref="TopArtefacts" /> <xs:element name="TopDeltaArtefacts" type="top-artefacts" /> <xs:element name="TopNewArtefacts" type="top-artefacts" /> </xs:choice> </xs:sequence> <xs:attribute name="type" use="required" type="xs:string" /> </xs:complexType> </xs:element> <xs:element name="TopArtefacts"> <xs:complexType> <xs:sequence maxOccurs="unbounded"> <xs:choice> <xs:element minOccurs="0" maxOccurs="unbounded" ref="Column" /> <xs:element minOccurs="0" maxOccurs="unbounded" ref="Where" /> <xs:element minOccurs="0" maxOccurs="unbounded" ref="OrderBy" /> </xs:choice> </xs:sequence> <xs:attribute name="id" use="required" type="id" /> <xs:attribute name="name" use="optional" type="xs:string" /> <xs:attribute name="artefactTypes" use="optional" type="xs:string" /> <xs:attribute name="excludingTypes" use="optional" type="xs:string" /> <xs:attribute name="measureId" use="optional" default="LEVEL" type="measure-id" /> <xs:attribute name="order" use="optional" default="ASC" type="top-order" /> <xs:attribute name="altMeasureId" use="optional" type="measure-id" /> <xs:attribute name="altOrder" use="optional" type="top-order" /> <xs:attribute name="resultSize" use="required" type="result-size" /> </xs:complexType> </xs:element> <xs:element name="Column"> <xs:complexType> <xs:attribute name="measureId" use="optional" type="measure-id" /> <xs:attribute name="infoId" use="optional" type="info-id" /> <xs:attribute name="indicatorId" use="optional" type="indicator-id" /> <xs:attribute name="artefactTypes" use="optional" type="xs:string" /> <xs:attribute name="excludingTypes" use="optional" type="xs:string" /> <xs:attribute name="headerDisplayType" use="optional" default="NAME" type="header-display-type" /> <xs:attribute name="displayType" use="optional" default="VALUE" type="display-type" /> <xs:attribute name="decimals" use="optional" default="2" type="xs:integer" /> <xs:attribute name="dateStyle" use="optional" default="DEFAULT" type="date-style" /> <xs:attribute name="timeStyle" use="optional" default="DEFAULT" type="date-style" /> <xs:attribute name="datePattern" use="optional" type="xs:string" /> <xs:attribute name="suffix" use="optional" type="xs:string" /> <xs:attribute name="useBackgroundColor" use="optional" type="xs:boolean" /> </xs:complexType> </xs:element> <xs:element name="Where"> <xs:complexType> <xs:attribute name="measureId" use="optional" type="measure-id" /> <xs:attribute name="infoId" use="optional" type="info-id" /> <xs:attribute name="value" use="optional" type="xs:string" /> <xs:attribute name="bounds" use="optional" type="bounds-type" /> </xs:complexType> </xs:element> <xs:element name="OrderBy"> <xs:complexType> <xs:attribute name="measureId" use="required" type="measure-id" /> <xs:attribute name="order" use="optional" default="ASC" type="top-order" /> </xs:complexType> </xs:element> <xs:complexType name="top-artefacts"> <xs:sequence maxOccurs="unbounded"> <xs:choice> <xs:element minOccurs="0" maxOccurs="unbounded" ref="Column" /> <xs:element minOccurs="0" maxOccurs="unbounded" ref="Where" /> <xs:element minOccurs="0" maxOccurs="unbounded" ref="OrderBy" /> </xs:choice> </xs:sequence> <xs:attribute name="id" use="required" type="id" /> <xs:attribute name="name" use="optional" type="xs:string" /> <xs:attribute name="artefactTypes" use="optional" type="xs:string" /> <xs:attribute name="excludingTypes" use="optional" type="xs:string" /> <xs:attribute name="measureId" use="optional" default="LEVEL" type="measure-id" /> <xs:attribute name="order" use="optional" default="ASC" type="top-order" /> <xs:attribute name="resultSize" use="required" type="result-size" /> </xs:complexType> </xs:schema>
<?xml version="1.0" encoding="UTF-8"?> <xs:schema xmlns:xs="http://www.w3.org/2001/XMLSchema" elementFormDefault="qualified"> <xs:simpleType name="id"> <xs:restriction base="xs:string"> <xs:pattern value='[A-Z_][A-Z0-9_]+' /> </xs:restriction> </xs:simpleType> <xs:simpleType name="list-id"> <xs:restriction base="xs:string"> <xs:pattern value='[A-Z_][A-Z0-9_]+(;[A-Z_][A-Z0-9_]+)*' /> </xs:restriction> </xs:simpleType> <xs:complexType name="elements"> <xs:sequence> <xs:choice minOccurs="0" maxOccurs="unbounded"> <xs:element ref="package"/> <xs:element ref="hideMeasure"/> <xs:element ref="findingsTab"/> <xs:element ref="actionItemsTab"/> <xs:element ref="rulesEdition"/> </xs:choice> </xs:sequence> </xs:complexType> <xs:element name="bundle" type="elements"/> <xs:element name="package" type="elements"/> <xs:element name="hideMeasure"> <xs:complexType> <xs:attribute name="path" use="required"/> <xs:attribute name="targetArtefactTypes" type="list-id"/> </xs:complexType> </xs:element> <xs:element name="findingsTab"> <xs:complexType> <xs:attribute name="orderBy" type="list-id"/> <xs:attribute name="hideColumns" type="list-id"/> <xs:attribute name="hideCharacteristicsFilter" type="xs:boolean"/> </xs:complexType> </xs:element> <xs:element name="actionItemsTab"> <xs:complexType> <xs:attribute name="orderBy" type="list-id"/> <xs:attribute name="hideColumns" type="list-id"/> </xs:complexType> </xs:element> <xs:element name="rulesEdition"> <xs:complexType> <xs:attribute name="scales" use="required" type="list-id"/> </xs:complexType> </xs:element> </xs:schema>
<?xml version="1.0" encoding="UTF-8"?> <xs:schema xmlns:xs="http://www.w3.org/2001/XMLSchema"> <xs:simpleType name="external-id"> <xs:restriction base="xs:string"> <xs:pattern value="[A-Z]{1}[A-Z0-9_]*" /> </xs:restriction> </xs:simpleType> <xs:simpleType name="positive-integer"> <xs:restriction base="xs:string"> <xs:pattern value="[0-9]+" /> </xs:restriction> </xs:simpleType> <xs:simpleType name="opacity"> <xs:restriction base="xs:string"> <xs:pattern value='(0|1){1}\.?[0-9]{0,2}' /> </xs:restriction> </xs:simpleType> <xs:simpleType name="actions"> <xs:restriction base="xs:string"> <xs:enumeration value="EXPAND_PORTFOLIO_TREE" /> <xs:enumeration value="EXPAND_ARTEFACT_TREE" /> <xs:enumeration value="EXPAND_MEASURE_TREE" /> <xs:enumeration value="COLLAPSE_PORTFOLIO_TREE" /> <xs:enumeration value="COLLAPSE_ARTEFACT_TREE" /> <xs:enumeration value="COLLAPSE_MEASURE_TREE" /> <xs:enumeration value="SELECT_MODEL" /> <xs:enumeration value="SELECT_PROJECT" /> <xs:enumeration value="SELECT_ARTEFACT" /> <xs:enumeration value="SELECT_ARTEFACT_LEAF" /> <xs:enumeration value="CLOSE_MEASURE_POPUP" /> <xs:enumeration value="SELECT_MEASURE" /> <xs:enumeration value="SHOW_REVIEW_SET" /> <xs:enumeration value="SHOW_PORTFOLIO_TREE" /> <xs:enumeration value="SHOW_DASHBOARD_TAB" /> <xs:enumeration value="SHOW_ACTION_ITEMS_TAB" /> <xs:enumeration value="SHOW_HIGHLIGHTS_TAB" /> <xs:enumeration value="SHOW_FINDINGS_TAB" /> <xs:enumeration value="SHOW_REPORTS_TAB" /> <xs:enumeration value="SHOW_FORMS_TAB" /> <xs:enumeration value="SHOW_INDICATORS_TAB" /> <xs:enumeration value="SHOW_MEASURES_TAB" /> <xs:enumeration value="SHOW_COMMENTS_TAB" /> <xs:enumeration value="SHOW_ACTION_ITEMS_ADVANCED_SEARCH" /> <xs:enumeration value="EXPAND_ACTION_ITEM" /> <xs:enumeration value="SHOW_FINDINGS_ADVANCED_SEARCH" /> <xs:enumeration value="SELECT_FINDING" /> <xs:enumeration value="SELECT_FINDING_ARTEFACT" /> <xs:enumeration value="EXPAND_FINDING" /> <xs:enumeration value="EXPAND_ATTRIBUTE" /> <xs:enumeration value="SWITCH_INDICATORS_PAGE" /> <xs:enumeration value="SWITCH_MEASURES_PAGE" /> <xs:enumeration value="SWITCH_COMMENTS_PAGE" /> <xs:enumeration value="CLOSE_CHART_POPUP" /> <xs:enumeration value="OPEN_CHART_POPUP" /> <xs:enumeration value="OPEN_MODEL_CHART_POPUP" /> <xs:enumeration value="SELECT_DESCR_TAB" /> <xs:enumeration value="SELECT_COMMENTS_TAB" /> <xs:enumeration value="SELECT_FAVORITES_TAB" /> <xs:enumeration value="COMPARE_CHART" /> <xs:enumeration value="QUIT_COMPARATIVE_MODE" /> <xs:enumeration value="QUIT_FULLDISPLAY_MODE" /> <xs:enumeration value="CLOSE_ARTEFACT_TREE_FILTER" /> <xs:enumeration value="SHOW_ARTEFACT_TREE_FILTER" /> <xs:enumeration value="OPEN_TABLE" /> <xs:enumeration value="CHANGE_PAGE" /> <xs:enumeration value="CREATE_NEW_PROJECT" /> <xs:enumeration value="SELECT_WIZARD" /> <xs:enumeration value="VALIDATE_WIZARD" /> <xs:enumeration value="VALIDATE_INFORMATION" /> <xs:enumeration value="VALIDATE_DP_OPTIONS" /> <xs:enumeration value="RUN_PROJECT_CREATION" /> <xs:enumeration value="OPEN_SUB_MENU_HELP" /> <xs:enumeration value="CLOSE_TUTORIAL_POPUP" /> <xs:enumeration value="OPEN_TUTORIAL_POPUP" /> <xs:enumeration value="NONE" /> </xs:restriction> </xs:simpleType> <xs:simpleType name="alias"> <xs:restriction base="xs:string"> <xs:enumeration value="CUSTOM" /> <xs:enumeration value="BODY" /> <xs:enumeration value="BREADCRUMBS" /> <xs:enumeration value="MENU_HELP" /> <xs:enumeration value="SUB_MENU_HELP" /> <xs:enumeration value="SUB_MENU_HELP_ROW" /> <xs:enumeration value="SUB_MENU_HELP_ROW_FIRST" /> <xs:enumeration value="TUTORIAL_POPUP" /> <xs:enumeration value="TUTORIAL_POPUP_MODEL" /> <xs:enumeration value="TUTORIAL_POPUP_MODEL_FIRST" /> <xs:enumeration value="TUTORIAL_POPUP_TUTORIAL_NAME" /> <xs:enumeration value="TUTORIAL_POPUP_TUTORIAL_NAME_FIRST" /> <xs:enumeration value="TUTORIAL_POPUP_TUTORIAL_DESCR" /> <xs:enumeration value="TUTORIAL_POPUP_TUTORIAL_DESCR_FIRST" /> <xs:enumeration value="EXPLORER" /> <xs:enumeration value="DRILLDOWN" /> <xs:enumeration value="EXPLORER_TAB" /> <xs:enumeration value="ARTEFACT_TREE" /> <xs:enumeration value="MEASURE_TREE" /> <xs:enumeration value="EXPLORER_HEADER" /> <xs:enumeration value="PORTFOLIO_HEADER" /> <xs:enumeration value="ARTEFACT_TREE_SEARCH" /> <xs:enumeration value="ARTEFACT_TREE_FILTER" /> <xs:enumeration value="REVIEW_SET" /> <xs:enumeration value="PORTFOLIO_TREE" /> <xs:enumeration value="PORTFOLIO_TREE_PROJECT" /> <xs:enumeration value="PORTFOLIO_TREE_PROJECT_FIRST" /> <xs:enumeration value="MODEL_DASHBOARD" /> <xs:enumeration value="MODEL_CHARTS" /> <xs:enumeration value="MODEL_CHART_FIRST" /> <xs:enumeration value="MODEL_TABLE" /> <xs:enumeration value="MODEL_TABLE_ROW_FIRST" /> <xs:enumeration value="MODEL_CHART" /> <xs:enumeration value="MODEL_TABLE_ROW" /> <xs:enumeration value="MODEL_CHART_POPUP" /> <xs:enumeration value="MODEL_CHART_POPUP_GRAPH" /> <xs:enumeration value="MODEL_CHART_POPUP_PREVIOUS_ARROW" /> <xs:enumeration value="MODEL_CHART_POPUP_NEXT_ARROW" /> <xs:enumeration value="MODEL_CHART_POPUP_NAV_BAR" /> <xs:enumeration value="MODEL_CHART_POPUP_ASIDE" /> <xs:enumeration value="MODEL_CHART_POPUP_ASIDE_HEAD" /> <xs:enumeration value="MODEL_CHART_POPUP_DESCR" /> <xs:enumeration value="FILTER_POPUP" /> <xs:enumeration value="FILTER_LEVEL" /> <xs:enumeration value="FILTER_TYPE" /> <xs:enumeration value="FILTER_EVOLUTION" /> <xs:enumeration value="FILTER_STATUS" /> <xs:enumeration value="ARTEFACT_TREE_LEAF" /> <xs:enumeration value="MEASURE_TREE_LEAF" /> <xs:enumeration value="MENU_INDICATOR_ARTEFACT" /> <xs:enumeration value="DASHBOARD " /> <xs:enumeration value="SCORECARD" /> <xs:enumeration value="KPI" /> <xs:enumeration value="CHARTS" /> <xs:enumeration value="TABLES" /> <xs:enumeration value="CHART_FIRST" /> <xs:enumeration value="LINE" /> <xs:enumeration value="CHART" /> <xs:enumeration value="CHART_FIRST" /> <xs:enumeration value="TABLE" /> <xs:enumeration value="TABLE_FIRST" /> <xs:enumeration value="MEASURE_POPUP" /> <xs:enumeration value="MEASURE_POPUP_CONTENT" /> <xs:enumeration value="MEASURE_POPUP_LEVELS" /> <xs:enumeration value="MEASURE_POPUP_ROW_FIRST" /> <xs:enumeration value="MEASURE_POPUP_ROW" /> <xs:enumeration value="CHART_POPUP" /> <xs:enumeration value="CHART_POPUP_GRAPH" /> <xs:enumeration value="CHART_POPUP_COMPARE_OPTION" /> <xs:enumeration value="CHART_POPUP_PREVIOUS_ARROW" /> <xs:enumeration value="CHART_POPUP_NEXT_ARROW" /> <xs:enumeration value="CHART_POPUP_NAV_BAR" /> <xs:enumeration value="CHART_POPUP_ASIDE" /> <xs:enumeration value="CHART_POPUP_ASIDE_HEAD" /> <xs:enumeration value="CHART_POPUP_DESCR" /> <xs:enumeration value="CHART_POPUP_COMMENTS" /> <xs:enumeration value="CHART_POPUP_FAVORITES" /> <xs:enumeration value="CHART_POPUP_COMPARATIVE_CHART" /> <xs:enumeration value="ACTION_ITEMS" /> <xs:enumeration value="ACTION_ITEMS_TABLE" /> <xs:enumeration value="ACTION_ITEMS_TABLE_HEAD" /> <xs:enumeration value="ACTION_ITEMS_TABLE_HEAD_CHECK" /> <xs:enumeration value="ACTION_ITEMS_ADD_REVIEW_SET" /> <xs:enumeration value="ACTION_ITEMS_EXPORT_LIST" /> <xs:enumeration value="ACTION_ITEMS_EXPORT_BUTTON" /> <xs:enumeration value="ACTION_ITEMS_SEARCH" /> <xs:enumeration value="ACTION_ITEMS_ROW" /> <xs:enumeration value="ACTION_ITEMS_REASON" /> <xs:enumeration value="ACTION_ITEMS_ADVANCED_SEARCH" /> <xs:enumeration value="ACTION_ITEMS_ADVANCED_SEARCH_SELECT_FIRST" /> <xs:enumeration value="ACTION_ITEMS_ADVANCED_SEARCH_SELECT" /> <xs:enumeration value="HIGHLIGHTS" /> <xs:enumeration value="HIGHLIGHTS_TABLE" /> <xs:enumeration value="HIGHLIGHTS_TABLE_HEAD" /> <xs:enumeration value="HIGHLIGHTS_TABLE_HEAD_CHECK" /> <xs:enumeration value="HIGHLIGHTS_SEARCH" /> <xs:enumeration value="HIGHLIGHTS_SEARCH_FILTER" /> <xs:enumeration value="HIGHLIGHTS_SEARCH_TYPE" /> <xs:enumeration value="HIGHLIGHTS_EXPORT_BUTTON" /> <xs:enumeration value="HIGHLIGHTS_ADD_REVIEW_SET" /> <xs:enumeration value="HIGHLIGHTS_ROW_FIRST" /> <xs:enumeration value="FINDINGS" /> <xs:enumeration value="FINDINGS_TABLE" /> <xs:enumeration value="FINDINGS_TABLE_HEAD" /> <xs:enumeration value="FINDINGS_SEARCH" /> <xs:enumeration value="FINDINGS_INFO" /> <xs:enumeration value="FINDINGS_RULE" /> <xs:enumeration value="FINDINGS_ARTEFACT" /> <xs:enumeration value="FINDINGS_ROW_FIRST" /> <xs:enumeration value="FINDINGS_ADVANCED_SEARCH" /> <xs:enumeration value="FINDINGS_ADVANCED_SEARCH_SELECT_FIRST" /> <xs:enumeration value="FINDINGS_ADVANCED_SEARCH_SELECT" /> <xs:enumeration value="REPORTS" /> <xs:enumeration value="REPORTS_REGION" /> <xs:enumeration value="REPORTS_OPTIONS" /> <xs:enumeration value="REPORTS_OPTION_TEMPLATE" /> <xs:enumeration value="REPORTS_OPTION_FORMAT" /> <xs:enumeration value="REPORTS_OPTION_SYNTHETIC_VIEW" /> <xs:enumeration value="REPORTS_CREATE" /> <xs:enumeration value="EXPORT_REGION" /> <xs:enumeration value="EXPORT_OPTIONS" /> <xs:enumeration value="EXPORT_CREATE" /> <xs:enumeration value="FORMS" /> <xs:enumeration value="FORMS_ATTRIBUTE" /> <xs:enumeration value="FORMS_ATTRIBUTE_FIELD" /> <xs:enumeration value="FORMS_ATTRIBUTE_COMMENT" /> <xs:enumeration value="FORMS_HISTORY" /> <xs:enumeration value="FORMS_BLOCK" /> <xs:enumeration value="INDICATORS" /> <xs:enumeration value="INDICATORS_TABLE" /> <xs:enumeration value="INDICATORS_TABLE_HEAD" /> <xs:enumeration value="INDICATORS_ROW" /> <xs:enumeration value="MEASURES" /> <xs:enumeration value="MEASURES_TABLE" /> <xs:enumeration value="MEASURES_TABLE_HEAD" /> <xs:enumeration value="MEASURES_ROW" /> <xs:enumeration value="COMMENTS" /> <xs:enumeration value="COMMENTS_TABLE" /> <xs:enumeration value="COMMENTS_TABLE_HEAD" /> <xs:enumeration value="COMMENTS_ROW" /> <xs:enumeration value="CREATE_PROJECT_BUTTON" /> <xs:enumeration value="WIZARD_PANEL" /> <xs:enumeration value="WIZARD_ROW" /> <xs:enumeration value="WIZARD_ROW_FIRST" /> <xs:enumeration value="WIZARD_NEXT_BUTTON" /> <xs:enumeration value="GENERAL_INFORMATION" /> <xs:enumeration value="PROJECT_IDENTIFICATION_BLOCK " /> <xs:enumeration value="GENERAL_INFO_BLOCK" /> <xs:enumeration value="GENERAL_INFO_ROW" /> <xs:enumeration value="PROJECT_NEXT_BUTTON" /> <xs:enumeration value="DP_PANEL" /> <xs:enumeration value="DP_PANEL_BLOCK" /> <xs:enumeration value="DP_PANEL_ROW" /> <xs:enumeration value="DP_PANEL_NEXT_BUTTON" /> <xs:enumeration value="CONFIRMATION_PANEL" /> <xs:enumeration value="SUMMARY" /> <xs:enumeration value="CONFIRMATION_PANEL_PARAMETERS" /> <xs:enumeration value="RUN_NEW_PROJECT_BUTTON" /> </xs:restriction> </xs:simpleType> <xs:simpleType name="colors"> <xs:union> <xs:simpleType> <xs:restriction base="xs:string"> <xs:pattern value="#[A-Fa-f0-9]{6}" /> </xs:restriction> </xs:simpleType> <xs:simpleType> <xs:restriction base="xs:string"> <xs:pattern value="(rgb|RGB)\([0-9]{3},[0-9]{3},[0-9]{3}\)" /> </xs:restriction> </xs:simpleType> <xs:simpleType> <xs:restriction base="xs:string"> <xs:enumeration value="aqua" /> <xs:enumeration value="black" /> <xs:enumeration value="blue" /> <xs:enumeration value="gray" /> <xs:enumeration value="lime" /> <xs:enumeration value="green" /> <xs:enumeration value="maroon" /> <xs:enumeration value="navy" /> <xs:enumeration value="olive" /> <xs:enumeration value="orange" /> <xs:enumeration value="purple" /> <xs:enumeration value="red" /> <xs:enumeration value="silver" /> <xs:enumeration value="teal" /> <xs:enumeration value="white" /> <xs:enumeration value="yellow" /> <xs:enumeration value="transparent" /> </xs:restriction> </xs:simpleType> </xs:union> </xs:simpleType> <xs:simpleType name="text-positions"> <xs:restriction base="xs:string"> <xs:enumeration value="INTERNAL" /> <xs:enumeration value="EXTERNAL" /> <xs:enumeration value="LEFT" /> <xs:enumeration value="RIGHT" /> <xs:enumeration value="TOP" /> <xs:enumeration value="BOTTOM" /> </xs:restriction> </xs:simpleType> <xs:simpleType name="phase-type"> <xs:restriction base="xs:string"> <xs:enumeration value="PARALLEL" /> <xs:enumeration value="PROGRESSIVE" /> <xs:enumeration value="SEQUENTIAL" /> <xs:enumeration value="FREE" /> </xs:restriction> </xs:simpleType> <xs:complexType name="elements"> <xs:sequence minOccurs="0" maxOccurs="unbounded"> <xs:element ref="help"/> </xs:sequence> </xs:complexType> <xs:element name="Bundle" type="elements" /> <xs:element name="Package" type="elements"/> <xs:element name="item"> <xs:complexType> <xs:attribute name="element" use="required" type="external-id" /> <xs:attribute name="param" use="optional" type="xs:string" /> <xs:attribute name="descrId" use="required" type="xs:string" /> <xs:attribute name="textPosition" use="optional" default="EXTERNAL" type="text-positions" /> <xs:attribute name="maskColor" use="optional" default="#2aa0d5" type="colors" /> <xs:attribute name="maskOpacity" use="optional" default="0.8" type="opacity" /> <xs:attribute name="textSize" use="optional" default="25" type="positive-integer" /> <xs:attribute name="textColor" use="optional" default="white" type="colors" /> </xs:complexType> </xs:element> <xs:element name="preAction"> <xs:complexType> <xs:attribute name="action" use="required" type="actions" /> <xs:attribute name="param" use="optional" default="" type="xs:string" /> <xs:attribute name="clickIndicator" use="optional" default="false" type="xs:boolean" /> </xs:complexType> </xs:element> <xs:element name="phase"> <xs:complexType> <xs:sequence maxOccurs="unbounded"> <xs:choice> <xs:element minOccurs="0" maxOccurs="unbounded" ref="item" /> <xs:element minOccurs="0" maxOccurs="unbounded" ref="preAction" /> </xs:choice> </xs:sequence> <xs:attribute name="element" use="required" type="external-id" /> <xs:attribute name="param" use="optional" type="xs:string" /> <xs:attribute name="type" use="optional" default="PARALLEL" type="phase-type" /> <xs:attribute name="textPosition" use="optional" default="EXTERNAL" type="text-positions" /> <xs:attribute name="textSize" use="optional" default="25" type="positive-integer" /> <xs:attribute name="textColor" use="optional" default="white" type="colors" /> <xs:attribute name="maskColor" use="optional" default="#2aa0d5" type="colors" /> <xs:attribute name="maskOpacity" use="optional" default="0.6" type="opacity" /> </xs:complexType> </xs:element> <xs:element name="help"> <xs:complexType> <xs:sequence minOccurs="1" maxOccurs="unbounded"> <xs:choice> <xs:element ref="phase" /> <xs:element ref="item" /> </xs:choice> </xs:sequence> <xs:attribute name="id" use="required" type="external-id" /> <xs:attribute name="opacity" use="optional" default="0.4" type="opacity" /> <xs:attribute name="textPosition" use="optional" default="EXTERNAL" type="text-positions" /> <xs:attribute name="textSize" use="optional" default="25" type="positive-integer" /> <xs:attribute name="textColor" use="optional" default="white" type="colors" /> <xs:attribute name="maskColor" use="optional" default="#2aa0d5" type="colors" /> <xs:attribute name="maskOpacity" use="optional" default="0.6" type="opacity" /> <xs:attribute name="firstConnexionGroup" use="optional" type="xs:string" /> <xs:attribute name="icon" use="optional" type="xs:string" /> </xs:complexType> </xs:element> </xs:schema>
<?xml version="1.0" encoding="UTF-8"?> <xs:schema xmlns:xs="http://www.w3.org/2001/XMLSchema" elementFormDefault="qualified"> <xs:simpleType name="id"> <xs:restriction base="xs:string"> <xs:pattern value='[A-Z_][A-Z0-9_]+' /> </xs:restriction> </xs:simpleType> <xs:simpleType name="list-id"> <xs:restriction base="xs:string"> <xs:pattern value='[A-Z_][A-Z0-9_]+(;[A-Z_][A-Z0-9_]+)*' /> </xs:restriction> </xs:simpleType> <xs:simpleType name="alignment"> <xs:restriction base="id"> <xs:enumeration value="LEFT"/> <xs:enumeration value="RIGHT"/> </xs:restriction> </xs:simpleType> <xs:simpleType name="project-status"> <xs:restriction base="id"> <xs:enumeration value="IGNORE"/> <xs:enumeration value="WARNING"/> <xs:enumeration value="ERROR"/> </xs:restriction> </xs:simpleType> <xs:element name="Bundle"> <xs:complexType> <xs:sequence> <xs:choice minOccurs="0" maxOccurs="unbounded"> <xs:element ref="tags"/> <xs:element ref="wizard"/> </xs:choice> </xs:sequence> </xs:complexType> </xs:element> <xs:element name="tags"> <xs:complexType> <xs:sequence> <xs:element minOccurs="0" maxOccurs="unbounded" ref="tag"/> </xs:sequence> <xs:attribute name="textAlign" type="alignment"/> <xs:attribute name="valueAlign" type="alignment"/> </xs:complexType> </xs:element> <xs:element name="tag"> <xs:complexType> <xs:sequence> <xs:element minOccurs="0" maxOccurs="unbounded" ref="value"/> </xs:sequence> <xs:attribute name="defaultValue"/> <xs:attribute name="displayType"/> <!-- Not display-type because it is case insensitive --> <xs:attribute name="group"/> <xs:attribute name="groupId" type="id"/> <xs:attribute name="measureId" use="required" type="id"/> <xs:attribute name="name"/> <xs:attribute name="placeholder"/> <xs:attribute name="required" type="xs:boolean"/> <xs:attribute name="review" type="xs:boolean"/> <xs:attribute name="suffix"/> <xs:attribute name="targetArtefactTypes" type="list-id"/> <xs:attribute name="textAlign" type="alignment"/> <xs:attribute name="type" use="required"/> <!-- Not tag-type because it is case insensitive --> <xs:attribute name="valueAlign" type="alignment"/> </xs:complexType> </xs:element> <xs:element name="value"> <xs:complexType> <xs:attribute name="key" use="required"/> <xs:attribute name="value" use="required" type="xs:decimal"/> </xs:complexType> </xs:element> <xs:element name="wizard"> <xs:complexType> <xs:sequence> <xs:choice minOccurs="0" maxOccurs="unbounded"> <xs:element ref="tags"/> <xs:element ref="milestones"/> <xs:element ref="repositories"/> <xs:element ref="tools"/> </xs:choice> </xs:sequence> <xs:attribute name="autoBaseline" type="xs:boolean"/> <xs:attribute name="group"/> <xs:attribute name="groups"/> <xs:attribute name="hideRulesEdition" type="xs:boolean"/> <xs:attribute name="img"/> <xs:attribute name="users"/> <xs:attribute name="versionPattern"/> <xs:attribute name="wizardId" use="required" type="id"/> <xs:attribute name="projectsSelection" type="xs:boolean"/> <xs:attribute name="name"/> </xs:complexType> </xs:element> <xs:element name="milestones"> <xs:complexType> <xs:sequence minOccurs="0"> <xs:element minOccurs="0" maxOccurs="unbounded" ref="goals"/> <xs:element minOccurs="0" maxOccurs="unbounded" ref="milestone"/> </xs:sequence> <xs:attribute name="canCreateMilestone" type="xs:boolean"/> <xs:attribute name="canCreateGoal" type="xs:boolean"/> <xs:attribute name="hide" type="xs:boolean"/> </xs:complexType> </xs:element> <xs:element name="goals"> <xs:complexType> <xs:sequence minOccurs="0"> <xs:element ref="goal"/> </xs:sequence> <xs:attribute name="displayableFamilies" use="required" type="list-id"/> </xs:complexType> </xs:element> <xs:element name="goal"> <xs:complexType> <xs:attribute name="mandatory" use="required" type="xs:boolean"/> <xs:attribute name="measureId" use="required" type="id"/> </xs:complexType> </xs:element> <xs:element name="milestone"> <xs:complexType> <xs:sequence> <xs:element ref="defaultGoal"/> </xs:sequence> <xs:attribute name="id" use="required" type="id"/> <xs:attribute name="mandatory" type="xs:boolean"/> </xs:complexType> </xs:element> <xs:element name="defaultGoal"> <xs:complexType> <xs:attribute name="measureId" use="required" type="id"/> <xs:attribute name="value" use="required" type="xs:integer"/> </xs:complexType> </xs:element> <xs:element name="repositories"> <xs:complexType> <xs:sequence> <xs:element minOccurs="0" maxOccurs="unbounded" ref="repository"/> </xs:sequence> <xs:attribute name="all" use="required" type="xs:boolean"/> <xs:attribute name="hide" use="required" type="xs:boolean"/> </xs:complexType> </xs:element> <xs:element name="repository"> <xs:complexType> <xs:sequence> <xs:element minOccurs="0" ref="param"/> </xs:sequence> <xs:attribute name="checkedInUI" type="xs:boolean"/> <xs:attribute name="name" use="required"/> </xs:complexType> </xs:element> <xs:element name="tools"> <xs:complexType> <xs:sequence> <xs:element minOccurs="0" maxOccurs="unbounded" ref="tool"/> </xs:sequence> <xs:attribute name="all" type="xs:boolean"/> <xs:attribute name="expandedInUI" type="xs:boolean"/> </xs:complexType> </xs:element> <xs:element name="tool"> <xs:complexType> <xs:sequence> <xs:element minOccurs="0" maxOccurs="unbounded" ref="param"/> </xs:sequence> <xs:attribute name="checkedInUI" type="xs:boolean"/> <xs:attribute name="expandedInUI" type="xs:boolean"/> <xs:attribute name="name" use="required"/> <xs:attribute name="optional" type="xs:boolean"/> <xs:attribute name="projectStatusOnFailure" type="project-status"/> <xs:attribute name="projectStatusOnWarning" type="project-status"/> </xs:complexType> </xs:element> <xs:element name="param"> <xs:complexType> <xs:attribute name="availableChoices"/> <xs:attribute name="name" use="required"/> <xs:attribute name="value"/> <xs:attribute name="hide" type="xs:boolean"/> </xs:complexType> </xs:element> </xs:schema>
Table of Contents
For more information about External Tools, consult the section called “External Tools”.
=========================
= Generic External Tool =
=========================
This default external tool provides a basic framework for creating users, groups, roles, profiles and projects.
In order to create an external tool based on this Generic tool, you need to create 4 files:
- config.tcl (optional) allows to override default options
- form.xml, with a baseName="Generic" attribute
- form_en.properties, where you externalise the strings displayed in the user interface (and optionally a form_fr.properties file where you translate those strings)
- execute.tcl, where you get the variables defined in form.xml and config.tcl and run your script
==============
= config.tcl =
==============
The contents of this file overrides default values, for the variable jar, commands and url:
set jar "$squore_home/lib/squore-engine.jar"
set commands "DELEGATE_CREATION"
set url "http://[server]:[port]/SQuORE_Server" #dynamically obtained from the server installation
If the above default values are OK, you do not need a config.tcl file.
============
= form.xml =
============
This file is like any other form.xml, but will have to contain the credential part if the create_project pro is called.
===============
= execute.tcl =
===============
This file is normal tcl file. The following proc are predefined:
* read_err msg: sends a message to the log flagged as an error
* read_out msg: sends a message to the log flagged as an info
* create_project args: creates a project.
The following arguments are automatically set and should not be passed to create_projet:
-Dsquore.home.dir
-jar
--url
--commands
--login
--password
The proc returns 1 in case of success and 0 otherwise.
* create_group name ?profiles?
* create_user [-name user_name] [-mail email] [-locale locale] login password ?groups? ?profiles?
* create_profile name
* create_role name
* add_permission name target action
==================
= Example Script =
==================
# set "demo" as password
set pwd {ieSV55Qc+eQOaYDRSha/AjzNTJE=}
create_user -name {Augustus Hill} -mail augustus.hill@domain.com -locale en augustus $pwd [list admin users]
create_role HEAD_OF_DEPARTMENT
add_permission HEAD_OF_DEPARTMENT PROJECTS VIEW
add_permission HEAD_OF_DEPARTMENT PROJECTS MANAGE
add_permission HEAD_OF_DEPARTMENT PROJECTS BASELINE
add_permission HEAD_OF_DEPARTMENT PROJECTS VIEW_DRAFTS
add_permission HEAD_OF_DEPARTMENT ACTION_ITEMS MODIFY
add_permission HEAD_OF_DEPARTMENT ATTRIBUTES MODIFY
add_permission HEAD_OF_DEPARTMENT SOURCE_CODE VIEW
add_permission HEAD_OF_DEPARTMENT ARTEFACTS MODIFY
create_project --name=Earth --wizardId=RISK -r type=FROMPATH,path=$squore_home/samples/c/Earth/V1 --teamUser=augustus,HEAD_OF_DEPARTMENTTable of Contents
sqexport.pl — Squore export utility
sqexport.pl [
option
...]
versions
-m
[
-l
] [
-u
]
uid
id_model
sqexport.pl [
option
...]
versions
-p
[
-l
] [
-u
]
uid
id_project
sqexport.pl [
option
...]
artefacts
-m
[
-R
] [
--add-measure
...] [
measure
-T
...] [
type
-L
] [
level
-u
]
uid
id_model
sqexport.pl [
option
...]
artefacts
-p
[
-R
|
-r
] [
id_rvers
--add-measure
...] [
measure
-T
...] [
type
-L
] [
level
-u
]
uid
id_project
id_vers
The sqexport.pl script connects to the Squore database and exports data into the CSV format.
This command extracts raw data from the database. That is, it does not read i18n files or model properties to translate strings.
Columns common to the
versions
and
artefacts
exports are:
model_id - the database identifier of the model (verbose mode only).
model - the model name.
app_id - the database identifier of the project (verbose mode only).
app_name - the project name.
root_id - the database identifier of the root artefact (verbose mode only).
v_id - the database identifier of the version (verbose mode only).
v_name - the version name.
These additional columns are exported:
status - the project's version status.
sl_rank - the (numeric) rank of the level of the project.
level - the level of the project.
app_name - The project name.
sqexport.pl
versions
-m
[
-l
] [
-u
]
uid
id_model
This form exports all versions of projects that use the model identified
by id_model. If -l is used, only the
last version of each project is exported.
The uid is used to restrict output data,
using access controls defined in Squore. If not supplied, versions and
projects are exported regardless of access control lists.
sqexport.pl
versions
-p
[
-l
] [
-u
]
uid
id_project
This form exports all versions of the project identified by
id_project. If -l is used, only
the last version of the project is exported.
The uid is used to restrict output data,
using access controls defined in Squore. If not supplied, versions and
projects are exported regardless of access control lists.
These additional columns are exported:
art_id - the database identifier of the artefact.
art_path - the path of the artefact.
art_name - the name of the artefact.
type - the type of the artefact.
sl_rank - the (numeric) rank of the level of the artefact.
level - the level of the artefact.
trend - the trend of the artefact, compared to
the reference version (with -R or -r
only). Values are 'N' for new artefacts, '^' for artefacts that improved,
'v' for artefacts that regressed, and '=' for others.
* - the measure values, as specified with
the --add-measure options.
sqexport.pl
artefacts
-m
[
-R
] [
--add-measure
...] [
measure
-T
...] [
type
-L
] [
level
-u
]
uid
id_model
Exports all artefacts of the id_model model,
eventually filtered out by the -T and -L
filters. Both parameters of these options are identifiers of the types and
the level, as specified in the model. This is possible to specify types
separated by a comma, or multiple -T options. Such types
are then OR-ed.
Only artefacts that belong to the last version of projects are exported.
If the -R option is set, the trend of levels of artefacts is
computed against the last but one version of the projects. By default, there
is no trend computation.
Use the --add-measure option to specify the list of measures
to add to the output. Use with caution on large result sets.
The uid is used to restrict output data,
using access controls defined in Squore. If not supplied, artefacts are
exported, regardless of access control lists.
sqexport.pl
artefacts
-p
[
-R
|
-r
] [
id_rvers
--add-measure
...] [
measure
-T
...] [
type
-L
] [
level
-u
]
uid
id_project
id_vers
This form exports artefacts of the id_project project
in its id_vers version. If id_vers
is not specified, the last version if the project is used. Artefacts may be
filtered out with the -T and
type
-L options.level
The reference version to compute trends of levels of artefacts is either set
with -R (use the version right before id_vers),
or with -r to set an explicit
version of the project.id_rvers
Use the --add-measure option to specify the list of measures
to add to the output. Use with caution on large result sets.
The uid is used to restrict output data,
using access controls defined in Squore. If not supplied, artefacts are
exported, regardless of access control lists.
These options are common to all export types.
-h host
Overrides the database host name.
-p port
Overrides the database port number.
-d dbname
Overrides the database name.
-u user
Overrides the database user name.
-f file
Set the CSV output file. If not specified, the output is written to the standard output.
-s sep
Set the CSV separator. Defaults to the ';' character.
-S slices
Specifies a subset of columns to write, starting from 0. The column numbering is computed against the verbose mode, not the standard mode. Separate column numbers with the ',' character.
-v
Turns on the verbose mode. Exports additional columns (mainly internal database ids), and displays some SQL and post processing timings.
-a
Turns on export at the artefact level.
-m
Turns on export at the model level.
-p
Turns on export at the project level.
-c
Counts entries only, do not list all of them.
-l
Exports the last version of each project only.
-R
Set the reference version for delta or trend computations to the last but one version of the project, from either its last version, or the user supplied version.
-r id_rvers
Set the reference version for delta or trend computations to
the version pointed to by the id_rvers.
-T type
...
Filter artefacts of types type, which is
the external id of the artefact type, as specified by the model,
like APPLICATION, CLASS, FUNCTION, etc. Types may be coma separated.
-L level
Artefacts shall have the level level,
which is the external id of the level of performance of a scale, as
specified by the model, like LEVELA, LEVELB, etc.
With the introduction milestones in your project, Squore offers new ways to measure your objectives and detect deviations from your goals early. Milestones are a series of goals for specific metrics at certain dates in the life of your project and add the following to your process management:
You are alerted early if your current performance shows that you will not meet your goals and can react before it is too late
You keep track of your various goals and communicate any change to the rest of your team
You can reflect on a project's history and learn from it
This example focuses on a project that is slipping, and shows how the team reacts along the course of the development process. Our team is tracking several objectives around issue management, technical debt and self-descriptiveness over the lifetime of the project, which includes milestones for 5 sprints labelled SPRINT1 to SPRINT5.
Here is where they stand in the fourth sprint and try to assess whether they will meet their Technical Debt objective for the release date at the end of Sprint 5:
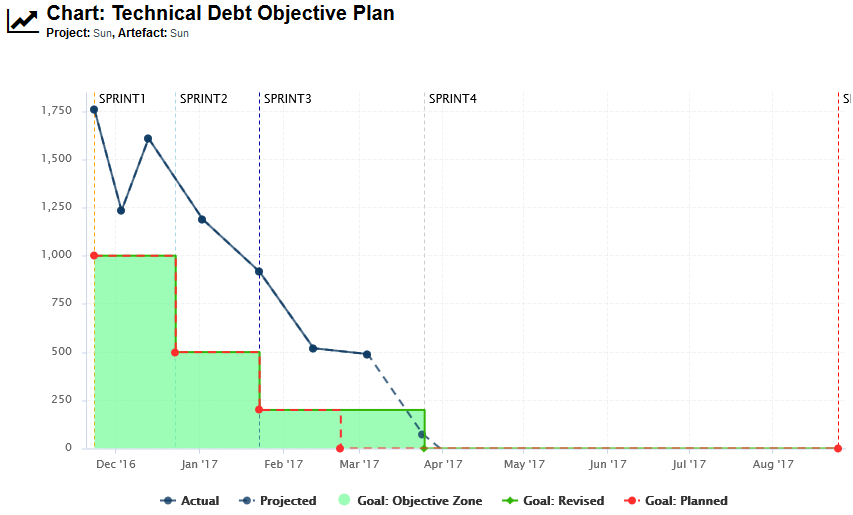
The chart shows the following information:
Vertical dotted lines (markers) on the x-axis for each milestone in the project at the predefined date
A solid dark-blue line showing the technical debt value for each version of the project so far
A dotted dark-blue line showing estimations for technical debt for future versions absed on the progress so far
A dotted red line showing the goals set at the beginning of the project for each sprint for the technical debt metric
A solid green line showing the goals as they were revised as time went on (the date for Sprint 4 was moved back).
A turquoise area highlighting the acceptable range for the tehnical debt for each sprint, making it clear that the technical debt has never been under control so far, but that projections show that the goal should be met by the end of Sprint 3
In order to understand why changes were made to the goals, let's go back to V4 and look at the Technical Debt Objective Plan again. The end of Sprint4 still has its original date, and projections aready show that technical debt will not be under control by the end of the sprint.
Our chart is configured to show the projected value for the next 5 analyses (based on the rate of previous analyses), and the firth projection meeting the expectations for SPRINT4 appear well after the original date for SPRINT4.
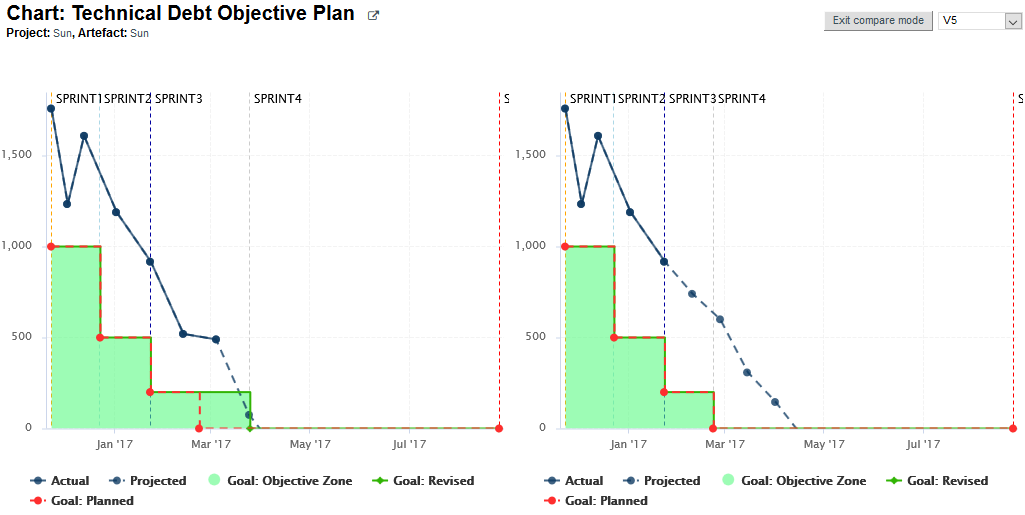
The team knew this at the time: a Objective alert for Technical Debt action item was opened on as early as V3 to inform them that the current performance could cause problems for their objective set 50 days later.
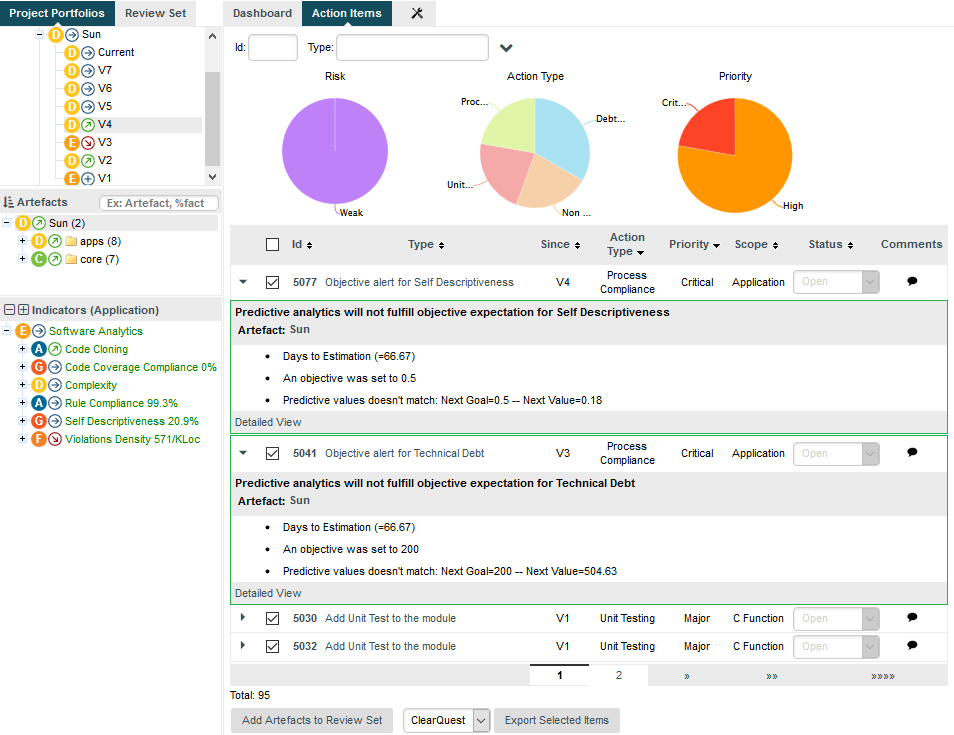
After a team meeting, it is decided that the best course of action is to keep the goal for the SPRINT4 milestone, but move its date back by one month. The next analysis confirms this on the Technical Debt Objective plan chart, where you see the first deviation between the planned goal (red) and the actual goal (green). The progress objective will be now met:
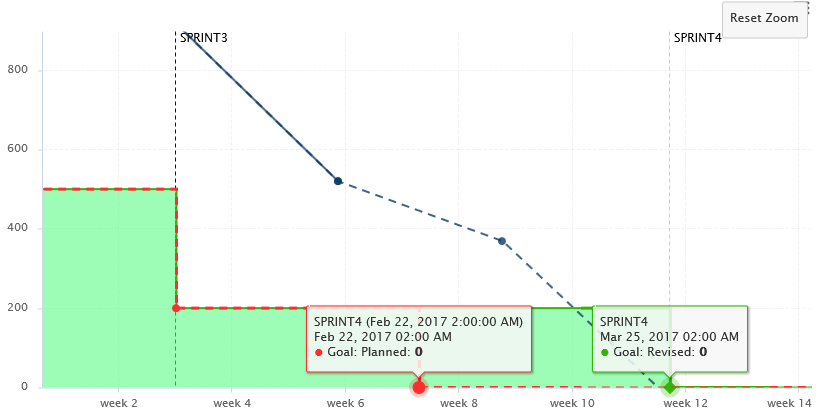
In order to add support for milestones to your model, configure your wizard to allow users to create milestones and goals:
<Bundle xmlns:xi="http://www.w3.org/2001/XInclude"> <wizard wizardId="ANALYTICS" versionPattern="v#N1#" img="../../Shared/Wizards/squore_logo.png" hideRulesEdition="FALSE"> <milestones canCreateMilestone="TRUE" canCreateGoal="TRUE"> <goals displayableFamilies="ANALYTICS_GOALS" /> </milestones> </wizard> </Bundle>
The
milestones
element allows users to create milestones in
the project wizard (canCreateMilestone="TRUE") and also set goals (canCreateGoal="TRUE").
The goals can be set for metrics of the GOALS family only in this example (displayableFamilies="ANALYTICS_GOALS").
The result in the web UI is the following:
A wizard allowing users to create milestones freely during an analysis
When creating a new project, a user decides to create a Sprint 1 milestone with one objective of 500 for the Technical Debt indicator. Other goals can be set, for the other metrics in the project that belong to the ANALYTICS_GOALS family listed in the dropdown list at the bottom of the table.
If you have company-wide milestones and objectives that need to be set for every project created with the wizard, you can specify the goals directly. Milestones can also be marked as mandatory or optional:
<Bundle xmlns:xi="http://www.w3.org/2001/XInclude"> <wizard wizardId="ANALYTICS_WITH_MILESTONES" versionPattern="v#N1#" img="../../Shared/Wizards/squore_logo.png" hideRulesEdition="FALSE"> <milestones canCreateMilestone="TRUE" canCreateGoal="TRUE"> <goals displayableFamilies="GOALS"> <goal measureId="TECH_DEBT" mandatory="TRUE" highestIsBest="FALSE" /> <goal measureId="ISSUE_BLOCKER" mandatory="TRUE" highestIsBest="TRUE" /> <goal measureId="ISSUE_CRITICAL" mandatory="TRUE" highestIsBest="TRUE" /> <goal measureId="ROKR_SUBSET" mandatory="TRUE" highestIsBest="FALSE" /> </goals> <milestone id="REQUIREMENT_FREEZE" mandatory="TRUE"> <defaultGoal measureId="TECH_DEBT" value="0" /> <defaultGoal measureId="ISSUE_BLOCKER" value="1" /> <defaultGoal measureId="ISSUE_CRITICAL" value="30" /> <defaultGoal measureId="ROKR_SUBSET" value="1" /> </milestone> <milestone id="INFRASTRUCTURE_FREEZE" mandatory="TRUE"> <defaultGoal measureId="TECH_DEBT" value="0" /> <defaultGoal measureId="ISSUE_BLOCKER" value="1" /> <defaultGoal measureId="ISSUE_CRITICAL" value="50" /> <defaultGoal measureId="ROKR_SUBSET" value="1" /> </milestone> <milestone id="CODE_FREEZE" mandatory="TRUE"> <defaultGoal measureId="TECH_DEBT" value="0" /> <defaultGoal measureId="ISSUE_BLOCKER" value="1" /> <defaultGoal measureId="ISSUE_CRITICAL" value="90" /> <defaultGoal measureId="ROKR_SUBSET" value="0.5" /> </milestone> <milestone id="BETA_RELEASE" mandatory="FALSE"> <defaultGoal measureId="TECH_DEBT" value="1" /> <defaultGoal measureId="ISSUE_BLOCKER" value="1" /> <defaultGoal measureId="ISSUE_CRITICAL" value="95" /> <defaultGoal measureId="ROKR_SUBSET" value="0.3" /> </milestone> <milestone id="RELEASE" mandatory="TRUE"> <defaultGoal measureId="TECH_DEBT" value="1" /> <defaultGoal measureId="ISSUE_BLOCKER" value="1" /> <defaultGoal measureId="ISSUE_CRITICAL" value="100" /> <defaultGoal measureId="ROKR_SUBSET" value="0" /> </milestone> </milestones> </wizard> </Bundle>
When creating a new project, the predefined goals are filled in in the web interface, and you can still add a Beta Release milestone (using the default values specified in the wizard bundle) if needed by using the + icon:
A project wizard with preconfigured milestones and goals
If you create projects using the command line interface, you can specify settings for your milestones with the -M parameter:
-M "id=BETA_RELEASE,date=2017/05/31,ISSUE_CRITICAL=95"
or with a project config file:
<SquoreProjectSettings> <Wizard> <Milestones> <Milestone id="BETA_RELEASE" date="2017-05-31"> <Goal id="ISSUE_CRITICAL" value="95" /> </Milestone> </Milestones> </Wizard> </SquoreProjectSettings>
In your analysis model, new functions are available to work with milestones and projections:
Checks if a milestone with the specified milestoneId exists in the project. The function returns 0 if no milestone is found, 1 if a milestone is found.
Find if we are at the last milestone of the project:
IS_LAST_MILESTONE=IF(HAS_MILESTONE(),0,1)
Returns the date associated to a milestone.
Find if the date for the milestone BETA_RELEASE has been modified between June 2015 and now:
DATE_HAS_SLIPPED=(DATE_MILESTONE(BETA_RELEASE)-DATE_MILESTONE(BETA_RELEASE, DATE(2015,06,01))) != 0
Compute the date difference between the previous and next milestones:
MILESTONE_DURATION=DATE_MILESTONE(NEXT) - DATE_MILESTONE(PREVIOUS)
Find the date slip for the next milestone between now and the previous anlaysis:
DATE_SLIP=DATE_MILESTONE(NEXT) - DATE_MILESTONE(NEXT, VERSION_DATE(PREVIOUS))
Find the amount of time left until the next milestone:
DEADLINE=DATE_MILESTONE(NEXT) - VERSION_DATE()
Returns the goal for a metric at the specified milestone.
Find the goal for requirement stability set for the milestone PROTOTYPE as of June 2016:
REQ_STABILITY_GOAL=GOAL(REQ_STABILITY, PROTOTYPE, DATE(2016,06,01))
Find the delta between the goal for TEST between the previous and next milestones:
DELTA=GOAL(TEST) - GOAL(TEST, PREVIOUS)
Find the delta between the goal for TEST for the next milestone set for the previous analysis and now:
DELTA=GOAL(TEST) - GOAL(TEST, NEXT, VERSION_DATE(PREVIOUS))
Find the delta between the current value of TEST and the goal for TEST at the next milestone:
DELTA=GOAL(TEST) - TEST
You can use keywords instead of using a milestone ID. You can retrieve information about the next, previous, first or last milestones in the project by using:
NEXT
NEXT+STEP
where STEP is a number indicating how many milestones to jump ahead
PREVIOUS
PREVIOUS-STEP
where STEP is a number indicating how many milestones to jump backward
FIRST
LAST
Consut the Configuration Guide for more details.
On your charts, you are now able to:
Display the goals defined for each milestone in your project
Display the changes made to the goals defined for each milestone
Display the date changes for your milestones
Show markers for milestone dates and goals
You can also compute metrics with functions like LEAST_SQUARE_FIT(), which lets you calculate projections. This is how the Task Completion chart used in this example was created. You can find its full definition below:
<chart id="OBJECTIVE_TECH_DEBT" type="TE" byTime="true" dateFormat="MM/yy" yMin="0" displayOnlyIf="HAD_GOAL_TECH_DEBT"> <dataset renderer="LINE"> <measure dataBounds="[0;[" color="#0B3861" stroke="SOLID" shape="CIRCLE" alpha="200" label="Actual">TECH_DEBT</measure> <measure color="#0B3861" stroke="DOTTED" shape="CIRCLE" alpha="200" label="Projected">TECH_DEBT <forecast> <estimatedVersion timeValue="CUR_BUILD_DATE+1*DELTA_MEAN"/> <estimatedVersion timeValue="CUR_BUILD_DATE+2*DELTA_MEAN"/> <estimatedVersion timeValue="CUR_BUILD_DATE+3*DELTA_MEAN"/> <estimatedVersion timeValue="CUR_BUILD_DATE+4*DELTA_MEAN"/> <estimatedVersion timeValue="CUR_BUILD_DATE+5*DELTA_MEAN"/> </forecast> </measure> </dataset> <dataset renderer="AREA_STEP"> <goal dataBounds="[0;[" color="88,250,130" stroke="SOLID" shape="DIAMOND" alpha="150" label="Objective Zone">TECH_DEBT</goal> </dataset> <dataset renderer="STEP"> <goal dataBounds="[0;[" color="#31B404" stroke="SOLID" shape="DIAMOND" alpha="255" label="Revised">TECH_DEBT</goal> <goal dataBounds="[0;[" color="#FE2E2E" stroke="DOTTED" shape="CIRCLE" alpha="255" label="Planned" versionDate="FIRST_BUILD_DATE">TECH_DEBT</goal> </dataset> <markers> <marker alpha="150" color="189,189,189" isVertical="false" endValue="0"/> <marker fromMilestones="true" alpha="150" isVertical="true" stroke="DOTTED" /> </markers> </chart>
The action items monitoring the project's progress also make use of the new GOAL() function and were defined as follows:
<?xml version="1.0" encoding="utf-8" standalone="yes"?> <Bundle> <DecisionCriteria> (...) <DecisionCriterion dcId="AI_OBJECTIVE_IN_FUTURE_TECH_DEBT" categories="SCALE_PRIORITY.CRITICAL;SCALE_AI_TYPE.PROCESS_IMPROVEMENT" targetArtefactTypes="APPLICATION"> <Triggers> <Trigger> <Test expr="GOAL_ESTIMATED_TECH_DEBT-ESTIMATED_TECH_DEBT" bounds="];0[" descrId="GOAL_WILL_NOT_BE_REACHED" p0="#{MEASURE.GOAL_ESTIMATED_TECH_DEBT}" p1="#{MEASURE.ESTIMATED_TECH_DEBT}" /> <Test expr="GOAL_TECH_DEBT" bounds="[1;1]" descrId="GOAL_IS_ACTIVATED" p0="#{MEASURE.GOAL_ESTIMATED_TECH_DEBT}" /> <Test expr="DAY_TO_ESTIMATION" bounds="];[" descrId="DAY_TO_ESTIMATION" p0="#{MEASURE.DAY_TO_ESTIMATION}" /> </Trigger> </Triggers> </DecisionCriterion> </DecisionCriteria> </Bundle>
Check out the Getting Started Guide and the Configuration Guide to learn everything about milestones in Squore.