| > Show on single page > Show on multiple pages |
Some charts (Simple Pie and Simple Bar) support dynamically grouping target artefacts according to textual information
in a measure. In order to use this information, you do not use an indicator
or
measure
element but an info
element with the measure holding the
text information.
Here is a sample definition for a Simple Bar chart where each bar is labelled according to the textual information
held in the ASSIGNEE metric.
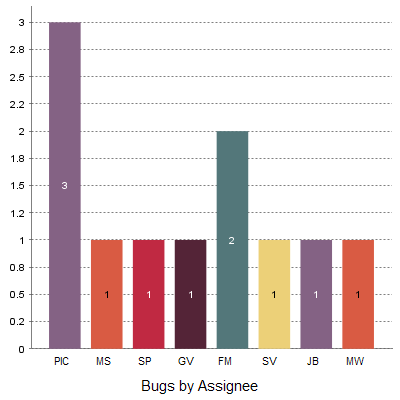
A Simple Bar chart using textual information from ISSUE child artefacts to dynamically display its bars.
<chart 	type="SimpleBar"
	id="ASSIGNEE_DISTRIBUTION"
	width="400"
	height="400"
	targetArtefactTypes="ISSUES"
	decimals="0">
	<info>ASSIGNEE</info>
</chart>