| > Show on single page > Show on multiple pages |
Copyright © 2015 Squoring Technologies
Licence
No part of this publication may be reproduced, transmitted, stored in a retrieval system, nor translated into any human or computer language, in any form or by any means, electronic, mechanical, magnetic, optical, chemical, manual or otherwise, without the prior written permission of the copyright owner, Squoring Technologies.
Squoring Technologies reserves the right to revise this publication and to make changes from time to time without obligation to notify authorised users of such changes. Consult Squoring Technologies to determine whether any such changes have been made.
The terms and conditions governing the licensing of Squoring Technologies software consist solely of those set forth in the written contracts between Squoring Technologies and its customers.
All third-party products are trademarks or registered trademarks of their respective companies.
Warranty
Squoring Technologies makes no warranty of any kind with regard to this material, including, but not limited to, the implied warranties of merchantability and fitness for a particular purpose. Squoring Technologies shall not be liable for errors contained herein nor for incidental or consequential damages in connection with the furnishing, performance or use of this material.
Abstract
This edition of the Configuration Guide applies to Squore 15-A-SP2 and to all subsequent releases and modifications until otherwise indicated in new editions.
Table of Contents
List of Tables
Table of Contents
This document was released by Squoring Technologies.
It is part of the user documentation of the Squore software product edited and distributed by Squoring Technologies.
The Squore Configuration Guide provides a complete reference for the configuration and administration of Squore 15-A-SP2, with step-by-step instructions to customise the different models that define Squore behaviour.
This manual is intended for Squore administrators. It allows to fine-tune the Squore configuration to fit specific needs or contexts. Note however, that the default parameters work in most cases for most users, and that only experienced and technical-savvy users should try to modify those settings.
If the information provided in this manual is erroneous or inaccurate, or if you encounter problems during your installation, contact Squoring Technologies Product Support: http://support.squoring.com/
You will need a valid Squore customer account to submit a support request. You can create an account on the support website if you do not have one already.
For any communication:
support@squoring.com
Squoring Technologies Product Support
76, allées Jean Jaurès / 31000 Toulouse - FRANCE
Approval of this version of the document and any further updates are the responsibility of Squoring Technologies.
The version of this manual included in your Squore installation may have been updated. If you would like to check for updated user guides, consult the Squoring Technologies documentation site to consult or download the latest Squore manuals at http://support.squoring.com//documentation/15-A-SP2. Manuals are constantly updated and published as soon as they are available.
Table of Contents
Squore uses models to define its behaviour in different contexts. All models
are located by default in the directory <INSTALLDIR>/Configuration/models.
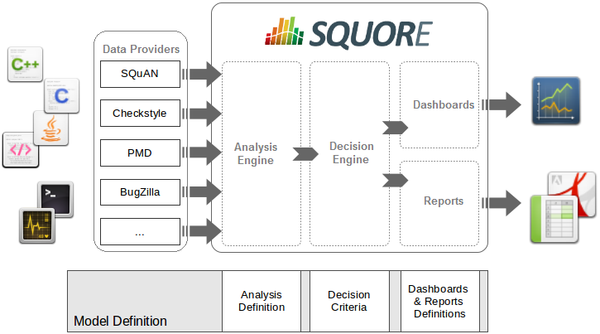
The picture above shows the different components involved in the Squore process.
The main building blocks of the Squore configuration are:
Squore Analyser and Data Providers are the inputs for the process, providing base measures for the analysis model.
Analysis Models define the transformation between base measures, which are retrieved from Data Providers and derived measures.
Decision models define how to process raw data (i.e. base measures) and analysis data (i.e. derived measures) to raise action items.
Dashboards present the overall results in a convenient way. They are deeply customisable and can show all the information needed in day-to-day usage of Squore.
Reports extract information and present it in a document (PDF, Powerpoint or spreadsheet). They can be used for external reporting, e.g. when there is no access to the Squore interface.
In order to present your model and its options to your users, Squore works with configurable wizards that guide users through project creation. You will learn how to create and edit wizards in Chapter 8, Project Wizards.
Models define how Squore computes metrics (analysis model), how action items are created (decision model), and how data is displayed (dashboards and reports).
All models are located in the <INSTALLDIR>/Configuration/models directory.
Some components are common to many models. Rather than creating redundancy, and redefining the same metrics or indicators every time, Squore uses the Shared Model to store definitions that may be used by more than one model.
The Shared Model is located in the same directory as other models: <INSTALLDIR>/Configuration/models.
Its structure is similar to other models, but it does not appear in the user interface.
To understand some of the common measures and rules used across Squore you can take a look at
the common definitions available in Shared/Analysis/Code, especially:
ArtefactRating
BaseMeasures (lists common base measures gathered by the Data Providers)
CallRelation
ControlFlowAnalysis
LineCounting
ObjectOrientation
RuleChecking
StabilityIndex
TechnicalDebt
If there are several customisations in your model, then you should create a new model to isolate them. This will be easier for maintenance and upcoming upgrades of Squore Server. The following procedure describes how to create a new model:
Create a new directory MyModel in the
<INSTALLDIR>/Configuration/models directory.
In the MyModel folder, create the following sub-folders:
Analysis, Dashboards, Decision, Description,
Exports, Reports and Wizards.
Logout and login to see the result. Browse the button in Squore and select the newly created model.
A model is a collection of several Bundle.xml files where your entire model is described. A model folder normally contains the following bundles:
myModel/Analysis/Bundle.xml, where artefact types, metrics, indicators and rules are defined
myModel/Dashboard/Bundle.xml, where the charts displayed in the web interface are defined
myModel/Decision/Bundle.xml, where you define the action items for your model
myModel/Description/Bundle.xml, where you translate all the elements of your model into several languages
myModel/Exports/Bundle.xml, where you define the type of information that users can export from the web UI
myModel/Highlights/Bundle.xml, where the different types of highlight categories are defined
myModel/Properties/Bundle.xml, where optional properties about your model are defined
myModel/Reports/Bundle.xml, where you define the type of reports that can be created from the web UI
myModel/Wizards/Bundle.xml, where you define the parameters to be used when creatign a project with your model
More information about each type of bundle is available in this manual. Note that a Bundle.xml file normally includes external files located elsewhere in the standard Squore configuration. This allows reusing modules between models.
The following is an (incomplete) example of a Bundle.xml file that includes other files from the Squore configuration. Note that the
xmlns:xi
declaration in the Bundle
element is
mandatory if you want to include external files.
<?xml version="1.0" encoding="utf-8" standalone="yes"?>
<Bundle xmlns:xi="http://www.w3.org/2001/XInclude" >
    <!-- Aliases -->
    <ArtefactType id="CODE" heirs="PACKAGES;FILES;CLASSES;MODULES" />
    <ArtefactType id="PACKAGES" heirs="APPLICATION;SOURCE_CODE;FOLDER" />
    <ArtefactType id="FILES" heirs="FILE" />
	<ArtefactType id="CLASSES" heirs="CLASS" />

	<xi:include href="../../Shared/Analysis/SQuORE_BasicScales.xml" />

		<!-- SQuORE Base Measures -->
	<xi:include
	  href="../../Shared/Analysis/product_quality/code/line_counting/line_counting.xml" />
	<xi:include
	  href="../../Shared/Analysis/Code/ObjectOrientation/squore_java_oo_basemeasures.xml" />
	<xi:include
	  href="../../Shared/Analysis/Code/ObjectOrientation/SQuORE_Inheritance.xml" />

		<!-- Rule Checking -->
	<xi:include
	  href="../../Shared/Analysis/Code/RuleSet/SQuORE_Java_RuleSet.xml" />

		<!-- SQALE Analysis Model -->
	<xi:include
	  href="../../Shared/Analysis/Code/SQALE/SQALE_Characteristics.xml" />
	<xi:include href="SQALE_Requirement.xml" />

	<RootIndicator indicatorId="SQALE_INDEX_DENSITY" artefactTypes="APPLICATION;FOLDER;SOURCE_CODE" />
	<RootIndicator indicatorId="SQALE_INDEX" artefactTypes="FUNCTION;CLASS;FILE" />
	<Measure measureId="COST" targetArtefactTypes="APPLICATION" defaultValue="0" />
</Bundle>
The bundle file is an xml file, which means that you must respect the XML syntax, otherwise Squore will not be able to read it. This means for example that the following characters are forbidden, and must be replaced by their corresponding entity reference:
& needs to be replaced by &
< needs to be replaced by <
> is preferably replaced by >, but this is not mandatory
" needs to be replaced by " (only when used inside an attribute value)
' needs to be replaced by ' (only when used inside an attribute value)
To learn more about entities, visit en.wikipedia.org/wiki/List_of_XML_and_HTML_character_entity_references
For the easy customisation of labels displayed in the Squore interface, all strings have been externalised
to localisable properties files
. For each XML file containing definitions (e.g. for scales, indicators, measures, etc.)
there is a file with the same name and a .properties extension for each
target language (_en and _fr by default). As an example, the English properties files for the Checkstyle_RuleSet.xml
file is located in the same directory and called Checkstyle_RuleSet_en.properties.
Squore will select the appropriate language to use according to the language options defined in the description bundle:
<?xml version="1.0" encoding="utf-8" standalone="yes"?>
<Bundle available="fr,en" default="en">
	<Properties src="Checkstyle_RuleSet" />
</Bundle>
In the example above, it is assumed that two files exist with the names Checkstyle_RuleSet_en.properties
and Checkstyle_RuleSet_fr.properties, since you declared both languages in the
available
attribute. Users are free to switch between the English and French languages using the flag icons in Squore's web interface. By default, Squore will display the descriptions from Checkstyle_RuleSet_en.properties, since you set the default language to "en" using the default
attribute.
Properties files are simple text files containing key-value pairs of internal unique identifier (often referred to as the ID) and language-dependent mnemonics, names, descriptions, help URL and justifications. The convention used for their syntax is the following:
<TYPE>.<MY_STRING_ID>.MNEMO=MYSTRING.<ARTEFACT-TYPE>
<TYPE>.<MY_STRING_ID>.NAME.<ARTEFACT-TYPE>=My String
<TYPE>.<MY_STRING_ID>.TREE_NAME.<ARTEFACT-TYPE>=My String (for charts and tables only, the name shown in the Dashboard Editor's tree) (since 13-B)
<TYPE>.<MY_STRING_ID>.ICON=path/to/icon.ico (for trend and group icons) (since 14-A)
TYPE.<MY_STRING_ID>.NODATA=My String (for charts only: the string displayed in the dashboard if there is no data to draw a chart) (since 14-A)
<TYPE>.<MY_STRING_ID>.DESCR.<ARTEFACT-TYPE>=This is a long description about my string.
<TYPE>.<MY_STRING_ID>.JUSTIF.<ARTEFACT-TYPE>=<a category that MYSTRING belongs to>
<TYPE>.<MY_STRING_ID>.URL.<ARTEFACT-TYPE>=https://intranet/wiki/Indicator
<TYPE> and <ARTEFACT-TYPE> are optional, but they can help you specify exceptions when viewing a measure for a certain type of artefact. Squore will resolve properties from the more specific to the more abstract, as shown below:
The following is an example of the declaration of SLOC:
M.SLOC.MNEMO=SLOC
  M.SLOC.NAME=Source Lines Of Code
  M.SLOC.DESCR=Number of lines of source code in the /application.
  M.SLOC.JUSTIF=MAINTAINABILITY
Note that in the example above, / is used to indicate a new line in the description, and SLOC is of type measure, as indicated by the prefix M.
The other available prefixes are:
I for INDICATOR
M for MEASURE
FA for FAMILY
LOP for LEVELOFPERFORMANCE
FI for FINDING
T for TYPE
RO for ROLE
PRO for PROFILE
PERM for PERMISSION
SC for SCALES
ST for STATUS
TST for TEST
C for CHART
TA for TABLE
RE for REPORT
EX for EXPORT
MO for MODEL
WI for WIZARD
EVO for trend icons (since 13-B)
HI for HIGHLIGHT (since 13-C)
G for GROUP (since 14-A)
Properties files are also used to customise tooltips appearing on the dashboard, as described in the section called “Using Tooltips”
Types are defined in the <INSTALLDIR>/Configuration/models/Shared/Analysis/Code/Types/types_en.properties
properties file. Other languages are defined in the same directory with a different ending (e.g. types_fr.properties for French).
Types are then used in all declarations that provide artefact-level information, like e.g. in measures:
<Measure measureId="DIT"
    targetArtefactTypes="CLASS"
defaultValue="1" />Rights are described and translated in the <INSTALLDIR>/Configuration/models/Shared/Description/rights_en.properties
properties file. Create your own language file by changing the language ending of this file, e.g. rights_ru.properties for Russian.
Roles are described and translated in the <INSTALLDIR>/Configuration/models/Shared/Description/roles_en.properties file.
There is one file per language, create your own language file by changing the language ending of this file, e.g. roles_ru.properties
for Russian.
Table of Contents
Analysis Models define how metrics data is computed and aggregated. You can browse and analyse models through the menu in the Squore web interface.
Analysis Models define building blocks organised in a hierarchical structure. The following blocks can be used:
Blocks can refer to each others, for example computations use measures and rules. The syntax used for computations is documented in Chapter 5, Computation Syntax.
You can define any artefact type in your model by declaring them in the
artefactTypes
attribute of your analysis model's RootIndicator
, as shown below.
The following definition of the ROOT main indicator declares the types APPLICATION, FILE, CLASS, FUNCTION, REQUIREMENT,
TEST_PLAN, TEST_SUITE and TEST:
<RootIndicator
  artefactTypes="APPLICATION;FILE;CLASS;FUNCTION;REQUIREMENT;TEST_PLAN;TEST_SUITE;TEST"
  indicatorId="ROOT" />
In addition, you can define aliases to group types of artefacts together to use later when defining metrics in your analysis model. The
ArtefactType
definition below groups the artefacts defined above into CODE and DOCUMENT aliases:
<ArtefactType id="CODE" heirs="APPLICATION;FILE;CLASS;FUNCTION" />
<ArtefactType id="DOCUMENT" heirs="REQUIREMENT;TEST_PLAN;TEST_SUITE;TEST" />
This means that the long artefact declaration above can be rewritten as follows:
<RootIndicator artefactTypes="CODE;DOCUMENT"
  indicatorId="ROOT" />
You can use aliases everywhere in your configuration, except in properties files.
You can also use the ArtefactType
element with a manual
attribute to declare that some artefacts can be added manually by the user, as shown below:
<ArtefactType id="TEST_SUITE" parents="APPLICATION;TEST_SUITE;TEST_PLAN" manual="true" />
<ArtefactType id="TEST" parents="TEST_SUITE" manual="true" />
<ArtefactType id="TEST_PLAN" parents="APPLICATION" manual="true" />
<ArtefactType id="REQUIREMENT" parents="APPLICATION" manual="true" />
Manual artefacts can be added by users with the required permissions via a context menu in the Artefact Tree
The Measure
element defines the semantics of a single measure.
From a technical standpoint, a measure is merely a mapping between the information provided by the Data Provider and known Squore elements.
Base Measures only define the measure name and identifier,
whereas Derived Measures define how they are computed from other measures.
A Measure without computation is a base measure. The following two examples show how the SLOC (Source Lines Of Code)
base measure and the COMR (Comment Rate) derived measure are defined:
<Measure
measureId="SLOC"
targetArtefactTypes="APPLICATION;FILE"
defaultValue="1" />

<Measure measureId="COMR" defaultValue="0">
<Computation stored="true"
    targetArtefactTypes=
       "APPLICATION;FOLDER;FILE;FUNCTION;CLASS;PROGRAM"
    result="(CLOC+MLOC)*100/(SLOC+CLOC)" />
</Measure>
The attributes allowed for the Measure
element are as follows:
measureId
is the unique identifier of the measure,
as used in the properties files[1].
targetArtefactTypes
is the type of artefact targeted by the measure.
It is one or more of APPLICATION, FOLDER, FILE, CLASS, PROGRAM, FUNCTION, or any other type defined for your project.
excludingTypes
allows refining targetArtefactTypes to exclude certain types that may have been included via an alias. You can for example specify that a metric exists for all JAVA types excet for JAVA_INTERFACE with the following syntax:
<Measure measureId="TEST_COVERAGE" defaultValue="-1">
  <Computation targetArtefactTypes="PACKAGES;JAVA" excludingTypes="JAVA_INTERFACE"
    result="IF(IS_DP_OK(JACOCO),TST_COV,-1)" />
</Measure>
defaultValue
sets the default value to be used if no value is found for this metric.
usedForRelaxation
indicates that the measure is used in this model to indicate whether an
artefact is relaxed of excluded. Note that only one measure in your model can use this attribute.
stored="true|false" (optional, default: true)
defines whether a base measure's value is stored in the database (true) or discarded (false) after an analysis.
toolName
is the name of the tool, e.g. FINDBUGS, SQuORE, CPPTEST.
toolVersion
is the tool version used to generate the data, e.g. 1.3.9, 7.2.10.34.
The attributes allowed for the Computation
element are as follows:
targetArtefactTypes
is the type of artefact targeted by this definition. It is one or more of
APPLICATION, FOLDER, FILE, CLASS, PROGRAM, FUNCTION, or any other type defined for your project.
stored="true|false" (optional, default: true)
defines whether a derived measure's value is stored in the database (true) or discarded (false) after an analysis.
result
specifies how the measure is computed from other metrics values.
Identifiers used in the result are measureIds, and the syntax is described in Chapter 5, Computation Syntax.
The measure defined is then used with its identifier, prefixed with B. for base measures, or prefixed with D. for derived measures. The following example shows the use of a derived measure for a computation:
<Computation
    targetArtefactTypes="APPLICATION;FOLDER;FILE;CLASS;FUNCTION"
    result="(D.MET_OKR+D.RULE_OKR)/2" />
Tip: Inheritance
Analysis models support inheritance and overriding of metrics according to the following rules:
If a metric is defined twice for a type, the first definition takes priority for this artefact type. An INFO message is displayed in the Validator to inform you that a definition is overriden by another one.
A metric definition for a specific type overrides a metric definition for a more generic type (typically an alias).
As a result, the following definitions are allowed in your Bundle.xml:
Specifying a different computation for one sub-type
<ArtefactType id="MODULES" heirs="FUNCTION" />
<ArtefactType id="FUNCTION" heirs="C_MODULES;PHP_MODULES;JAVA_MODULES" />
<Measure measureId="VG" defaultValue="1">
  <Computation targetArtefactTypes="MODULES" result="CCN+TERN+OREL+ANTH+CABL-(CASE+DEF)" />
  <Computation targetArtefactTypes="PHP_MODULES" result="CCN+TERN+OREL+ANTH" />
</Measure>
Overriding a computation imported from another file by specifying it before the file import
<?xml version="1.0" encoding="UTF-8"?>
<Bundle xmlns:xi="http://www.w3.org/2001/XInclude">
(...)
<Measure measureId="COMR" defaultValue="0">
  <Computation targetArtefactTypes="CODE" result="IF(ELOC+CLOC=0,-1,(CLOC+MLOC)/(ELOC+CLOC))" />
</Measure>
<xi:include href="../../Shared/basic_definitions/comr.xml" />
Rules are a specific type of measure. They do not return a numeric value like other measures, but the location within the source code where the rule was broken. Squore does not define any rule by itself, but requires a mapping between the rules defined in the external tools[2] that provide the compliance measure and internal concepts (and properties files).
An example of rule definition is provided below:
<Measure
    measureId="R_NOGOTO"
    type="RULE"
    categories="SCALE_SEVERITY.REQUIRED;SCALE_PRIORITY.HIGH"
    families="REQUIRED;ANALYSABILITY;MISRA;CF;STRP"
    targetArtefactTypes="FUNCTION"
    defaultValue="0" />
The attributes allowed for the Measure
element of type rule are as follows:
measureId
is the unique identifier of the rule, as used in the properties files.
categories
defines the scale level returned by Squore when the rule is violated.
families
puts tags on the measure. A common tag is TAB, which displays the rule in the user interface.
targetArtefactTypes
is the type of artefact targeted by this definition.
It is one or more of APPLICATION, FOLDER, FILE, CLASS, PROGRAM, FUNCTION, or any other type defined for your project.
defaultValue
sets the default value to be used if no value is found for this metric.
Scales define grades and boundaries for measures, in order to translate them into more understandable information. The ScaleLevel sub-element defines the ranges in the scale.
<Scale scaleId="SCALE_EC">
    <ScaleLevel levelId="UNKNOWN" bounds="];0["  rank="-1" />
    <ScaleLevel levelId="LEVELA" bounds="[0;0]"  rank="0" />
    <ScaleLevel levelId="LEVELB" bounds="]0;1]" rank="1" />
    <ScaleLevel levelId="LEVELC" bounds="]1;2]" rank="2" />
    <ScaleLevel levelId="LEVELD" bounds="]2;3]" rank="3" />
    <ScaleLevel levelId="LEVELE" bounds="]3;4]" rank="4" />
    <ScaleLevel levelId="LEVELF" bounds="]4;5]" rank="5" />
    <ScaleLevel levelId="LEVELG" bounds="]5;]"  rank="6" />
</Scale>
In this example, the scale SCALE_EC associates different levels to a measured value:
If the measured value is less than 0, the levelId is UNKNOWN with ranking -1.
If the measured value is exactly 0, the levelId is A with ranking 0.
If the measured value is between 0 (excluded) and 1 (included), the levelId is B with ranking 1.
If the measured value is between 1 (excluded) and 2 (included), the levelId is C with ranking 2.
If the measured value is between 2 (excluded) and 3 (included), the levelId is D with ranking 3.
If the measured value is between 3 (excluded) and 4 (included), the levelId is E with ranking 4.
If the measured value is between 4 (excluded) and 5 (included), the levelId is F with ranking 5.
If the measured value is more than 5 (excluded), the levelId is G with ranking 6.
You can also use a union of values to set the bounds of a scale level, as shown in the following example:
<Scale scaleId="SCALE_EC2">
   <ScaleLevel levelId="LEVELA" bounds=" ]0;10[|]10;100[" rank="0"/>
   <ScaleLevel levelId="LEVELB" bounds="[10;10]" rank="1"/>
</Scale>
In this case, values between 0 and 10 or between 10 and 100 (all excluded) will rank A and a value of exactly 10 will score B.
Scales can be overridden for a specific artefact type, as shown below:
<Indicator indicatorId="VG" measureId="VG" scaleId="VG" targetArtefactTypes="CODE" />
<Scale scaleId="VG">
    <ScaleLevel levelId="UNKNOWN"	bounds="];0[" rank="-1" />
    <ScaleLevel levelId="GREEN"	bounds="[0;6]" rank="0" />
    <ScaleLevel levelId="YELLOW"	bounds="]6;10]" rank="1" />
    <ScaleLevel levelId="RED" bounds="]10;[" rank="2" />
</Scale>

<Scale scaleId="VG" targetArtefactTypes="COBOL_PROGRAM">
    <ScaleLevel levelId="UNKNOWN"	bounds="];0[" rank="-1" />
    <ScaleLevel levelId="GREEN"	bounds="[0;10]" rank="0" />
    <ScaleLevel levelId="YELLOW"	bounds="]10;20]" rank="1" />
    <ScaleLevel levelId="RED" bounds="]20;[" rank="2" />
</Scale>
The scale VG applies to all artefacts of type CODE, however,
for artefacts of type COBOL_PROGRAM, the scale levels have different bounds than for other types (as
specified via the targetArtefactTypes
attribute).
You can use scale macros in order to avoid duplicating a scale and use parameters ({0}, {1}...) to define the scale level thresholds:
<ScaleMacro id="RGB">
    <ScaleLevel levelId="UNKNOWN"	bounds="];0[" rank="-1" />
    <ScaleLevel levelId="GREEN"	bounds="[0;{0}]" rank="0" />
    <ScaleLevel levelId="YELLOW"	bounds="]{0};{1}]" rank="1" />
    <ScaleLevel levelId="RED" bounds="]{1};[" rank="2" />
</ScaleMacro>
Scales defined by a macro and its parameters are then specified as shown below:
<Scale scaleId="VG" macro="RGB" vars="6;10" />
<Scale scaleId="VG_REVERSED" macro="RGB" vars="10;6" />
The UNKNOWN level receives special treatment when it comes to showing a trend:
When the rank goes from the UNKNOWN level to any other level, the trend is shown as:

When the rank goes from any level to UNKNOWN, the trend is shown as:

The Scale
element accepts the following attributes:
targetArtefactTypes
(optional): the specific artefacts that this scale applies to. If this attribute
is omitted, then the value of targetArtefactTypes
specified for the indicator using this scale is used.
macro
(optional): specifies id of the ScaleMacro used to define this scale
vars
(optional): is a semicolon-separated list of parameters to pass to the ScaleMacro to define this scale
isDynamic
(optional, default: false): whether the scale levels are dynamic or not. Read more about the concept of dynamic scales in the section called “Dynamic Scales”.
Scale levels are defined using one or more ScaleLevel
sub-elements,
with the following attributes:
levelId
(mandatory): the unique identifier of the scale level.
bounds
(mandatory): the value limits for this scale level.
Infinite bounds can be specified by omitting the number, e.g.: [0;[ or [0;] for any null or positive number.
rank
(mandatory): the weight of the scale which is used when aggregating values.
The levelIds are then mapped to their language-specific attributes in a properties file.
For the previous example, the file PerformanceLevels_en.properties gives the following mapping:
LOP.LEVELA.MNEMO=A
LOP.LEVELA.NAME=Level A
LOP.LEVELA.COLOR=0,81,0
LOP.LEVELA.IMAGE=../Shared/Images/images/perfA.png
LOP.LEVELA.ICON=../Shared/Images/icons/perfA.png
The trend icons (new, improved, deteriorated and stable) that appear in the artefact tree and the dashboard tables can also be customised in a properties file as shown below:
EVO.TREE_NEW.ICON=Description/new.png
EVO.TREE_DOWN.ICON=Description/down.png
EVO.TREE_UP.ICON=Description/up.png
EVO.TREE_EQUAL.ICON=Description/equal.png

EVO.TABLE_NEW.ICON=Description/new.png
EVO.TABLE_DOWN.ICON=Description/down2.png
EVO.TABLE_UP.ICON=Description/up2.png
EVO.TABLE_EQUAL.ICON=Description/equal.png
Indicators associate a scale with a measure.
<Indicator
    indicatorId="ROKR_REQ"
    measureId="ROKR_REQ"
    scaleId="SCALE_DECILE"
    families="TAB"
    displayTypes="VALUE;LEVEL" />
The attributes allowed in the Indicator
tag are the
following:
indicatorId
(mandatory): the unique identifier of the indicator being defined.
measureId
(mandatory): the unique identifier of the measure to map.
scaleId
(mandatory): the unique identifier of the scale to be used for the measure.
families
(optional): the families associated with the indicator.
displayTypes
(optional, default: empty) specifies which details
relative to the indicator should be displayed in the Indicator tree on the left of the dashboard. The accepted values are
LEVEL to display the level name of the indicator after its name
VALUE to display the actual value of the metric associated to the indicator after its name
displayedScale
(optional) allows displaying an alternate scale in the indicator details popup in
the Explorer instead of the real scale associated with the indicator. This is generally useful when you are using a
complicated scale internally but you want to show something simpler to your users instead (when using dynamic scales for example).
This attribute accepts any valid scale ID from your model.
displayedMeasure
(optional) allows displaying an alternate measure in the indicator details popup in
the Explorer instead of the real measure associated with the indicator. This is generally useful when you are using a
measure internally that would not make sense to end users but you want to show something simpler instead (when using dynamic scales for example).
This attribute accepts any valid measure ID from your model.
An indicator must be specified as the root indicator for a each artefact type. The root indicator is the top-level mark displayed next to an artefact in the artefact tree.
<RootIndicator
    indicatorId="MAINTAINABILITY"
    artefactTypes="APPLICATION;FILE;FUNCTION" />
indicatorId
: the unique identifier of the indicator chosen as root.
artefactTypes
is the type of artefact for which this indicator is the root indicator. It is one or
more of APPLICATION, SOURCE_CODE, FOLDER, FILE, CLASS, PROGRAM, FUNCTION, or any other type defined for your project. Note that the indicator
must exist for all the types of artefacts specified.
A root indicator must be based on a derived measure, not a base measure. If the measure you want to use as an indicator is a base, add a dummy derived measure as shown below.
Before:
<Measure id="ROOT" targetArtefactTypes="TYPE" defaultValue="0" />
After:
<Measure id="ROOT" targetArtefactTypes="TYPE" defaultValue="0">
<Computation targetArtefactTypes="SOME_OTHER_TYPE" result="B.ROOT" />
</Measure>
In order to allow users to relax or exclude artefacts from the projects from the Artefact Tree, you need to reserve one measure that uses a special attribute used for relaxation and specify to which artefact types it applies.
The following is a basic example of how to allow users to relax folders and files in your model:
myModel/Analysis/Bundle.xml:
<ArtefactType id="RELAXABLE" heirs="FOLDER;FILES" />
<Measure measureId="RELAX" targetArtefactTypes="RELAXABLE"
  defaultValue="0" usedForRelaxation="true" />
By adding these two lines in your model, you allow users whose role grant the View Drafts of Projects and Modify Artefacts privileges to use the relaxation mechanism. For more information about using artefact relaxation from the web UI, consult the Getting Started Guide or the online help.
Impact on computations
When an artefact is relaxed, its metrics are ignored when computing metrics for other artefacts. This makes sense for example when relaxing a folder full of third-party code, because you may not want the total number of software lines of code to include third-party code.
In other situations, it does not make
sense to exclude all metrics from relaxed artefacts: If you are analysing components of a system and aggregate
memory usage information up to the application level for example, third-party components for which you relax source code issues
should still be part of the total memory usage for the system. In the latter case, you can use the
continueOnRelaxed
attribute to indicate that some or all measures should be included
in computations even if the artefact has been relaxed. This is explained in the two examples below.
In the following code continueOnRelaxed
is set to true
for the metric used to mark artefacts as relaxed (usedForRelaxation
). As a result, all measures of the
relaxed artefact are included in computations for other artefacts:
<ArtefactType id="RELAXABLE" heirs="FOLDER;FILES" />
<Measure measureId="RELAX" targetArtefactTypes="RELAXABLE" usedForRelaxation="true"
  continueOnRelaxed="true" defaultValue="0"  />
In the following code, continueOnRelaxed
is set to true at computation-level.
As a result, the measure MEMORY is included in computations
even when the artefact is relaxed. No other measures are included in computations for relaxed artefacts, since
continueOnRelaxed
is omitted from the definition of RELAX:
<ArtefactType id="RELAXABLE" heirs="FOLDER;FILES" />
<Measure measureId="RELAX" targetArtefactTypes="RELAXABLE" usedForRelaxation="true"
  defaultValue="0" />
<Measure measureId="MEMORY" defaultValue="0">
  <Computation targetArtefactTypes="APPLICATION;FODLER"
  result="SUM FILE.MEMORY FROM DESCENDANTS" continueOnRelaxed="true"/>
</Measure>
Constants are used to resolve a symbol to a number. They are defined with the Constant
XML tag.
<Constant id="HIS_MET" value="12" />
Two attributes are required to define a constant:
A constant can then be used in a computation by prefixing it with C., e.g.:
<Computation
    targetArtefactTypes="APPLICATION;FOLDER;FILE;CLASS;FUNCTION"
    result="100*(1-(MET_KO/C.HIS_MET))" />
A constant can also be used in a scale level. Note that in this kind of usage, the constant ID does note require a prefix, as shown below:
<ScaleLevel levelId="LEVELG" bounds="]5;]" rank="HIS_MET" />
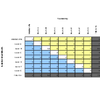
Dynamic scales are scales whose levels use measures instead of absolute bounds. They are useful when one metric has a different meaning according to the context in which it is read. In software development for example, you may accept a certain amount of specification changes at one stage of the process, but completely want to prohibit it at another stage. This section takes you through an example that can be implemented easily in your model with the use of dynamic scales.
What we want to guarantee with our dynamic scale, is that during three different phases of development, our requirements stability indicator is evaluated differently, as represented below:
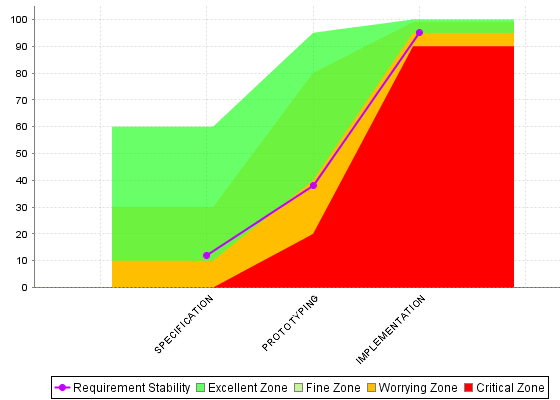
Requirement Stability by Development Phase.
The following is an example of a dynamic scale definition for a KPI that evaluates the stability of requirements as excellent, fine, worrying, critical or unknown:
<Scale scaleId="DYN_SCALE_REQ_STABILITY" isDynamic="true">
    <ScaleLevel levelId="DYN_EXCELLENT" bounds="[APP(EXCELLENT_THRESHOLD);["  rank="0" />
    <ScaleLevel levelId="DYN_FINE" bounds="[APP(FINE_THRESHOLD);APP(EXCELLENT_THRESHOLD[" rank="1" />
    <ScaleLevel levelId="DYN_WORRYING" bounds="[APP(WORRYING_THRESHOLD);APP(FINE_THRESHOLD)[" rank="2" />
    <ScaleLevel levelId="DYN_CRITICAL" bounds="[APP(CRITICAL_THRESHOLD);APP(WORRYING_THRESHOLD)[" rank="3" />
    <ScaleLevel levelId="DYN_UNKNOWN" bounds="];APP(CRITICAL_THRESHOLD)[" rank="4" />
</Scale>Compared with the examples of scales shown in the section called “Scales”, note
the use of the isDynamic
attribute and
how the bounds are expressed with measures instead of actual values.
The threshold measures can vary for each analysis and/or for each artefact type, and the scale may therefore be different as time goes by. There are two ways they could be set:
By using attributes at application levels so that users define the values of the thresholds manually.
By computing the thresholds during the analysis with IF(), CASE() or
other available functions described in the section called “Functions”
Here is an example setting the thresholds according to a PHASE attribute set by the user
before running an analysis (more information about attributes is available in the section called “Attributes”:
<!-- Attribute Definition in Wizard -->
<tag type="multipleChoice" name="Development Phase: " measureId="PHASE"
	defaultValue="SPECIFICATION" displayType="radioButton"
	targetArtefactTypes="APPLICATION">
	<value key="SPECIFICATION" value="1" />
	<value key="PROTOTYPING" value="2" />
	<value key="IMPLEMENTATION" value="3" />
</tag>

<!-- Metrics Definition in Analysis Model -->
<Measure measureId="PHASE" targetArtefactTypes="APPLICATION" defaultValue="0" />
<Constant id="PHASE_SPECIFICATION" value="1" />
<Constant id="PHASE_PROTOTYPING" value="2" />
<Constant id="PHASE_IMPLEMENTATION" value="3" />

<!-- Thresholds Computation in Analysis Model -->
<Measure measureId="EXCELLENT_THRESHOLD">
	<Computation targetArtefactTypes="APPLICATION"
					result="CASE(PHASE,
	                        	 C.PHASE_SPECIFICATION:60,
	                        	 C.PHASE_PROTOTYPING:95,
	                        	 C.PHASE_IMPLEMENTATION:100,
	                        	 DEFAULT:-1)"/>
</Measure>
<Measure measureId="FINE_THRESHOLD">
	<Computation targetArtefactTypes="APPLICATION"
					result="CASE(PHASE,
	                        	 C.PHASE_SPECIFICATION:30,
	                          	 C.PHASE_PROTOTYPING:80,
	                          	 C.PHASE_IMPLEMENTATION:99,
	                         	 DEFAULT:-1)"/>
</Measure>
<Measure measureId="WORRYING_THRESHOLD">
	<Computation targetArtefactTypes="APPLICATION"
					result="CASE(PHASE,
	                        	 C.PHASE_SPECIFICATION:10,
	                             C.PHASE_PROTOTYPING:40,
	                             C.PHASE_IMPLEMENTATION:95,
	                             DEFAULT:-1)"/>
</Measure>
<Measure measureId="CRITICAL_THRESHOLD">
	<Computation targetArtefactTypes="APPLICATION"
					result="CASE(PHASE,
	                        	 C.PHASE_SPECIFICATION:0,
	                             C.PHASE_PROTOTYPING:20,
	                             C.PHASE_IMPLEMENTATION:90,
	                             DEFAULT:-1)"/>
</Measure>
The final REQUIREMENTS_STABILITY indicator is associated with a static scale that uses the same ranks as the dynamic one,
and its value is assigned by retrieving the desired rank from the dynamic scale using the FIND_RANK() function:
<!-- Static scale to base the KPI on -->

<Scale scaleId="SCALE_REQ_STABILITY">
    <ScaleLevel levelId="EXCELLENT" bounds="[0;0]"  rank="0" />
    <ScaleLevel levelId="FINE" bounds="[1;1]" rank="1" />
    <ScaleLevel levelId="WORRYING" bounds="[2;2]" rank="2" />
    <ScaleLevel levelId="CRITICAL" bounds="[3;3]" rank="3" />
    <ScaleLevel levelId="UNKNOWN" bounds="[4;4]" rank="4" />
</Scale>

<!-- Indicator definition -->
<Indicator indicatorId="REQUIREMENTS_STABILITY"
			measureId="REQ_STABILITY_RANK"
			targetArtefactTypes="APPLICATION;FOLDER;FILE"
			scaleId="SCALE_REQ_STABILITY" />

<!-- The base measure that holds the actual raw value of Requirement Stability -->
<Measure measureId="REQUIREMENTS_STABILITY_METRIC"
		 targetArtefactTypes="APPLICATION;FOLDER;FILE" defaultValue="0" />

<!-- A temporary measure to compute the rank of the metric on the dynamic scale -->
<Measure measureId="REQ_STABILITY_RANK">
	<Computation stored="false" targetArtefactTypes="APPLICATION;FOLDER;FILE"
			 result="FIND_RANK(DYN_SCALE_REQ_STABILITY, REQUIREMENTS_STABILITY_METRIC)" />
</Measure>
For more information about the FIND_RANK() function, refer to the section called “Functions”.
When using dynamic scales, the scale and measure computed for an indicator may not make sense for the end user. In this case, you may
want to change what the user sees via the use of the displayedScale
and displayedMeasure
attributes in your indicator definition. For more information about this syntax, consult the section called “Indicators”.
This chapter details the concept of the decision model, and the methods available for building an action plan in Squore.
A Decision Model defines criteria that trigger the creation of Action Items in Squore. The list of action items triggered during an analysis defines the to-do list that can be followed to improve the quality of a project.
If you have a precise idea of which actions should be part of your plan for your model, you can define a list of tests to run against the metrics generated when running an analysis to build an action plan. If you do not define any action items in your model, Squore automatically generates them according to the findings collected during the analysis.
The easiest way to instruct Squore to build a dynamic action plan for your model based on the
findings generated during an analysis is to ensure that your model folder contains no Decision/Bundle.xml file.
A list of the Top 40 valuable actions will be created for the project. This list is shown to all users
in the Action Items tab of the Explorer.
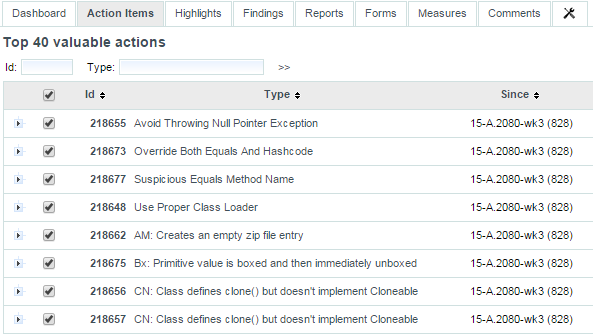
Part of the Top 40 valuable actions dynamically generated for a source code project
By default, action items are created based on findings in the project using these criteria:
Findings with the lowest remediation cost
Findings with the highest severity
Findings with the lowest number of occurrences
This can be specified in your Bundle.xml as follows:
$SQUORE_HOME/configuration/MyModelFolder/Decision/Bundle.xml:
<Bundle>
  <FindingsActionPlan limit="40">
    <CategoryCriterion type="COST" scaleId="SCALE_REMEDIATION"
          preferenceLevel="MEDIUM"
          excludeLevels="UNKNOWN;NONE" />
    <CategoryCriterion type="BENEFIT" scaleId="SCALE_SEVERITY"
          preferenceLevel="MEDIUM"
          excludeLevels="UNKNOWN;INFORMATION" />
    <OccurrencesCriterion type="COST" preferenceLevel="MEDIUM" />
  <FindingsActionPlan>
<Bundle>
Dynamic Action Plan Syntax
The FindingsActionPlan
element accepts the following attributes:
limit (optional, default: 40)
defines how many action items to generate
priorityScaleId (optional, default: SC_DEFAULT_PLANNER_PRIORITY)
defines the priority scale used
in the Action Items tab to distribute the action items. The default scale uses 20 levels to spread all the possible combinations of
remediation costs, severities and number of occurrences evenly. You can define your own scale with more or less levels and even or uneven
levels to distribute the combinations of possible action items.
There are three types of criteria that you can use to prioritise findings:
Each type of criterion accepts the following attributes:
scaleId (mandatory, not supported for VariableCriterion)
is the scale to look up to build the criterion on.
indicatorId (mandatory, only supported in VariableCriterion)
is the indicator to specify a VariableCriterion
type="COST|BENEFIT" (optional, default: COST)
defines which end of the scale to pull findings from in priority.
When set to COST, findings with the lowest rank on the scale are turned into action items first. This makes sense on a remediation cost scale, where you want to fix findings with the lowest remediation cost first.
When set to BENEFIT, findings with the highest rank on the scale are turned into action items first. This makes sense on a severity scale, where you want to fix findings with the highest severity first.
excludeLevels (optional, default: none)
allows excluding scale levels from
the criterion. This attribute allows a list of scale levels, as shown in the example above.
preferenceLevel="VERY_LOW|LOW|MEDIUM|HIGH|VERY_HIGH" (optional, default: MEDIUM)
allows weighing the defined criteria against each other.
Here is an example that expands on the default shown earlier to take into account the test coverage of artefacts and make sure that action items are generated mostly for artefacts with a high test coverage ratio. The scale used as well only contains five levels from P1 to P5 and will single out very high and very log priority items (the relevancy of an action item is a number between 0 and 100 that is measured against this scale to define the priority):
$SQUORE_HOME/configuration/MyModelFolder/Decision/Bundle.xml:
<Bundle>
  <FindingsActionPlan limit="40" priorityScaleId="SCALE_LEVEL_FIVE">
    <CategoryCriterion type="COST" scaleId="SCALE_REMEDIATION"
          preferenceLevel="MEDIUM"
          excludeLevels="UNKNOWN;NONE" />
    <CategoryCriterion type="BENEFIT" scaleId="SCALE_SEVERITY"
          preferenceLevel="MEDIUM"
          excludeLevels="UNKNOWN;INFORMATION" />
    <OccurrencesCriterion type="COST" preferenceLevel="MEDIUM" />
    <VariableCriterion type="BENEFIT" preferenceLevel="VERY_HIGH"
          indicatorId="TEST_COVERAGE" />
  <FindingsActionPlan>
<Bundle>

Where SCALE_LEVEL_FIVE is:
<Scale scaleId="SCALE_LEVEL_FIVE">
	<ScaleLevel levelId="P0" bounds="[0;5]" rank="0" />
	<ScaleLevel levelId="P1" bounds="]5;15]" rank="1" />
	<ScaleLevel levelId="P2" bounds="]15;65]" rank="2" />
	<ScaleLevel levelId="P3" bounds="]65;85]" rank="3" />
	<ScaleLevel levelId="P4" bounds="]85;95]" rank="4" />
	<ScaleLevel levelId="P5" bounds="]95;100]" rank="5" />
</Scale>If you want to use a combination of metrics to trigger action plans instead of relying on prioritising findings, Squore allows building your own specification of triggers for action items. The following is an example of a Decision Bundle where an action item is based on specific triggers:
<?xml version="1.0" encoding="utf-8" standalone="yes"?>
		<Bundle>
			<DecisionCriteria>
				<DecisionCriterion dcId="DR_FU_UNTESTABLE" categories=
							"SCALE_PRIORITY.MEDIUM"
							roles="DEVELOPER;PROJECT_MANAGER"
							targetArtefactTypes="FUNCTION">
					<Triggers>
						<Trigger>
							<Test expr="VG" bounds="[20;[" descrId="UNTESTABLE_VG"
									p0="#{MEASURE.VG}" />
							<Test expr="NEST" bounds="[4;[" descrId="UNTESTABLE_NEST"
									p0="#{MEASURE.NEST}" />
							<Test expr="NPAT" bounds="[800;[" descrId="UNTESTABLE_NPAT"
									p0="#{MEASURE.NPAT}" />
						</Trigger>
						<Trigger>
							<Test expr="VG" bounds="[50;[" descrId="UNTESTABLE_VG"
									p0="#{MEASURE.VG}" />
						</Trigger>
					</Triggers>
				</DecisionCriterion>
			</DecisionCriteria>
		</Bundle>
A DecisionCriterion is an action item definition.
At least one trigger must be true to trigger the automatic generation
of an action item on an artefact whose type is defined in the targetArtefactTypes
attribute of a DecisionCriterion. A trigger is true when all its tests evaluate to true.
When using the role
attribute for a DecisionCriterion
(since 14-A), you
limit the visibility of the Action Items defined to the roles listed only. If the attribute is not present, then
the action item is visible to all users who can view the project.
Remember that a decision criterion will evaluate its Triggers using OR, whereas a trigger will evaluate its Tests using AND.
Writing a Test
Writing a test, requires using the following mandatory attributes:
expr: Expression of the computation, see Chapter 5, Computation Syntax for more details.
bounds: interval within which the computation result evaluates to true.
The syntax is the same as the one used for defining scaleLevel bounds (see the section called “Scales”),
but you can also use some computations via the following syntax:
For constants: C.<constantId>
For measures: <measureId>
For application-level measures: APP(<measureId>)
As an example, the following bound definition is valid to trigger an action item:
bounds="[APP(LC);C.CST_X["
The following optional attributes may also be used:
descrId: description identifier used to set the description of this test.
p{X}: parameters of the description, example: p0="#{MEASURE.VG}" and the description: TST.{descrId}=The complexity is too high
(value={0})
Table of Contents
Computation formulae are used in two contexts:
Basic examples of Computations and Trigger are shown below:
<Measure measureId="CLSTAB_DEBT" defaultValue="0">
<Computation
targetArtefactTypes="FILE;FOLDER;APPLICATION"
result="SUM CLASS.I.STABILITY FROM DESCENDANTS" />
</Measure>

<Trigger>
<Test
expr="COUNT RULE.OCCURRENCES FROM DESCENDANTS"
bounds="[1;["
descrId="PRESENTATION_COMPOUND" />
</Trigger>
A computation is built on operands, i.e. any element defined in the model (rules, indicators, measures, etc...) used with operators and optionally restricted to a predefined scope.
There are two ways to write the formula used to compute the results, depending on the results you are trying to achieve:
The following sections will cover the use of operands and the syntax used for simple calculations and queries.
An operand is any element defined in the model, called with its unique identifier (ID).
Measures may be prefixed with B when a Base and a Derived measure share the same ID, and
you want to make sure that Squore uses the base measure in your syntax.
The following example shows a computation that adds and divides the TOPD (Operand Occurrences), TOPT (Operator Occurrences), DOPD (Distinct Operands), DOPT (Distinct Operators) measures.
<Computation targetArtefactTypes="FUNCTION"
result="(TOPD+TOPT)/(DOPD+DOPT)" />
Rules have different attributes that can be called in expressions.
families attribute, e.g. WHERE RULE.FAMILY=REQUIRED.Below is an example of computation using rules attributes:
<Test
expr="COUNT RULE.OCCURRENCES FROM DESCENDANTS
WHERE RULE.FAMILY=CPRS"
bounds="[10;["
descrId="PRESENTATION_CPRS" />
Indicators are prefixed with a I. The following example shows a computation which sums the values of the SDOC (Self-Descriptiveness), DFCX (Data Flow Complexity), and CFCX (Control Flow Complexity) indicators.
<Computation targetArtefactTypes="FUNCTION"
result="I.SDOC+I.DFCX+I.CFCX" />
Examples of operands are: RULES.OCCURRENCES, RULES.FAMILY, RULE.MEASUREID, FUNCTION, PROGRAM.LEVEL, FUNCTION.I.HIS_LEVL, etc.
In order to compute results for the current artefact, the basic operators
+, -, * and /
allow to respectively add, subtract, multiply and divide the values of
two operands. Parentheses are allowed at any nesting level.
The following examples describe valid uses of the operators in Squore models. Note that spaces were added between operands to simplify reading the formulae, but they are not required.
Take the value of LC, subtract SLOC and add 10:
<Measure measureId="COMR" defaultValue="0">
<Computation targetArtefactTypes="FILE;FUNCTION;CLASS"
result="LC - SLOC + 10" />
</Measure>
Using both base and derived measures (B.SLOC and SLOC respectively)
in the same calculation:
<Measure measureId="COMR" defaultValue="0">
<Computation targetArtefactTypes="FILE;FUNCTION;CLASS"
result="LC - B.SLOC + (-04 - SLOC)" />
Multiplying operands:
<Measure measureId="COMR" defaultValue="0">
<Computation targetArtefactTypes="FILE;FUNCTION;CLASS"
result="LC * SLOC * 6.0" />
</Measure>
Using the opposite value of an operand:
<Measure measureId="COMR" defaultValue="0">
<Computation targetArtefactTypes="FILE;FUNCTION;CLASS"
result="0.1 * -LC + 2 * -SLOC * 3" />
</Measure>
Dividing values:
<Measure measureId="COMR" defaultValue="0">
<Computation targetArtefactTypes="FILE;FUNCTION;CLASS"
result="LC + 2 / 2" />
</Measure>
Using the ranking of a measure instead of its value:
<Measure measureId="COMR" defaultValue="0">
<Computation targetArtefactTypes="FILE;FUNCTION;CLASS"
result="I.LC + I.SLOC / 3.5" />
</Measure>
Using the ranking of the root indicator for the artefact:
<Measure measureId="COMR" defaultValue="0">
<Computation targetArtefactTypes="FILE;FUNCTION;CLASS"
result="RANK + LC" />
</Measure>

	or

<Measure measureId="COMR" defaultValue="0">
<Computation targetArtefactTypes="FILE;FUNCTION;CLASS"
result="LEVEL + LC" />
</Measure>
Using the number of times the rule R_COMPOUNDIF was violated for the artefact:
<Measure measureId="COMR" defaultValue="0">
<Computation targetArtefactTypes="FILE;FUNCTION;CLASS"
result="R.R_COMPOUNDIF * 2" />
</Measure>
Note: If an erroneous formula is used, the measure will use the default value instead of the result of the computation:
<Measure measureId="COMR" defaultValue="0">
<Computation targetArtefactTypes="FILE;FUNCTION;CLASS"
result="LC / 0" />
</Measure>
You can use the operators MIN(param[,param,param...]), MAX(param[,param,param...]),
ABS(param),
and AVR(param[,param,param...]) if you need to determine the minimum, maximum, absolute or average
value in a set of parameters.
For more advanced calculations, the following functions are also available:
EXP(<Computation> value) to calculate the exponential of a value
LN(<Computation> value) to calculate the natural logarithm of a value
LOG(<Computation> value, <Computation> base) to calculate the logarithm of a value
POW(<Computation> value, <Computation> power) to calculate a power
SQRT(<Computation> value) to calculate a square root
ROUND(<Computation> value) to round a number to the nearest integer
FLOOR(<Computation> value) to round down a number to the nearest integer
CEIL(<Computation> value) to round up a number to the nearest integer
CENTROID(<Computation> value [| <computation> weight], ...) to calculate the centroid of comma-separated pairs of value|weight. If no weight is specified, it is set to 1.
FCENTROID(<Computation> min, <Computation> max, <Computation> value [| <computation> weight], ...) to calculate the filtered centroid of comma-separated pairs of value|weight. When using the FCENTROID() function, only the values within min and max are used to calculate a CENTROID(). To specify infinity as a bound, leave the value of min or max empty. If no values match the filter, the default value is returned.
FMIN(<Computation> min, <Computation> max, <Computation> value [, <Computation> value, <Computation> value...]) to calculate the filtered minimum of comma-separated values. When using the FMIN() function, only the values within min and max are used to calculate a MIN(). To specify infinity as a bound, leave the value of min or max empty. If no values match the filter, the default value is returned.
FMAX(<Computation> min, <Computation> max, <Computation> value [, <Computation> value, <Computation> value...]) to calculate the filtered maximum of comma-separated values. When using the FMAX() function, only the values within min and max are used to calculate a MAX(). To specify infinity as a bound, leave the value of min or max empty. If no values match the filter, the default value is returned.
FSUM(<Computation> min, <Computation> max, <Computation> value [, <Computation> value, <Computation> value...]) to calculate the filtered sum of comma-separated values. When using the FSUM() function, only the values within min and max are used to calculate a SUM(). To specify infinity as a bound, leave the value of min or max empty. If no values match the filter, the default value is returned.
Using a measure if it is above a threshold, else use the threshold:
<Measure measureId="EXAMPLE" defaultValue="0">
<Computation targetArtefactTypes="FILE;FUNCTION;CLASS"
result="MAX(10,VG)" />
</Measure>
Using the higher of two measures:
<Measure measureId="EXAMPLE" defaultValue="0">
<Computation targetArtefactTypes="FILE;FUNCTION;CLASS"
result="MAX(LC,SLOC)" />
</Measure>
Using lower of three indicators:
<Measure measureId="EXAMPLE" defaultValue="0">
<Computation targetArtefactTypes="FILE;FUNCTION;CLASS"
result="MIN(I.TESTABILITY, I.CHANGEABILITY, I.ANALISABILITY)" />
</Measure>
Example preventing division by 0:
<Measure measureId="EXAMPLE" defaultValue="0">
<Computation targetArtefactTypes="FILE;FUNCTION;CLASS"
result="LC / MAX(STAT, 1)" />
</Measure>
Example retrieving the variation of a measure:
<Measure measureId="EXAMPLE" defaultValue="0">
<Computation targetArtefactTypes="FILE;FUNCTION;CLASS"
result="ABS(DELTA_VALUE(LC))" />
</Measure>
Example using nested MIN and MAX functions:
<Measure measureId="EXAMPLE" defaultValue="0">
<Computation targetArtefactTypes="FILE;FUNCTION;CLASS"
result="MIN(MAX(SLOC+(BLANK/2),1000),MAX(LC,1000))+2" />
</Measure>
Calculating the average of three indicators:
<Measure measureId="EXAMPLE" defaultValue="0">
<Computation targetArtefactTypes="FILE;FUNCTION;CLASS"
result="AVR(I.TESTABILITY, I.CHANGEABILITY, I.ANALISABILITY)" />
</Measure>
Calculating the centroid of 3 with weight 3 and 2 with weight 100 (=2.03):
Note: this translates to (3x3 + 2x100) / (100+3)
<Measure measureId="MATH_CENTROID_3_3_2_100" defaultValue="0">
<Computation targetArtefactTypes="APPLICATION" result="CENTROID(3|3,2|100)"/>
</Measure>
Calculating the filtered centroid of TESTABILITY/STABILITY/MAINTAINABILITY:
Given the scale:
level: UNKNOWN, rank: -1
level: LEVELA, rank: 0
level: LEVELB, rank: 1
level: LEVELC, rank: 2
and given that I.TESTABILITY is UNKNOWN, I.STABILITY is LEVELB, I.MAINTAINABILITY is LEVELC
<Measure measureId="MATH_FCENTROID" defaultValue="0">
<Computation targetArtefactTypes="APPLICATION" result="FCENTROID(0,,I.TESTABILITY|3,I.STABILITY|2,I.MAINTAINABILITY)"/>
</Measure>
I.TESTABILITY is filtered out as it is not between the specified minimum and maximum.
The value is then computed as CENTROID(I.STABILITY|2,I.MAINTAINABILITY), which is (1x2 + 2) / (2+1).
Understanding filtered min, max and sum:
FMIN(,,-2,4,11)
is equivalent to: FMIN(-Infinity,+Infinity,-2,4,11)
is equivalent to: MIN(-2,4,11)
FMIN(0,10,-2,4,11)
is equivalent to: MIN(4,11)
FMIN(0,1,-2,4,11)
is equivalent to: MIN(), which evaluates to null
and leads to using the default value of the measure and marking
it in the indicator tree with the status ERROR.
FMIN(2,,1,I.LC)
is equivalent to: FMIN(2,+Infinity,1,I.lC)
is equivalent to: MIN(I.LC)
resolves to: I.LC if LC >= 2, else default value
FSUM(,,1,2.5,2>1,3)
is evaluated as: 1 + 2.5 + 1 + 3
FSUM(2,4,1,2.5,2>1,3)
is evaluated as: 2.5 + 3
FSUM(6,,-1,I.LC,LC)
resolves to: I.LC if >= 6 or LC if >= 6
More advanced decisions can be made when using the following conditional and level-related functions:
You can use the IF(cond,val_yes,val_no) function to assign different
values based on the result of a condition. Note that nested IF constructions are allowed, and an IF block can contain OR or AND operators (since 13-B).
A condition is simply a computation that returns 1 if true and 0 if false. For example,
result="SLOC>50"
returns 1 or 0 depending on the value of SLOC for the current artefact.
Use the CASE(measureId,case1:value1,case2:value2[,...][,DEFAULT:value]) function to
assign different values to a measure based on the value of another measure. A fallback can be specified
by using the DEFAULT case.
The NOT(computation) function returns 0 if the result of the computation
is greater than or equal to 1, or 1 otherwise.
The RANK(scale_id,level_id) function provides a way to retrieve rank values
from your model.
The FIND_RANK(scale_id,measure_id) function provides a way to retrieve a rank
from your model by passing a measure and a scale.
The APP(measure_id) function provides a way to retrieve the value of a measure
at application level from any artefact:
The PARENT(measure_id, [type]) and ANCESTOR(measure_id, [type]),
functions provide a way to get a measure value for an artefact's parent or ancestor containing this measure.
The concept is similar to that of the APP() function, but
PARENT() only checks the artefact's direct parent and ANCESTOR() goes up the
tree until finding an artefact (of the optionally specified type) that has the requested measure ID.
Both functions have an equivalent filtered function to limit the scope of the values included in the search, using the
syntax FPARENT(min,max,measure_id, [type]) and FANCESTOR(min,max,measure_id, [type]). Note
that if min or max are omitted, they are automatically replaced by -Infinity
and +Infinity respectively.
The IS_DP_OK(data_provider_name) function provides a way to find out
if a Data Provider was executed successfully or not during the analysis. If the data
provider was not executed or failed, the function returns 0. If the Data Provider was
executed successfully, then the function returns 1.
The DP_STATUS(data_provider_name) function provides finer information
about the execution status of a Data Provider than IS_DP_OK().
returns -1 if the DP was not run
returns 0 if the DP was successful
returns 1 if the DP returned some warnings
returns 2 if the DP reported errors
returns 3 if the DP stopped with a fatal error
The IS_ARTEFACT_TYPE(artefact_type) function provides a way to find out
if an artefact is of the type specified. If the artefact is of the type specified, the function returns 1,
else it returns 0.
Set a measure to 6 if SLOC is above a threshold, else set it to 4:
<Measure measureId="EXAMPLE" defaultValue="0">
<Computation targetArtefactTypes="FILE;FUNCTION;CLASS"
result="2+IF(SLOC>50,4,2)" />
</Measure>
Set a measure to 6 if SLOC is above a value and below another one, else set it to 4:
<Measure measureId="EXAMPLE" defaultValue="0">
<Computation targetArtefactTypes="FILE;FUNCTION;CLASS"
result="2+IF(SLOC>50 AND SLOC<100,4,2)" />
</Measure>
A nested IF construction:
<Measure measureId="EXAMPLE" defaultValue="0">
<Computation targetArtefactTypes="FILE;FUNCTION;CLASS"
result="2+IF(I.LC>IF(SLOC>300,SLOC,MAX(250,300)),98,8)" />
</Measure>
Example using NOT:
<Measure measureId="OLD_LARGE_FILE" defaultValue="0">
<Computation targetArtefactTypes="FILE"
result="NOT(IS_NEW_ARTEFACT() AND SLOC<500)" />
</Measure>
An example of CASE() statement (on the metric :
<Measure measureId="EASE_OF_USE" defaultValue="0">
	<Computation targetArtefactTypes="APPLICATION"
				 result="CASE(FEEDBACK,BAD:0,GOOD:50,EXCELLENT:80,DEFAULT:-1)" />
</Measure>
Retrieving rank values using RANK(), given the following scale:
<Scale scaleId="SCALE_LINE">
<ScaleLevel levelId="LEVELA" bounds="];10]"  rank="0" />
<ScaleLevel levelId="LEVELB" bounds="]10;30]" rank="1" />
<ScaleLevel levelId="LEVELC" bounds="]30;60]" rank="2" />
<ScaleLevel levelId="LEVELD" bounds="]60;100]" rank="4" />
<ScaleLevel levelId="LEVELE" bounds="]100;[" rank="8" />
</Scale>
You can use the RANK function as follows to find the rank of LEVELD. The example below returns 4:
<Measure measureId="EXAMPLE" defaultValue="0">
<Computation targetArtefactTypes="FILE;FUNCTION;CLASS"
result="RANK(SCALE_LINE,LEVELD)" />
</Measure>
For more information about scales, refer to the section called “Scales”.
Using RANK is useful when combined with conditions. The examples below are equivalent:
<Measure measureId="EXAMPLE" defaultValue="0">
<Computation targetArtefactTypes="FILE;FUNCTION;CLASS"
result="IF(I.LC>4,1,0)" />
</Measure>
<Measure measureId="EXAMPLE" defaultValue="0">
<Computation targetArtefactTypes="FILE;FUNCTION;CLASS"
result="IF(I.LC>RANK(SCALE_LINE,LEVELD),1,0)" />
</Measure>
<Measure measureId="EXAMPLE" defaultValue="0">
<Computation targetArtefactTypes="FILE;FUNCTION;CLASS"
result="IF(I.LC>LEVELD,1,0)" />
</Measure>
In the last example, we use the short syntax for the RANK function: >LEVELD
is only valid when used after an indicator. The rank retrieved is the rank of level LEVELD for the scale
of the current artefact type for the indicator LC.
The FIND_RANK() function is mostly useful when using dynamic scales
(see the section called “Dynamic Scales”). The example below assigns to TEST_COVERAGE_RANK
the value of the rank for the value of COVERAGE on the scale DYN_SCALE_OK_KO:
<Measure measureId="OBJECTIVE" targetArtefactTypes="APPLICATION;FODLER;FILE;CLASS" defaultValue="0" />
<Measure measureId="COVERAGE" targetArtefactTypes="APPLICATION;FODLER;FILE;CLASS" defaultValue="0" />

<Scale scaleId="DYN_SCALE_OK_KO">
    <ScaleLevel levelId="DYN_OK" bounds="[;APP(OBJECTIVE)]"  rank="0" />
    <ScaleLevel levelId="DYN_KO" bounds="[APP(OBJECTIVE);]" rank="1" />
</Scale>

<Scale scaleId="SCALE_OK_KO">
    <ScaleLevel levelId="OK" bounds="[1;1]"  rank="0" />
    <ScaleLevel levelId="KO" bounds="[0;0]" rank="1" />
</Scale>

<Measure measureId="TEST_COVERAGE_RANK">
	<Computation targetArtefactTypes="APPLICATION"
				 result="FIND_RANK(DYN_SCALE_OK_KO,COVERAGE)" />
</Measure>

<Indicator
    indicatorId="TEST_COVERAGE"
    measureId="TEST_COVERAGE_RANK"
    scaleId="SCALE_OK_KO" />
Compute the percentage of lines of code present in the current artefact
using the entire application as the reference, with APP():
<Measure measureId="EXAMPLE" defaultValue="0">
<Computation targetArtefactTypes="FILE;FUNCTION;CLASS"
result="(LC*100)/APP(LC)" />
</Measure>
Mark a method as risky if the parent class has changed, using PARENT():
<Measure measureId="RISKY" defaultValue="0">
<Computation targetArtefactTypes="FUNCTION"
result="PARENT(CHANGED,CLASS)" />
</Measure>
Set an artefact as critical if one of its containing folder is critical:
<Measure measureId="IS_CRITICAL" defaultValue="0">
<Computation targetArtefactTypes="FOLDER;CLASS;FUNCTION"
result="ANCESTOR(IS_CRITICAL,FOLDER)" />
</Measure>
Filtering with FPARENT():
IF(FPARENT(RANK(SCALE_LINE,LEVELG), RANK(SCALE_LINE,LEVELG), I.LC),1,2)
=> resolves as: IF(PARENT(I.LC)=RANK(SCALE_LINE,LEVELG),1,2)
=> return 1 if PARENT(I.LC) = LEVELG, otherwise 2
Filtering with FANCESTOR():
FANCESTOR(500,, LC, FOLDER)
=> returns LC for the first folder ancestor where LC >= 500
Find out if the Checkstyle Data Provider was executed successfully with IS_DP_OK:
<Measure measureId="RAN_CHECKSTYLE" defaultValue="0">
<Computation targetArtefactTypes="APPLICATION;FOLDER;FILE;FUNCTION"
result="IS_DP_OK(Checkstyle)" />
</Measure>
Do something if the artefact is a CHANGE_REQUEST, with IS_ARTEFACT_TYPE:
<ArtefactType id="ISSUE" heirs="BUG;CHANGE_REQUEST;HOTLINE;REGRESSION" />
<Measure measureId="IS_CR" defaultValue="0">
<Computation targetArtefactTypes="ISSUE"
result="IS_ARTEFACT_TYPE("CHANGE_REQUEST")" />
</Measure>
Temporal functions allow to retrieve and use values computed in the previous baseline. The available operators are:
PREVIOUS_VALUE(ID) to get the previous value of a measure or indicator
DELTA_VALUE(ID) to use the computed difference between the current value of a measure or indicator and its previous value
PREVIOUS_INFO(INFO_ID) allows retrieving the value of some artefact information in the previous version so it can be compared with the current artefact information (This is useful when combined with the EQUALS() or MATCHES() functions, as described in the section called “String Matching Functions”).
IS_NEW_ARTEFACT()tests whether the artefact is new for the current version of the project. It returns 1 if true, 0 if false.
Using the value of LC from the previous analysis:
<Measure measureId="EXAMPLE" defaultValue="0">
<Computation targetArtefactTypes="FILE;FUNCTION;CLASS"
result="PREVIOUS_VALUE(LC)" />
</Measure>
Using the difference between the value of LC in the current analysis and its previous value:
<Measure measureId="EXAMPLE" defaultValue="0">
<Computation targetArtefactTypes="FILE;FUNCTION;CLASS"
result="DELTA_VALUE(LC)" />
</Measure>
Obtaining the difference in ranking between two analyses for an artefact:
<Measure measureId="EXAMPLE" defaultValue="0">
<Computation targetArtefactTypes="FILE;FUNCTION;CLASS"
result="DELTA_VALUE(RANK)" />
</Measure>
Defining a measure whose value is set to 1 when the artefact is new, else 0:
<Measure measureId="EXAMPLE" defaultValue="0">
<Computation targetArtefactTypes="FILE;FUNCTION;CLASS"
result="IS_NEW_ARTEFACT()" />
</Measure>
Using IS_NEW_ARTEFACT as a condition operator:
<Measure measureId="EXAMPLE" defaultValue="0">
<Computation targetArtefactTypes="FILE;FUNCTION;CLASS"
result="IF(IS_NEW_ARTEFACT(),3,4)" />
</Measure>
Note: IF(IS_NEW_ARTEFACT(),val_yes,val_no) is equivalent to IF(IS_NEW_ARTEFACT()>0,val_yes,val_no)
You can use the following operators to work with dates in your model:
DATE(yearParam,monthParam,dayParam) to convert year/month/day numbers to a date
DAYS(param) to pass a number as a number of days
TO_DAYS(dateDifference) to evaluate the number of dates between two dates
TODAY() to retrieve today's date at midnight
NOW() to retrieve today's exact date and time at the time of the analysis
VERSION_DATE() to retrieve the version's date. By default, this is the same value
as the time of the analysis (NOW()), but users are allowed to specify a different date different
from the current one.
Note: Dates are computed and stored internally as the number of milliseconds since January 1st 1970. However, calculations involving dates are designed to work with a number of days, not hours or minutes.
Converting to the date 28th July 1979:
<Measure measureId="EXAMPLE" defaultValue="0">
<Computation targetArtefactTypes="FILE;FUNCTION;CLASS"
result="DATE(1979,07,28)" />
</Measure>
Converting to a date using measure IDs:
<Measure measureId="EXAMPLE" defaultValue="0">
<Computation targetArtefactTypes="FILE;FUNCTION;CLASS"
result="DATE(YEAR_START+2,MONTH_START+MONTHS_SPENT,TARGET_DAY)" />
</Measure>
Find the number of days since the start of the project (the project attribute PROJECT_START_DATE) until today
<Measure measureId="EXAMPLE" defaultValue="0">
<Computation targetArtefactTypes="FILE;FUNCTION;CLASS"
result="TO_DAYS(TODAY()-PROJECT_START_DATE)" />
</Measure>
Add 4 days to May 19th 2012 to obtain May 23rd 2012:
<Measure measureId="EXAMPLE" defaultValue="0">
<Computation targetArtefactTypes="FILE;FUNCTION;CLASS"
result="DATE(2012,05,19)+DAYS(4)" />
</Measure>
Calculate whether an issue expires within a week of the analysis:
<Measure measureId="EXPIRES_THIS_WEEK" defaultValue="0">
<Computation targetArtefactTypes="BUG;CR"
result="IF(EXPIRY_DATE - DAYS(7) < VERSION_DATE(),1,0)" />
</Measure>
In order to extract the specific information that is added to artefacts by various Data Providers, you can use the
INFO(info_tag) and ARTEFACT_NAME() functions. Both functions return a string containing the
information requested. You can then use these string matching functions in your computations:
EQUALS('string','string'[, forceIgnoreCase])
CONTAINS('string','string'[, forceIgnoreCase])
STARTS_WITH('string','string'[, forceIgnoreCase])
ENDS_WITH('string','string'[, forceIgnoreCase])
MATCHES('string','regexp'[, forceIgnoreCase])
forceIgnoreCase is an optional boolean
set to 1 by default. If you want to perform a case-sensitive search,
use 0, instead.
You can also retrieve the previous value of some artefact information using the PREVIOUS_INFO() function, as described in the section called “Temporal Functions”
Here are some examples for these functions, based on an artefact with the following data:
<I n="LANGUAGES" v="Java, C#, C++, C"/>
<I n="AUTHOR" v="gabriel"/>
<I n="URL" v="http://www.my_url.com"/> [^]
<I n="ONE_LANGUAGE" v="JaVa"/>
EQUALS()
EQUALS(INFO(AUTHOR), 'gabriel')
=> 1
EQUALS(INFO(LANGUAGES), 'Java, C#, C++, C', 0)
=> 1
STARTS_WITH()
STARTS_WITH(INFO(URL), 'HTTP')
=> 1
STARTS_WITH(INFO(URL), 'HTTPS')
=> 0
ENDS_WITH()
ENDS_WITH(INFO(URL), '.COM')
=> 1
ENDS_WITH(INFO(URL), '.COM', 0)
=> 0 (note the case-sensitive flag)
CONTAINS()
CONTAINS(INFO(LANGUAGES), 'C++')
=> 1
CONTAINS(INFO(LANGUAGES), 'Cobol')
=> 0
CONTAINS(INFO(LANGUAGES), INFO(ONE_LANGUAGE), 1)
=> 1
MATCHES()
MATCHES(INFO(LANGUAGES), 'J.*', 0)
=> 1
MATCHES(INFO(LANGUAGES), '.*(, C\+\+).*', 0)
=> 1
MATCHES(INFO(LANGUAGES), '.*(, C\+\+\+).*', 0)
=> 0
Queries allow to perform calculations on a set of values, optionally applying some conditions.
You can think of a query as an structured statement similar to:
[COMPUTE_VALUE] FROM [SCOPE] WHERE [CONDITION]
In this section, you will learn how to compute values, define a scope and write conditions for your queries.
Queries provide the following operators to compute values:
Returns the sum of values returned for a set.
The SUM of values [1, 3, 3, 3, 5, 6] is 21.
Return the maximum or minimum value of a set.
The MAX and MIN of values [1, 3, 3, 3, 5, 6] are 6 and 1 respectively.
Returns the mean of all the values returned for a set.
The AVR of values [1, 3, 3, 3, 5, 6] is 3.5.
Returns the product of all the values returned for a set.
The MUL of values [1, 3, 3, 3, 5, 6] is 810.
Counts the number of elements returned for a set.
The COUNT of values [1, 3, 3, 3, 5, 6] is 6.
The COUNT operator offers the following variations:
ARTEFACT_TYPE is one of
FOLDER, APPLICATION,
FILE, or other types defined in your model. The scope of this tree-like hierarchy is defined as follows, relative to the current artefact, or node:
NODE and DESCENDANTNODE and CHILDREN.Defining a condition in your query means filtering out of the scope the results that do not meet
the condition. Several conditions can be added with the AND and OR operators,
and OR takes priority over AND. A condition consists of an operand,
a comparator, and a value. Note that parentheses are not allowed in the body of a condition. An example is shown below:
<Computation
targetArtefactTypes="FUNCTION;FILE;FOLDER;
APPLICATION;CLASS;PROGRAM"
result="COUNT RULE FROM TREE WHERE NBOCCURRENCES>=1 AND
FAMILY=MATURITY" />
All operands described in the section called “Operands” are allowed. Operators allowed for
conditions are: =,!=, <,
>, <=
and >=. Note that XML does not allow using <
directly in an attribute, therefore you will need to insert it using an entity:
<.
If you are using queries to retrieve metrics from artefacts or to count artefacts, your conditions can use regular computation syntax and function. Refer to the section called “Operands”, the section called “Simple Calculation Syntax”and the section called “Functions” for more details.
If you are using queries to retrieve metrics for the number of rules or violations, use the syntax from this section.
NBOCCURRENCES (=, <, >, <=, >=,!=)
COUNT RULE FROM DESCENDANTS WHERE NBOCCURRENCES<10
COUNT RULE FROM DESCENDANTS WHERE NBOCCURRENCES>10
COUNT RULE FROM DESCENDANTS WHERE NBOCCURRENCES=1
COUNT RULE FROM DESCENDANTS WHERE NBOCCURRENCES!=1
COUNT RULE FROM DESCENDANTS WHERE NBOCCURRENCES<=1.0
COUNT RULE FROM DESCENDANTS WHERE NBOCCURRENCES>=1
CATEGORY (=, !=)
COUNT RULE FROM DESCENDANTS WHERE CATEGORY=SCALE_PRIORITY.REQUIRED
COUNT RULE.OCCURRENCES FROM DESCENDANTS WHERE CATEGORY!=SCALE_PRIORITY.REQUIRED
FAMILY (=, !=) for rules
COUNT RULE FROM DESCENDANTS WHERE FAMILY=REQUIRED
COUNT RULE FROM DESCENDANTS WHERE FAMILY!=REQUIRED
MEASUREID (=, !=)
COUNT RULE FROM DESCENDANTS WHERE MEASUREID!=R_NOGOTO
MULTI-CONDITION
COUNT FILE FROM DESCENDANTS WHERE LEVEL!=LEVELC
OR FAMILY=HIS AND B.LC>10
Since OR takes priority over AND,
this will be interpreted as:
(LEVEL!=LEVELC OR FAMILY=HIS) AND B.LC>10
ALL (as a shortcut for all available types)
COUNT ALL FROM DESCENDANTS WHERE LEVEL>LEVELC
SUM ALL.TECH_DEBT_TYPE FROM TREE
The following examples are explained in details to help you understand how computations work.
This example counts the number of rules in the "required" family that were violated in the selected artefact and all its descendants.
COUNT RULE FROM TREE WHERE
NBOCCURRENCES>=1 AND FAMILY=REQUIRED
This example counts the number of violations of the R_COMPOUNDELSE rule in the children of the selected artefact.
COUNT RULE.OCCURRENCES FROM DESCENDANTS
WHERE MEASUREID=R_COMPOUNDELSE
This example counts the number of programs with a LEVEL of LEVELG, starting from the children of the considered artefact.
COUNT PROGRAM FROM DESCENDANTS WHERE LEVEL=LEVELG
This example counts the number of required rules that were violated in the selected artefact and all its descendants.
COUNT RULE FROM TREE WHERE NBOCCURRENCES>=1
AND FAMILY=REQUIRED
This example counts the number of issues with the status "fixed" created in the last 60 days
COUNT ISSUE FROM TREE
WHERE EQUALS(INFO('STATUS'), 'FIXED')
AND DATE_SUBMITTED >= TODAY() - DAYS(60)
Table of Contents
All dashboards available in Squore can be easily configured. Dashboards are specific to a model, and depend on the role of the user in the current project.
Each
model defined in the Squore
Configuration defines its own set of dashboards in the model's bundle
file,
located in
Squore_HOME/Configuration/models/MyModel/Dashboards/Bundle.xml
. The bundle uses a lot of XML inclusion for
convenience, but some elements can be easily
recognised:
<?xml version="1.0" encoding="UTF-8"?>
<roles xmlns:xi="http://www.w3.org/2001/XInclude">
  <role name="DEFAULT">
    <dashboard type="MODEL" nbColumns="2" factor="3">
      <charts>
        <xi:include href="rule_compliance_vs_complexity__size_quadrant.xml" />
        <xi:include href="CodeCloning/size_vs_code_cloning_quadrant.xml" />
      </charts>
      <xi:include href="SQuORE_RiskIndex/project_summary_table.xml" />
    </dashboard>
    <dashboard type="APPLICATION" nbColumns="3" template="1:3x1;2:2x2;3:1x2">
      <scorecard>
        <xi:include href="../../Shared/Analysis/key_performance_indicator.xml" />
        <tables>
          <xi:include href="MaintenancePerformance/maintenance_performance_table.xml" />
          <xi:include href="ArtefactRating/artefact_table_oo.xml" />
          <xi:include href="TechnicalDebt/exploded_technical_debt_table.xml" />
        </tables>
      </scorecard>
      <charts>
        <xi:include href="ControlFlowAnalysis/CyclomaticComplexity/complexity_trend.xml" />
        <xi:include href="StabilityIndex/StabilityCChart.xml" />
        <xi:include href="ArtefactRating/StatementStackedBar.xml" />
        <xi:include href="LineCounting/LineCountHisto.xml" />
      </charts>
    </dashboard>
  </role>
</roles>
There are two types of dashboards:
The Analysis Model Dashboard: a view that is activated when clicking the name of a model or a sub group in the Project Portfolios. This dashboard contains one or more charts and a table that displays information about all the projects in the Explorer for this model. This is described in the section called “Analysis Model Dashboards”.
The Artefact Dashboard: a view that is displayed when clicking an artefact in the Artefact Tree. This dashboard contains two sections: a score card and a charts area. This dashboard is described in the section called “Artefact Type Dashboards”.
This specific dashboard displays information relative to all projects analysed with the current analysis model or group of project. It consists of a list of charts and a table with all the projects using this analysis model in this group and some chosen values (columns) to ease comparison between them.
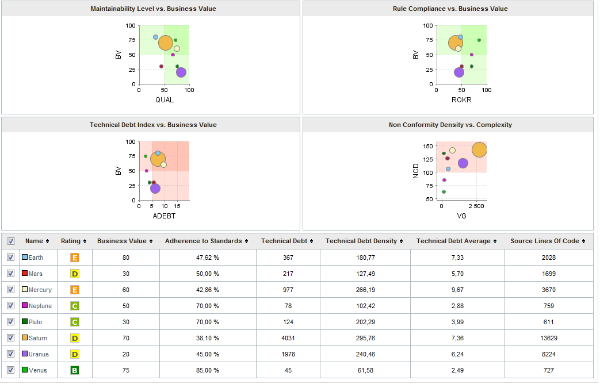
Analysis Model Dashboard
Its structure is as follows:
<dashboard type="MODEL" nbColumns="2"
scoreGroups="true" indicatorId="PERFORMANCE" aggregationType="AVG"
defaultWidthValue="500" defaultHeightValue="500">
<charts>
...
</charts>
<table id="PROJECT_SUMMARY"
hideLastVersion="false" hideCreator="true"
hideGroup="true" hideLevel="false">
...
</table>
</dashboard>
The dashboard
element supports the following attributes:
type
(mandatory)
is the type of artefact that this dashboard definition applies to.
nbColumns
(optional, default: 3)
sets the number of columns used to display the charts on the dashboard.
defaultWidthValue
(optional, default: 400)
sets the default width of a maximised chart if not specified within the chart itself.
defaultHeightValue
(optional, default: 400)
sets the default height of a maximised chart if not specified within the chart itself.
factor
(optional, default: 1.5)
is the zoom factor for thumbnails on the dashboard. Factor 1 is equivalent to a thumbnail size of 100 pixels.
template
(optional, default: 1x1 for all charts)
allows changing the aspect ratio of charts in the dashboard, using the syntax "position:width x height;".
Note that the use of this attribute requires defining a value for the nbColumns
attribute.
For more details about dashboard templates, refer to the section called “Dashboard Templates”.
In order to tell Squore to rate groups of project, you can use the following attributes for
the dashboard
element (since 14-A):
scoreGroups
(optional, default: false) turns the rating display on or off for groups of projects. When rating groups is disabled, you can use a group icon instead by defining it in a properties file (G.<group_name>.ICON=path/to/icon.ico).
indicatorId
(optional, default: LEVEL) is the indicator to use to rate the project group when
scoreGroups
is set to true.
aggregationType
(optional, default: AVG) is the aggregation method used to compute the indicator level
when scoreGroups
is set to true. The values allowed are MIN,
MAX, OCC, AVG, DEV, SUM,
MED and MOD.
The charts area allows displaying a series charts. Only the following charts are supported at this level: Quadrant, Kiviat, Temporal Evolution Line Chart, Dial, Meter, Treemap, SQALE Pyramid.
The table area shows information about the projects analysed with the current model. Projects that do not belong to the portfolio are not shown.
The first column allows to check or uncheck the projects whose information
should be used to compute data on the charts. The information can be aggregated in the charts
in several ways using the aggregationType
attribute of a
measure
or indicator
element. At model-level,
aggregating has the effect of showing one line per project for each metric defined in the chart.
You can find out more about this attribute in the section called “Common Attributes for measure and indicator
”.
Other columns, showing specific information about the project, are defined as follows:
<table id="PROJECT_SUMMARY"
  hideLastVersion="false" hideCreator="true"
  hideGroup="true" hideLevel="false">
  <column indicatorId="BUSINESS_VALUE" headerDisplayType="NAME"
  displayType="VALUE" "decimals="0" suffix=""/>
  <column indicatorId="QUALITY" headerDisplayType="NAME"
  displayType="VALUE" decimals="2" suffix="%"/>
  <column indicatorId="TECH_DEBT" headerDisplayType="NAME"
  displayType="VALUE" decimals="0" suffix=""/>
  <column indicatorId="TECH_DEBT_IDX" headerDisplayType="NAME"
  displayType="VALUE" decimals="2" suffix="/FUNC"/>
  <column indicatorId="SUMSLOC" headerDisplayType="NAME"
  displayType="VALUE" decimals="0" suffix=""/>
</table>
The
column
sub-element has the following attributes:
indicatorId
is the unique identifier of the indicator to be displayed.
headerDisplayType
(at model-level) or
displayType
(at artefact-level)
(optional, default: MNEMONIC)
defines how the indicator is shown in the interface. It may be one
of NAME, MNEMONIC, or DESCRIPTION.
displayOnlyIf (since 14-A)
(optional) allows specifying a computation to evaluate whether or not to show the chart in the dashboard. If
the result of the computation is more than 0, then the chart is displayed. Consult Chapter 5, Computation Syntax for
more information about the supported computation syntax. Note that computations used in
displayOnlyIf
have a limited scope: they only apply to the current node in its current version.
This means that the functions like PREVIOUS_VALUE(), PREVIOUS_INFO(), DELTA_VALUE(), APP(), ANCESTOR(), PARENT() or
IS_DP_OK() cannot be used with displayOnlyIf
.
displayedValue
(optional)
allows overriding the indicator to display another measure instead.
The attribute takes a measure Id (displayedValue="SLOC").
displayType
(at model-level) or
displayValueType
(at artefact-level)
(optional, default: VALUE)
defines how the indicator's value is shown in the interface. It
may be one of:
NAME the level's name
MNEMONIC (since 13-A) the level's mnemonic
RANK (since 13-A) the level's rank
VALUE the measure's value
ICON the level's icon
DATE (since 13-A) the measure value converted to date format
DATETIME (since 13-A) the measure value converted to datetime format
TIME (since 13-A) the measure value converted to time format
TEXT (since 14-A) when the metric you are trying to display is textual information, as described in the section called “Using Textual Information From Artefacts”
For DATE,DATETIME and TIME, you can specify the required format using the dateStyle, timeStyle and datePattern attributes described below.
unknownValue
(optional, default: "?") (since 14-B) defines what text
to display if the level of the indicator is UNKNOWN or outside the specified dataBounds
. Set this to OFF
to use the old behaviour (which display the rank -1).
emptyValue
(optional, default: "-") (since 14-B) defines what text
to display if there is no value in the database for the specified metric, or if a date is not specified.
This is usually useful if a date has not been set yet manually in a form (and is therefore equal to 0), or if you have just added a
new metric to your model you want to display specific text for the versions of your project where this metric did
not exist yet.
dataBounds
(optional, default:[;[) (since 14-B) allows overriding the normal range of values that would trigger the display of the
unknownValue
text. This allows you to display the unknown value if the metric
associated with the indicator is not within the defined bounds.
dateStyle (optional, default: DEFAULT): the date formatting style,
used when the displayType is one of DATE or DATETIME.
timeStyle (optional, default: DEFAULT): the time formatting style,
used when the displayType is one of DATETIME or TIME. See above for available styles.datePattern (formerly dateFormat) (optional, default: empty): the date pattern, used when
the displayType is one of DATE,
DATETIME or TIME.
suffix
(optional, default: empty)
is the unit to be displayed after values.
decimals
(optional, default: 0)
is the number of decimals places to be used for displaying values (only
used with the VALUE display type).
roundingMode
(optional, default: HALF_EVEN)
defines the behaviour used for rounding the numerical values displayed. The supported values are:
CEILING to round towards positive infinity.
DOWN to round towards zero.
FLOOR to round towards negative infinity.
HALF_DOWN to round towards "nearest neighbour" unless both neighbours are equidistant, in which case round down.
HALF_EVEN to round towards the "nearest neighbour" unless both neighbours are equidistant, in which case, round towards the even neighbour.
HALF_UP to round towards "nearest neighbour" unless both neighbours are equidistant, in which case round up.
UP to round away from zero.
For more examples of rounding mode, consult http://docs.oracle.com/javase/6/docs/api/java/math/RoundingMode.html.
Dashboards for artefacts consist of two areas: the scorecard area and the charts area. When clicking the name of an analysis model instead of an artefact, then a special dashboard is used: the Analysis Model Dashboard.
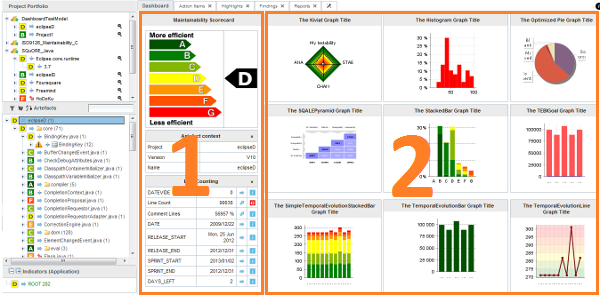
The Squore Artefact Dashboard Areas
The type of the artefact targeted is specified in the definition of the dashboard. The number of columns used in the graphics area and the default width and height of graphics can optionally be set.
<dashboard type="APPLICATION" nbColumns="3"
  defaultWidthValue="500" defaultHeightValue="500" >
  <scorecard> ... </scorecard>
  <charts> ... </charts>
</dashboard>
The dashboard
element supports the following sub-elements:
The dashboard
element supports the following attributes:
type
(mandatory)
is the type of artefact that this dashboard definition applies to.
nbColumns
(optional, default: 3)
sets the number of columns used to display the charts on the dashboard.
defaultWidthValue
(optional, default: 400)
sets the default width of a maximised chart if not specified within the chart itself.
defaultHeightValue
(optional, default: 400)
sets the default height of a maximised chart if not specified within the chart itself.
factor
(optional, default: 1.5)
is the zoom factor for thumbnails on the dashboard. Factor 1 is equivalent to a thumbnail size of 100 pixels.
template
(optional, default: 1x1 for all charts)
allows changing the aspect ratio of charts in the dashboard, using the syntax "position:width x height;".
Note that the use of this attribute requires defining a value for the nbColumns
attribute.
For more details about dashboard templates, refer to the section called “Dashboard Templates”.
The scorecard shows a picture representing a chart (usually the artefact KPI) and a set of tables with further information. Each table has its own set of lines with various information. The structure used to define the scorecard is shown below:
<scorecard>
  <chart ... />
  <tables>
  <table id="DECISION_MAKING" opened="true">
  <line indicatorId="BUSINESS_VALUE"
  displayType="NAME"
  decimals="0"
  suffix="FP" />
  ...
  </table>
  ...
  </tables>
</scorecard>
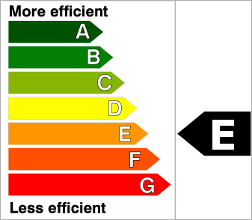
Key Performance Indicator
For more information about how to insert a KPI into the scorecard, refer to Key Performance Indicator.
There may be any number of tables below the KPI chart, and there may be any number of lines in each table.
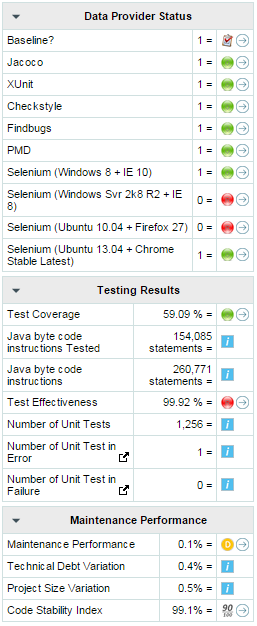
A scorecard information table using 3 tables with respectively 10, 7, and 4 lines.
A scorecard table is defined using the following syntax:
<tables displayContext="false" >
  <table name="My Table Name" id="TABLE_ID" opened="true">
  <line indicatorId="BUSINESS_VALUE" displayType="NAME"
  decimals="0" suffix="FP"
  emptyValue="-" exclude="TESTER" />
  <line indicatorId="QUALITY" displayType="NAME"
  decimals="1" suffix="%" />
  <line indicatorId="SI" displayType="NAME"
  decimals="1" suffix="%" />
  </table>
  <table id="TABLE_ID">
  ...
  </table>
  ...
</tables>
The tables
element
takes an optional displayContext
attribute that automatically inserts an Artefact context
table containing the current artefact's project, version and name, as shown below:
The artefact context table
The table name is not configurable
The table
element accepts the following attributes:
id
(mandatory) is used to find the localised
version of the table name in a .properties file.
name
(optional, default: empty) allows bypassing the search for a localised string
opened
(optional, default: false) defines whether a table is opened or collapsed by default
displayType
(optional, default: no default) defines the
displayType
to be used by all lines in this table. It can be overridden for each line if necessary. For
full details, consult the displayType reference for the line element.
displayOnlyIf (since 14-A)
(optional) allows specifying a computation to evaluate whether or not to show the chart in the dashboard. If
the result of the computation is more than 0, then the chart is displayed. Consult Chapter 5, Computation Syntax for
more information about the supported computation syntax. Note that computations used in
displayOnlyIf
have a limited scope: they only apply to the current node in its current version.
This means that the functions like PREVIOUS_VALUE(), PREVIOUS_INFO(), DELTA_VALUE(), APP(), ANCESTOR(), PARENT() or
IS_DP_OK() cannot be used with displayOnlyIf
.
The line
element accepts the following attributes:
indicatorId
is the unique identifier of the indicator to be displayed.
headerDisplayType
(at model-level) or
displayType
(at artefact-level)
(optional, default: MNEMONIC)
defines how the indicator is shown in the interface. It may be one
of NAME, MNEMONIC, or DESCRIPTION.
displayOnlyIf (since 14-A)
(optional) allows specifying a computation to evaluate whether or not to show the chart in the dashboard. If
the result of the computation is more than 0, then the chart is displayed. Consult Chapter 5, Computation Syntax for
more information about the supported computation syntax. Note that computations used in
displayOnlyIf
have a limited scope: they only apply to the current node in its current version.
This means that the functions like PREVIOUS_VALUE(), PREVIOUS_INFO(), DELTA_VALUE(), APP(), ANCESTOR(), PARENT() or
IS_DP_OK() cannot be used with displayOnlyIf
.
displayedValue
(optional)
allows overriding the indicator to display another measure instead.
The attribute takes a measure Id (displayedValue="SLOC").
displayType
(at model-level) or
displayValueType
(at artefact-level)
(optional, default: VALUE)
defines how the indicator's value is shown in the interface. It
may be one of:
NAME the level's name
MNEMONIC (since 13-A) the level's mnemonic
RANK (since 13-A) the level's rank
VALUE the measure's value
ICON the level's icon
DATE (since 13-A) the measure value converted to date format
DATETIME (since 13-A) the measure value converted to datetime format
TIME (since 13-A) the measure value converted to time format
TEXT (since 14-A) when the metric you are trying to display is textual information, as described in the section called “Using Textual Information From Artefacts”
For DATE,DATETIME and TIME, you can specify the required format using the dateStyle, timeStyle and datePattern attributes described below.
unknownValue
(optional, default: "?") (since 14-B) defines what text
to display if the level of the indicator is UNKNOWN or outside the specified dataBounds
. Set this to OFF
to use the old behaviour (which display the rank -1).
emptyValue
(optional, default: "-") (since 14-B) defines what text
to display if there is no value in the database for the specified metric, or if a date is not specified.
This is usually useful if a date has not been set yet manually in a form (and is therefore equal to 0), or if you have just added a
new metric to your model you want to display specific text for the versions of your project where this metric did
not exist yet.
dataBounds
(optional, default:[;[) (since 14-B) allows overriding the normal range of values that would trigger the display of the
unknownValue
text. This allows you to display the unknown value if the metric
associated with the indicator is not within the defined bounds.
dateStyle (optional, default: DEFAULT): the date formatting style,
used when the displayType is one of DATE or DATETIME.
timeStyle (optional, default: DEFAULT): the time formatting style,
used when the displayType is one of DATETIME or TIME. See above for available styles.datePattern (formerly dateFormat) (optional, default: empty): the date pattern, used when
the displayType is one of DATE,
DATETIME or TIME.
suffix
(optional, default: empty)
is the unit to be displayed after values.
decimals
(optional, default: 0)
is the number of decimals places to be used for displaying values (only
used with the VALUE display type).
roundingMode
(optional, default: HALF_EVEN)
defines the behaviour used for rounding the numerical values displayed. The supported values are:
CEILING to round towards positive infinity.
DOWN to round towards zero.
FLOOR to round towards negative infinity.
HALF_DOWN to round towards "nearest neighbour" unless both neighbours are equidistant, in which case round down.
HALF_EVEN to round towards the "nearest neighbour" unless both neighbours are equidistant, in which case, round towards the even neighbour.
HALF_UP to round towards "nearest neighbour" unless both neighbours are equidistant, in which case round up.
UP to round away from zero.
For more examples of rounding mode, consult http://docs.oracle.com/javase/6/docs/api/java/math/RoundingMode.html.
The links in the lines of the score card tables are generated automatically according to the metric that
the line displays. They will generally link to the list of findings that are used to compute
the metric. You can however override the URL and set your own external URL. In order to do this, ensure that the metric
MY_METRIC displayed in a table line has a
MY_METRIC.URL
property defined in a properties file in your model. For more information about properties files, consult the section called “Descriptions”.
You can use dashboard templates to highlight some of the charts on your dashboard by changing their size in terms of grid slots they occupy. The following is an example template that uses 4 columns of charts with custom aspect ratios applied to the first three charts:
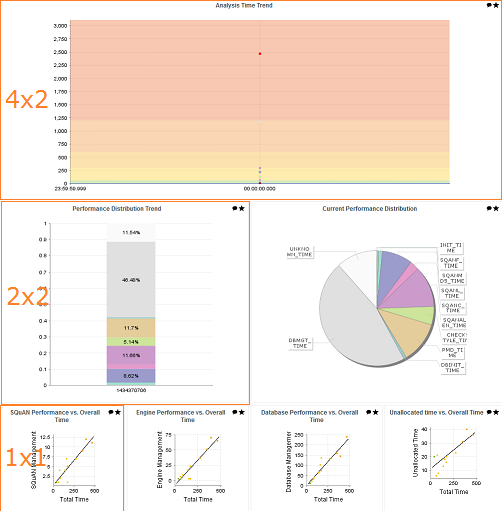
<?xml version="1.0" encoding="UTF-8"?>
<roles xmlns:xi="http://www.w3.org/2001/XInclude">
  <role name="DEFAULT">
    <dashboard nbColumns="4" type="APPLICATION" template="1:4x2;2:2x2;3:2x2">
       (...)
      <charts>
        <xi:include href="chart1.xml" />
        <xi:include href="chart2.xml" />
        <xi:include href="chart3.xml" />
        <xi:include href="chart4.xml" />
        <xi:include href="chart5.xml" />
        <xi:include href="chart6.xml" />
        <xi:include href="chart7.xml" />
      </charts>
    </dashboard>
  </role>
</roles>
Note that you only need to specify custom dimensions for non-standard charts sizes using the syntax "position:width x height;", other charts will use a 1x1 grid slot by default.
Charts are displayed on the right hand side of the dashboard. They
are defined through
chart
elements as follows:
<charts>
  <chart id="CHART_ID" type="CHART_TYPE">
  <indicator>INDICATOR_1</indicator>
  <indicator>INDICATOR_2</indicator>
  <indicator>INDICATOR_3</indicator>
  </chart>
  <chart id="CHART_ID">
  ...
  </chart>
  ...
</charts>
There are many types of charts, all referenced in this section. The best approach to finding the chart you want to use on your dashboard can be found by answering the following questions:
Should my chart display a trend or reflect the data for a single version of my project?
Is the information I want to display abut the current artefact or about its descendants?
Will my chart display one bit of information or combine several?
Is the information displayed by my chart quantitative or qualitative?
Answering these questions will lead you toward the type of chart you want to use. The table below shows the type of answer offered by each of the charts available in Squore:
Table 6.1. Charts for Single-Version Data Visualisation
| Current Artefact Data | Descendants of the Current Artefact | ||||||
| Quantitative Information | Qualitative Information | Quantitative Information | Qualitative Information | ||||
|
Single Dataset | Multiple Datasets |
Single Dataset | Multiple Datasets |
Single Dataset | Multiple Datasets |
Single Dataset | Multiple Datasets |
| N/A | |||||||
Table 6.2. Charts for Trend-Based Visualisation
| Current Artefact Data | Descendants of the Current Artefact | ||||||
| Quantitative Information | Qualitative Information | Quantitative Information | Qualitative Information | ||||
|
Single Dataset | Multiple Datasets |
Single Dataset | Multiple Datasets |
Single Dataset | Multiple Datasets |
Single Dataset | Multiple Datasets |
| N/A | N/A | N/A | N/A | N/A | |||
More information about charts and their configuration options can be found in Chapter 7, Charts Reference
Table of Contents
In this chapter, you can find all the configuration options available for the charts supported in Squore. The following sections will cover in details the different types of charts offered by Squore.
Although attributes may be different depending on the type of chart, some are common to all charts:
type
(mandatory) defines the type of chart, as listed
below.
id
(mandatory) is an unique identifier for the chart that can be used to add a localisable description in properties files.
name
(optional) is the display name of the chart on the dashboard. Note that the value of this attribute is used as a
fallback in case no translation is found for the chart's ID.
You should use C.CHART_ID.NAME=My Chart Name
in a properties file to define a chart's name for CHART_ID instead of using this attribute.
orientation (since 14-B)
(optional, default: VERTICAL) allows defining the orientation of the chart. The allowed values are VERTICAL and HORIZONTAL.
xMin, xMax
(optional, defaults to automatic values) allow defining the desired boundaries for the x-axis. This attribute
can be specified as a value or as a computation (since 15-A).
yMin, yMax
(optional, defaults to automatic values) allow defining the desired boundaries for the y-axis. This attribute
can be specified as a value or as a computation (since 15-A).
displayOnlyIf (since 14-A)
(optional) allows specifying a computation to evaluate whether or not to show the chart in the dashboard. If
the result of the computation is more than 0, then the chart is displayed. Consult Chapter 5, Computation Syntax for
more information about the supported computation syntax. Note that computations used in
displayOnlyIf
have a limited scope: they only apply to the current node in its current version.
This means that the functions like PREVIOUS_VALUE(), PREVIOUS_INFO(), DELTA_VALUE(), APP(), ANCESTOR(), PARENT() or
IS_DP_OK() cannot be used with displayOnlyIf
.
exclude
(optional) allows specifying a list of roles that will not see the chart.
xLabel
(optional) overrides the default name given to the x axis for charts that use axes.
yLabel
(optional) overrides the default name given to the x axis for charts that use axes.
aggregate
(optional, default: false) specifies that the metrics shown on the chart are aggregated. The
aggregation type is defined for each measure with the aggregationType
,
as described in the section called “Common Attributes for measure and indicator
”.
legend
(optional, default: false for quadrants, true for other types of charts) allows specifying if the chart's legend is shown (true) or hidden (false).
displayDate (optional, default: false)
for all charts that display information about several versions. When set to false,
the version name is displayed in the chart. When set to true, the version date is displayed instead.
dateFormat
(optional, default: yyMM) allows formatting the version date when displayDate is set to
true according to the Java Simple Date Format described at
http://docs.oracle.com/javase/6/docs/api/java/text/SimpleDateFormat.html.
Most charts use the measure
and indicator
elements to define
the metrics used in the chart. The attributes allowed for these element are:
label
(optional, default: the measure's name) defines or overrides the label used for the measure. Note that the chart thumbnail will always show the mnemonic no matter what the value of label
is.
color
(optional, default: the project's color, or a random color based on the artefact's name) defines the colour used to represent the measure in the chart.
dataBounds
(since 14-A) (optional, default: "];[") defines the range of values allowed to be displayed on the chart. You can use this attribute to exclude drawing an erroneous or non-representative value on a chart. This attribute is currently supported for the following charts: All Temporal Evolution charts, Quadrant, X/Y-Cloud, Histogram, Y-Cloud, Dial and Meter
[ and ] allow you to specify that a boundary value is included.
] and [ specify that the boundary value itself is excluded.
shape
(since 14-B) (optional, default: CIRCLE) defines the shape used to represent a point on a chart. The allowed values are NONE, SQUARE, CIRCLE, DIAMOND, UP_TRIANGLE, DOWN_TRIANGLE,RIGHT_TRIANGLE, LEFT_TRIANGLE, HORIZONTAL_RECTANGLE, VERTICAL_RECTANGLE, HORIZONTAL_ELLIPSE and VERTICAL_ELLIPSE.
stroke
(since 14-B) (optional, default: SOLID) defines the type of line used join points. The allowed values are NONE, SOLID and DOTTED.
aggregationType
(optional, default: AVG in most charts, SUM in table charts) defines how the values for the
metrics on the chart are aggregated. The supported values are MIN,
MAX, OCC, AVG,
DEV, SUM, MED,
and MOD.
Attributes that are specific to certain charts only are documented in each chart's section.
Datasets are used to apply different rendering settings to different groups of measures in a chart. Each dataset can use its own axis configuration.
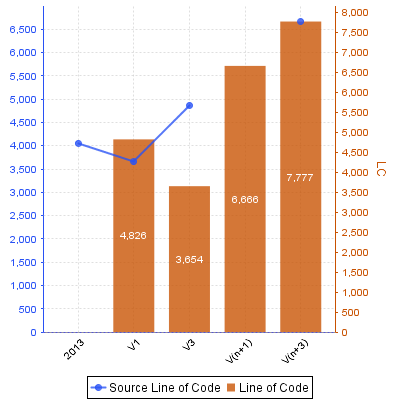
Two metrics styled with two different datasets in the same chart.
<chart type="TE" id="TEMPORAL_EVOLUTION_DOUBLE_AXIS_MISSING_VERSIONS_LINE">
	<dataset renderer="LINE" rangeAxisId="AXIS_1">
		<measure color="40,81,245" alpha="200" label="Source Line of Code">SLOC</measure>
	</dataset>

	<dataset renderer="BAR" rangeAxisId="AXIS_2">
		<measure color="200,81,0" alpha="200" label="Line of Code">LC</measure>
	</dataset>

	<rangeAxis id="AXIS_1" label="SLOC (en KLOC)" color="40,81,245" />
	<rangeAxis id="AXIS_2" label="LC" color="200,81,0" />
</chart>
The dataset
accepts the following attributes:
renderer
(optional, default: differs according to the type of chart): allows specifying the type of rendering. The allowed values are:
LINE to draw a line that joins points on the charts
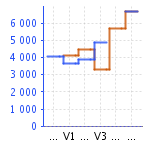
STEP to draw a stepped line between points on the charts
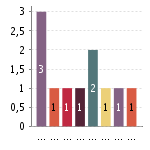
BAR to draw a bar to represent each value
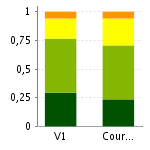
STACKEDBAR to stack bars on top of each other
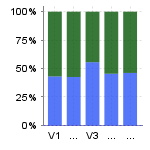
STACKEDBAR100 to stack bars on top of each other as a ratio between 0 and 1. This works best with a numberFormat="PERCENT" for the left axis, as shown here.
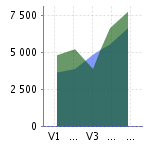
AREA to fill the area below a line
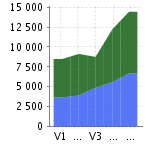
STACKEDAREA to stack areas on top of each other
rangeAxisId
(optional): allows providing a reference to an axis configuration element
Chart axes can be defined using the rangeAxis
element, which accepts the following attributes:
id
(mandatory): The configuration identifier (referred to by a dataset
element)
label
(optional, default: the measure name): The label to be displayed on the axis
min
(optional, defaults to an automatic value) is the minimum boundary for the axis. This attribute can be specified as a value or as a computation (since 15-A).
max
(optional, defaults to an automatic value) is the maximum boundary for the axis. This attribute can be specified as a value or as a computation (since 15-A).
inverted
(optional, default: false): reverses the order of values on the axis when set to true.
location
(optional, default: left for vertical charts, bottom for horizontal charts):
allows defining where around the chart the axis is drawn. Allowed values are: left,
right, bottom and top.
color
(optional, default: automatically assigned): sets the colour used to draw the scale.
type
(optional, default: number): defines how the scale is represented on the axis.
Use number to display the numerical values or scale to plot the axis with the associated scale levels of an indicator.
scaleId
(mandatory if scale is specified): is the id of the indicator to be used
to plot the axis when using type="scale".
numberFormat
(optional, default: usually number): allows customising the number format
when using type="number". The accepted values are as follows:
number to display a number (formatted according to the browser's locale)
percent to display a percentage
integer to display a number with no decimals
pattern to specify a display pattern following Java's DecimalFormat, as described on http://docs.oracle.com/javase/6/docs/api/java/text/DecimalFormat.html
Charts display tooltips that can be customised using properties files for some charts (since 13-A).
If you are not familiar with how Squore uses properties files, refer to the section called “Descriptions” for more details.
The available parameters for the tooltips are:
p0: The value on the y-axis of the chart
p1: The value on the x-axis of the chart
p2: The current value, displayed as specified in the chart definiton (as a percentage or not)
p3: The percentage for the current value in the current bar (for bar charts)
p4: The current value, displayed in its alternate display method (i.e.: a percentage if p2 was specified to be displayed as a regular number, or a regular number if p2 was specified to be displayed as a percentage)
The default tooltip definition looks like this for most charts:
C.<CHART_ID>.TOOLTIP=({0}, {1}) = {2} ({4})The charts that support tooltip customisation and their default tooltip values are as follows:
Simple Bar {2} ({4})
Optimised Bar {2} ({4})
Stacked Bar Chart ({0}, {1}) = {2} ({4})
Temporal Optimised Stacked Bar Chart ({0}, {1}) = {2} ({4})
Simple Temporal Evolution Stacked Bar Chart ({0}, {1}) = {2} ({4})
In order to specify extra parameters for a chart, add a parameters
with an attribute describing what each parameter is, for example:
<chart>
  <parameters p5="MEASURE.SLOC" p6="MEASURE.LC"/>
  (...)
</chart>
You can also override these parameters for each measure on an Optimised Bar chart by redefining each parameter as part of the measure
:
<chart type="OptimizedBar>
  <measure color="0,81,0" label="A" p5="MEASURE.CLOC">A_FILE</measure>
  <measure color="3,127,3" label="B" p5="INDICATOR.LEVEL">B_FILE</measure>
</chart>
In both cases, your tooltip definition can be for example:
C.<CHART_ID>.TOOLTIP=({0}, {1}) = {2} ({4}) - with my extra param={5}When working with charts that support displaying a timeline (Temporal Evolution Line Chart and Temporal Evolution Bar Chart charts
with an attribute byTime="true"
), the x-axis can be customised to display the level
of details that suits you best. The following attributes can be used (since 14-A):
timeInterval
(optional, default: MILLISECOND) displays only the last value available for the time period selected. This allows you to display a result trend for the past year where only the last of every month is drawn on the chart (onlyLast="12" timeInterval="MONTH"). The values allowed for this attribute are MILLISECOND, SECOND, MINUTE, HOUR, DAY, WEEK, MONTH, QUARTER and YEAR. Note that for Temporal Evolution Bar Chart charts, this setting defines the width of the bar.
timeAxisByPeriod
(optional, default: false) allows labelling the x-axis with periods of time (true) instead of actual dates (false). The minor and major labels displayed are specified by the timePeriodMinorTick
and timePeriodMajorTick
attributes below.
timePeriodMinorTick
(optional, default: auto) defines the interval at which minor ticks are drawn on the chart. The values allowed are the same as for the timeInterval
attribute.
timePeriodMajorTick
(optional, default: auto) defines the interval at which major ticks are drawn on the chart. The values allowed are the same as for the timeInterval
attribute.
By default, the date used for each version is the actual date of when the analysis was run. However, you can override this date and specify the real date of an analysis in the UI using the Version Date field, or via the command line using the versionDate parameter. Refer to the Command Line Interface and the Online Help for more details.
You can display future or past versions on a chart using the forecast
element on a measure, as shown below.
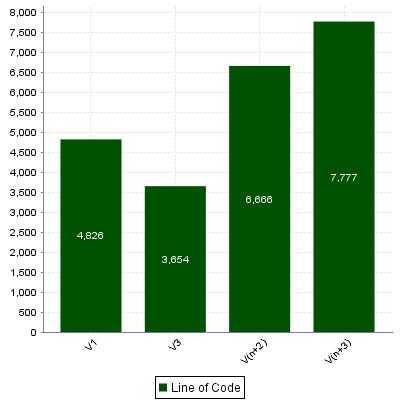
Planned (future) versions on a Temporal Evolution Bar Chart chart
<chart type="TemporalEvolutionBar"
		id="TEMPORAL_EVOLUTION_BAR_FORECAST_ID">
	<measure color="0,81,0" label="Line of Code">LC
		<forecast>
			<version value="SLOC" timeValue="DATE(2014,10,31)" label="V3" />
			<version value="6666" timeValue="DATE(2014,11,30)" />
			<version value="3333+4444" timeValue="DATE(2014,12,31)" />
		</forecast>
	</measure>
</chart>
The forecast
element supports one or more
version
elements with the following attributes:
value
(mandatory) is a computation valid for the current artefact type (same limitation as for displayOnlyIf
).
timeValue
(mandatory) is a computation valid for the current artefact type that is used to position the version on a time axis. The result has to be a number of milliseconds since January 1st 1970.
label
(optional, default: V(n+x)) is the label used to represent the
version on the chart.
Displaying 6 future versions can be done with the following example:
<measure color="170,70,67" label="Objective" dataBounds="]-1;[">OBJECTIVE
	<forecast>
		<version value="OBJECTIVE_VNP1" timeValue="DATE_VNP1" />
		<version value="OBJECTIVE_VNP2" timeValue="DATE_VNP2" />
		<version value="OBJECTIVE_VNP3" timeValue="DATE_VNP3" />
		<version value="OBJECTIVE_VNP4" timeValue="DATE_VNP4" />
		<version value="OBJECTIVE_VNP5" timeValue="DATE_VNP5" />
	</forecast>
</measure>
If the measures used for timeValue are updated for each analysis, you can create a rolling chart. If the timeValues are fixed, then the future versions will always be the same.
If you want to use fixed planned versions (January to December for example), you can use the dataBounds
attribute's value to prevent a specific version from being displayed:
<version value="IF(TODAY()>DATE_VNP1,-1,OBJECTIVE_VNP1)" timeValue="DATE_VNP1" />
Charts that include axes also allow the use of markers. Markers are coloured regions of the chart area that help put the displayed value into context. For example, you could display a line chart of the evolution of the main indicator for your project and use markers to visually associate the value of the indicator with its level, as shown below:
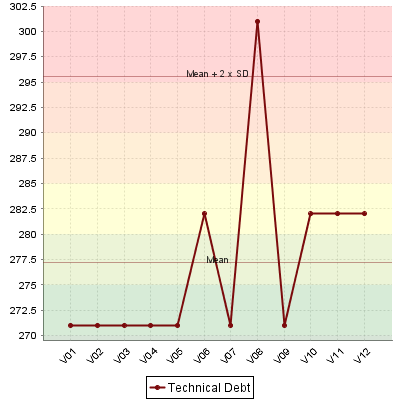
The evolution of an indicator within the levels of its associated scale, using markers to represent the different scale levels
<chart type="TemporalEvolutionLine"
		id="TEMPORAL_EVOLUTION_LINE_ID">
    <measure color="123,10,12" label="Technical Debt">ROOT</measure>
    <markers>
        <marker fromScale="SCALE_TEST" isVertical="false" />
    </markers>
</chart>
Simpler markers can be drawn as vertical or horizontal lines, as shown below:
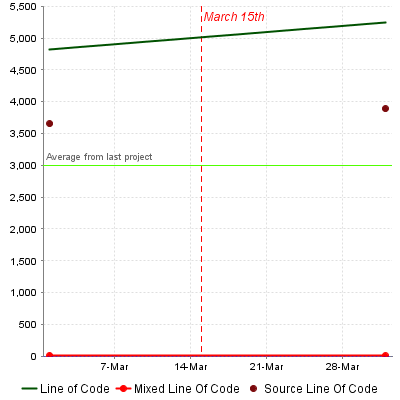
The evolution of an indicator within the levels of its associated scale, using markers to represent the different scale levels
<chart type="TE"
  id="TE_LINE_MARKER_LINE"
  byTime="true">
    <measure color="0,81,0" label="Line of Code" shape="NONE">LC</measure>
    <measure color="255,0,0" label="Mixed Line Of Code">MLOC</measure>
    <measure color="123,10,12" label="Source Line Of Code" stroke="NONE">SLOC</measure>
    <markers>
        <marker value="3000" color="80,255,0" isVertical="false"
            label="Average from last project"
            isInterval="false" labelAnchor="TOP_LEFT" labelTextAnchor="BOTTOM_LEFT"
            labelColor="#666666" />
        <marker value="DATE(2014,03,15)" color="#ff0000" isVertical="true"
        label="March 15th" isInterval="false" labelAnchor="TOP_RIGHT" labelTextAnchor="TOP_LEFT"
        labelColor="#ff0000" stroke="DOTTED" labelFontSize="12" labelFontStyle="ITALIC" />
    </markers>
</chart>
There are three ways to include markers on a chart:
By using a scale name to apply colouring to the entire background for all available scale levels. See the fromScale
attribute below.
By using an indicator name to apply colouring to the entire background for all available scale levels associated to the indicator. See the fromIndicator
attribute below.
By manually specifying the start and end values on the axes, and the colour of the marker you want. See the value
, endValue
and color
attributes below.
The marker
element has the following attributes:
fromScale
(optional, cannot be combined with fromIndicator
or value/endValue
) sets the scale to use to create a markers for each scale level using the
colour defined in the scale's properties.
fromIndicator
(optional, cannot be combined with fromScale
or value/endValue
) sets the indicator to use to retrieve a scale and create a markers for each scale level using the
colour defined in the scale's properties.
value
(optional, default: -infinity, cannot be combined with fromIndicator
or fromScale
) sets the position on the axis to start drawing the marker from. You can specify an exact value, a percentage, or a compuration (since 15-A) for this parameter.
endValue
(optional, default: infinity, cannot be combined with fromIndicator
or fromScale
) sets the position on the axis to stop drawing the marker. You can specify an exact value, a percentage, or a compuration (since 15-A) for this parameter.
isInterval
(optional, default: true, cannot be combined with fromIndicator
or
fromScale
) allows defining whether a marker covers an interval (true) or is simply a
line on the chart (false). When set to false, endValue
is ignored, and
the following extra parameters are available:
color
(optional, default: grey, not compatible with fromIndicator
or fromScale
) is the RGB colour code used to fill the marker region.
alpha
(optional, default: 50) sets the opacity level (0 is transparent, 255 is fully
opaque).
isVertical
(optional, default: false)
specifies if the marker should be vertical (true) or horizontal
(false).
label
(optional, default: none) allows specifying a label for the marker.
labelColor
(optional, default: black) allows specifying the color of the label text.
You can specify the colour in hexadecimal ("#ff0000"), text ("red") or RGB ("255,0,0").
labelFontSize="[int]"
(optional, default: 9) defines the size of the label text.
labelFontStyle="PLAIN|BOLD|ITALIC|BOLD_ITALIC"
(optional, default: PLAIN) defines the style
of the label text.
labelAnchor
(optional, default: TOP_RIGHT if vertical, TOP_LEFT if horizontal)
defines the position of the label relative to the marker. The possible values are:
BOTTOM
BOTTOM_LEFT
BOTTOM_RIGHT
CENTER
LEFT
RIGHT
TOP
TOP_LEFT
TOP_RIGHT
labelTextAnchor
(optional, default: TOP_LEFT if vertical, BOTTOM_LEFT if horizontal)
defines the position of the text relative to the label. The possible values are:
BASELINE_CENTER
BASELINE_LEFT
BASELINE_RIGHT
BOTTOM_CENTER
BOTTOM_LEFT
BOTTOM_RIGHT
CENTER
CENTER_LEFT
CENTER_RIGHT
HALF_ASCENT_CENTER
HALF_ASCENT_LEFT
HALF_ASCENT_RIGHT
TOP_CENTER
TOP_LEFT
TOP_RIGHT
Some charts (Simple Pie and Simple Bar) support dynamically grouping target artefacts according to textual information
in a measure. In order to use this information, you do not use an indicator
or
measure
element but an info
element with the measure holding the
text information.
Here is a sample definition for a Simple Bar chart where each bar is labelled according to the textual information
held in the ASSIGNEE metric.
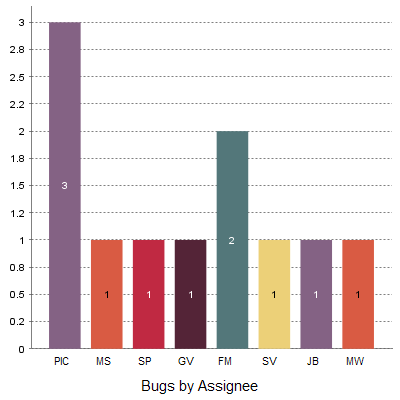
A Simple Bar chart using textual information from ISSUE child artefacts to dynamically display its bars.
<chart 	type="SimpleBar"
	id="ASSIGNEE_DISTRIBUTION"
	width="400"
	height="400"
	targetArtefactTypes="ISSUES"
	decimals="0">
	<info>ASSIGNEE</info>
</chart>
The Optimised Pie chart is a pie chart that takes several measure as input. It simply displays a pie chart with the values previously computed.
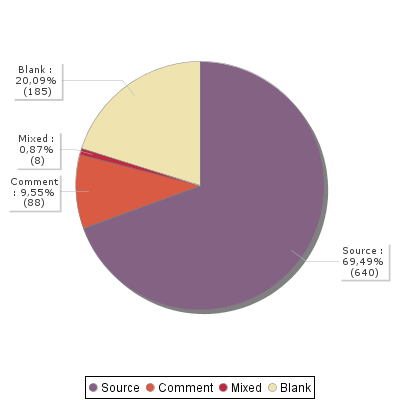
Optimised Pie Chart
<chart type="OptimizedPie"
		id="OPTIMIZED_PIE_ID"
		decimals="2">
   <measure label="Source">SLOC_ONLY</measure>
   <measure label="Comment">CLOC_ONLY</measure>
   <measure label="Mixed">MLOC</measure>
   <measure color="239,228,176" label="Blank">BLAN</measure>
</chart>
The Optimised Pie uses the
decimals
attribute to decide how many decimal places to display in the labels and a minimum of two measure
elements.
The Optimised Bar chart is a bar chart that takes several measure as input. It simply displays a bar chart with the values previously computed.
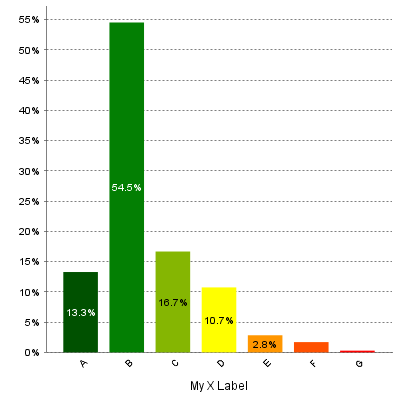
Optimised Bar Chart
<chart type="OptimizedBar"
		id="OPTIMIZED_BAR_ID"
		asPercentage="true">
          <measure color="0,81,0" label="A">A_FILE</measure>
          <measure color="3,127,3" label="B">B_FILE</measure>
          <measure color="133,182,2" label="C">C_FILE</measure>
          <measure color="255,255,0" label="D">D_FILE</measure>
          <measure color="255,150,0" label="E">E_FILE</measure>
          <measure color="255,80,0" label="F">F_FILE</measure>
          <measure color="255,0,0" label="G">G_FILE</measure>
</chart>
The Optimised Bar uses the
decimals
attribute to decide how many decimal places to display in the labels and the
asPercentage
to specify whether the values are displayed as real values or percentages.
It requires a minimum of two measure
elements.
This special chart is used to represent the level of the selected artefact in reference to an indicator.
Key Performance Indicator
The following is an example of the syntax used for defining a KPI chart:
<chart type="KPI" id="KEY_PERFORMANCE_INDICATOR"
indicatorId="MAINTAINABILITY" />
The following attributes are allowed for
the KPI
chart
tag:
indicatorId
is the reference to an
Indicator. See
the section called “Descriptions”
for more information about the
indicatorId
.
The Dial chart represents the value of the measure associated
to an indicator against a backdrop of the scale associated to this indicator. The Dial chart requires one
indicator
as a sub-element.
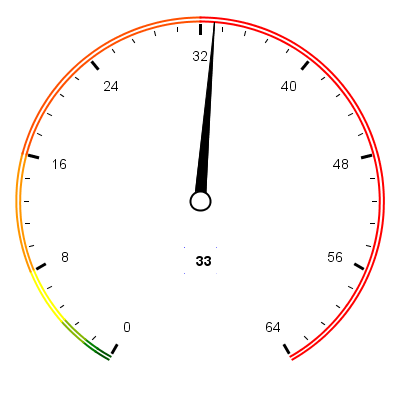
Dial Chart
<chart type="Dial" id="DIAL_LINEAR_ID"
				decimals="0"
				majorTickIncrement="8"
				minorTickCount="4">
  <indicator>VALUE_LINEAR</indicator>
</chart>
The Dial
chart
element may have the following attributes:
The majorTickIncrement
and minorTickCount
parameters only need to
be used if you want to completely control the appearance of the chart. Generally,
they can be omitted, as the defaults should be smart enough to show what you need.
You can control the bounds of the axis of this chart using the datBounds attributs on each metric,
as explained in the section called “Common Attributes for measure and indicator
”.
The indicator
element supports excluding
certain levels from the chart by using the
excludeLevels
attribute. For
example:
<indicator excludeLevels="LEVELA;LEVELB">LEVEL</indicator>
The Meter chart represents the value of the measure associated to an indicator against a backdrop of the scale associated to this indicator.
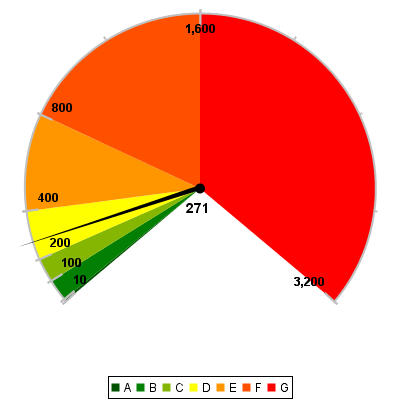
Meter Chart
<chart type="Meter" id="METER_ID"
				decimals="0"
				majorTickIncrement="400">
  <indicator>VALUE_LINEAR</indicator>
</chart>
The Meter
chart
element may have the following attributes:
The Meter chart takes only one
indicator
as a sub-element.
You can control the bounds of the axis of this chart using the datBounds attributs on each metric,
as explained in the section called “Common Attributes for measure and indicator
”.
The indicator
element supports excluding
certain levels from the chart by using the
excludeLevels
attribute. For
example:
<indicator excludeLevels="LEVELA;LEVELB">LEVEL</indicator>
The Kiviat chart displays three or more indicators in a radar-type chart.
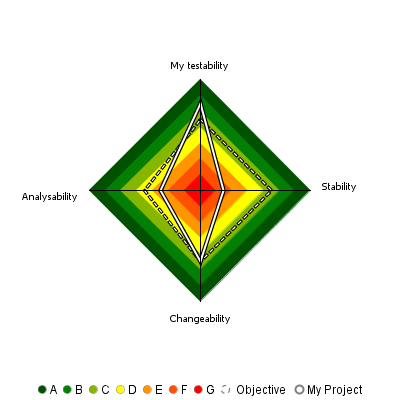
Kiviat Chart
The Kiviat chart takes a set of at least three indicators as sub-elements.
<chart type="Kiviat"
		id="KIVIAT_ID"
		isInverted="true">
	<indicator label="My testability"
	              objective="LEVELC">TESTABILITY</indicator>
	<indicator objective="LEVELC">STABILITY</indicator>
	<indicator objective="LEVELC">CHANGEABILITY</indicator>
	<indicator objective="LEVELD">ANALYSABILITY</indicator>
</chart>
The attributes allowed for the
chart
element are
the following:
The indicator
element accepts a specific, optional objective
attribute
that draws a dotted line at the specified level representing the objective line.
The objective attribute accepts:
A scale level (LEVELA)
An indicator ID (since 14-B) (TESTABILITY). In this case, both indicators must use the same scale.
A computation (since 14-B) (LC+100). The computed value is then used together with the scale of the indicator to define the level to display.
Note that only a scale level is accepted for Kiviat charts at analysis model level.
This chart represents the SQALE Pyramid, representing a minimum of two different measures or indicators as a matrix.
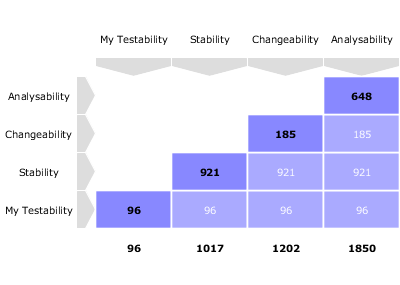
SQALE Pyramid Chart
<chart type="SQALEPyramid" id="MAINTAINABILITY_PYRAMID" decimals="0">
  <measure label="My Testability" >TESTABILITY</measure>
  <measure>STABILITY</measure>
  <measure>CHANGEABILITY</measure>
  <measure>ANALYSABILITY</measure>
</chart>
A typical Histogram that shows the repartition of a value for
the children
of the selected artefact It requires one measure
element.
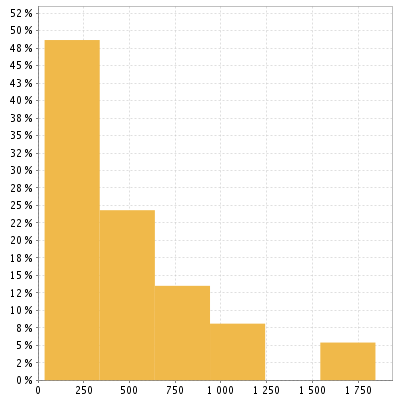
Histogram Chart
<chart type="Histogram" id="HISTOGRAM_ID" targetArtefactTypes="FILE"
  nbBars="10" >
  <measure color="242,205,57" >SUMLC</measure>
</chart>
The
chart
element may have the following attributes:
targetArtefactTypes
allows to filter descendants according to their type. You can use one or more types (since 14-A).
Concrete and abstract types are supported, so it is possible to use an alias, as described in the section called “Artefact Types”.
There are some limitations to what is supported:
Measures associated to an indicator must have the same measureId for all types and be of the same kind (base or derived)
For Stacked Bar Chart, Simple Temporal Evolution Stacked Bar Chart, Simple Pie and Simple Bar the scale associated to the indicator must be the same for be the same for all types
You can control the bounds of the axis of this chart using the datBounds attributs on each metric,
as explained in the section called “Common Attributes for measure and indicator
”.
The Y-Cloud chart is a visual representation of the values of a measure or indicator for the
children of the selected artefact. For each child of the requested type, a dot is drawn with the
value found for the selected measure. The chart requires one indicator
element.
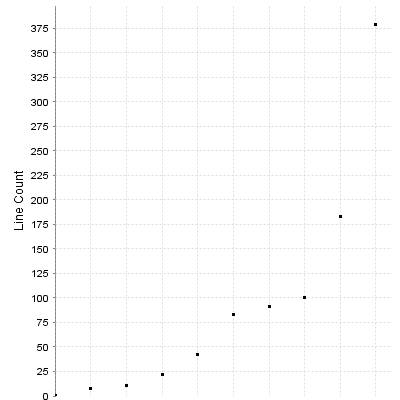
Y-Cloud Chart
<chart type="YCloud" id="CLOUD_ID"
  targetArtefactTypes="FILE">
  <indicator color="0,0,0" label="LC">LC</indicator>
</chart>
The
chart
element may have the following attributes:
targetArtefactTypes
allows to filter descendants according to their type. You can use one or more types (since 14-A).
Concrete and abstract types are supported, so it is possible to use an alias, as described in the section called “Artefact Types”.
There are some limitations to what is supported:
Measures associated to an indicator must have the same measureId for all types and be of the same kind (base or derived)
For Stacked Bar Chart, Simple Temporal Evolution Stacked Bar Chart, Simple Pie and Simple Bar the scale associated to the indicator must be the same for be the same for all types
The Treemap offers a graphical representation of child artefacts as
a set of tiled rectangles.
The Treemap requires one measure
to
define the size of the tiles and accepts a colorFromIndicator
attribute to pick the colors of the tiles. Clicking a tile takes you to the dashboard
of the corresponding artefact.
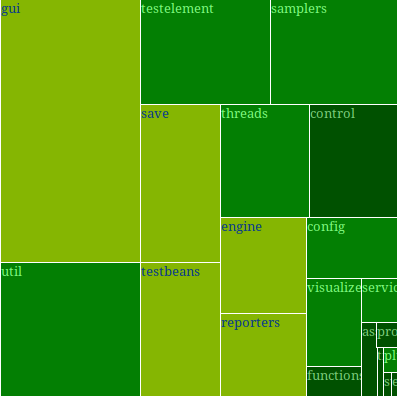
Treemap
<chart id="TREEMAP" type="TreeMap"
  colorFromIndicator="MAINTAINABILITY"
  onlyDirectChildren="false" targetArtefactTypes="FOLDER">
  <measure>SUMLC</measure>
</chart>
The chart
tag accepts the following attributes:
targetArtefactTypes
allows to filter descendants according to their type. You can use one or more types (since 14-A).
Concrete and abstract types are supported, so it is possible to use an alias, as described in the section called “Artefact Types”.
There are some limitations to what is supported:
Measures associated to an indicator must have the same measureId for all types and be of the same kind (base or derived)
For Stacked Bar Chart, Simple Temporal Evolution Stacked Bar Chart, Simple Pie and Simple Bar the scale associated to the indicator must be the same for be the same for all types
onlyDirectChildren
(optional, default: true) includes artefacts that are direct children of the current artefact
in the chart when set to true, or all descendants of the current artefact when set to false.
colorFromIndicator
(optional) uses an indicator's colour scale to assign a colour to each drawn tile.
defaultColor
(optional, default:RANDOM colour based on artefact name) uses an indicator's colour scale to assign a colour to each drawn tile.
The Artefact Pie offers a graphical representation of the values of a specific measure
for each child artefact in a pie chart.
The Artefact Pie requires one measure
to
define the size of the pie slice and accepts a colorFromIndicator
attribute to pick the colors of the pie slices based on a scale. Clicking a pie slice
takes you to the dashboard of the corresponding artefact.
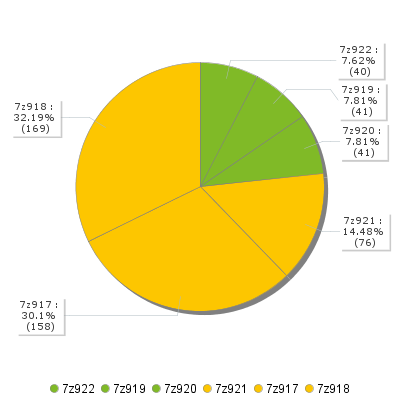
Artefact Pie
<chart id="ARTEFACT_PIE_FILE_DESCENDANTS" type="ArtefactPie"
  colorFromIndicator="MAINTAINABILITY"
  onlyDirectChildren="false" targetArtefactTypes="FILE">
  <measure>SUMLC</measure>
</chart>
The chart
tag accepts the following attributes:
targetArtefactTypes
allows to filter descendants according to their type. You can use one or more types (since 14-A).
Concrete and abstract types are supported, so it is possible to use an alias, as described in the section called “Artefact Types”.
There are some limitations to what is supported:
Measures associated to an indicator must have the same measureId for all types and be of the same kind (base or derived)
For Stacked Bar Chart, Simple Temporal Evolution Stacked Bar Chart, Simple Pie and Simple Bar the scale associated to the indicator must be the same for be the same for all types
onlyDirectChildren
(optional, default: true) includes artefacts that are direct children of the current artefact
in the chart when set to true, or all descendants of the current artefact when set to false.
colorFromIndicator
(optional) uses an indicator's colour scale to assign a colour to each drawn pie slice.
The X/Y-Cloud chart is a visual representation of the values of two measures or indicators for the children of the selected artefact. For each child of the requested type, a dot is drawn with the value found for the selected measure.
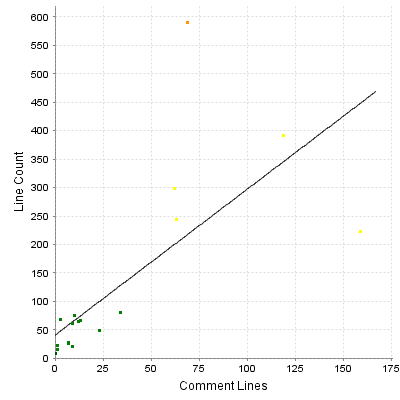
X/Y-Cloud Chart
<chart type="XYCloud" id="XYCLOUD_ID"
  targetArtefactTypes="FILE" colorFromIndicator="COMPLEXITY"
  showPolynomialRegression="true" coeff="1">
  <xmeasure label="Comment Lines">CLOC</xmeasure>
  <ymeasure label="Line Count">LC</ymeasure>
</chart>
The
chart
element may have the following attributes:
targetArtefactTypes
allows to filter descendants according to their type. You can use one or more types (since 14-A).
Concrete and abstract types are supported, so it is possible to use an alias, as described in the section called “Artefact Types”.
There are some limitations to what is supported:
Measures associated to an indicator must have the same measureId for all types and be of the same kind (base or derived)
For Stacked Bar Chart, Simple Temporal Evolution Stacked Bar Chart, Simple Pie and Simple Bar the scale associated to the indicator must be the same for be the same for all types
showPolynomialRegression (optional, default: true) (since 14-A)
Whether the polynomial regression is drawn (true) or not drawn (false) on the chart.
coeff
the degree of the drawn polynomial. Supported values are 1 (linear), 2 (quadratic) and 3 (cubic).
colorFromIndicator (optional)
sets the colour of the dot to the colour of the level of the specified indicator (since 13-B).
The chart takes one xmeasure
element
and one ymeasure
with the following attributes.
The Quadrant chart displays information about the descendants of the current artefact. Three measures are required to construct the chart: one for the X-axis, one for the Y-axis one for the size of the bubbles. The chart also allows to set markers to define coloured areas.
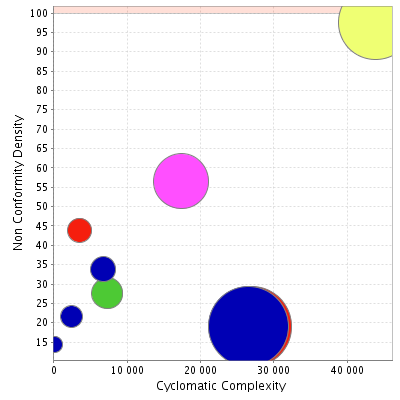
Quadrant Chart
<chart type="quadrant"
 id="NON_CONFORMITY_DENSITY_VS_COMPLEXITY"
 targetArtefactTypes="FILE"
 xMin="0" xMax="50000"
 yMin="0" yMax="100"
 onlyDirectChildren="false" >
  <xmeasure color=>SUMVG</xmeasure>
  <ymeasure>NCD</ymeasure>
 <zmeasure>FUNC</zmeasure>
  <markers>
    <marker value="100" color="255,50,0"
     alpha="50" isVertical="false" />
    <marker value="100" color="255,50,0"
     alpha="50" isVertical="true" />
  </markers>
</chart>
The
chart
element may have the following attributes:
targetArtefactTypes
allows to filter descendants according to their type. You can use one or more types (since 14-A).
Concrete and abstract types are supported, so it is possible to use an alias, as described in the section called “Artefact Types”.
There are some limitations to what is supported:
Measures associated to an indicator must have the same measureId for all types and be of the same kind (base or derived)
For Stacked Bar Chart, Simple Temporal Evolution Stacked Bar Chart, Simple Pie and Simple Bar the scale associated to the indicator must be the same for be the same for all types
onlyDirectChildren
(optional, default: true) includes artefacts that are direct children of the current artefact
in the chart when set to true, or all descendants of the current artefact when set to false.
colorFromIndicator (optional)
sets the colour of the bubble to the colour of the level of the specified indicator (since 13-B).
The Simple Pie chart presents the aggregation of the different ratings found in all the children of the selected artefact.
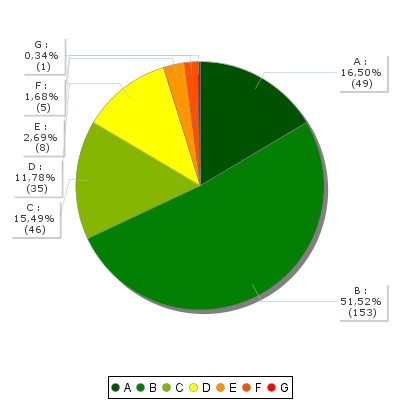
Simple Pie Chart
<chart type="SimplePie" id="SIMPLE_PIE_ID"
  targetArtefactTypes="FILE" decimals="2">
  <indicator>LEVEL</indicator>
</chart>
The Simple Pie
chart
element may have the following attributes:
targetArtefactTypes
allows to filter descendants according to their type. You can use one or more types (since 14-A).
Concrete and abstract types are supported, so it is possible to use an alias, as described in the section called “Artefact Types”.
There are some limitations to what is supported:
Measures associated to an indicator must have the same measureId for all types and be of the same kind (base or derived)
For Stacked Bar Chart, Simple Temporal Evolution Stacked Bar Chart, Simple Pie and Simple Bar the scale associated to the indicator must be the same for be the same for all types
decimals
is the number of decimal places used to display the data.
The Simple Pie chart takes only one
indicator
or info
as a sub-element.
For more details about how to use textual information, refer to the section called “Using Textual Information From Artefacts”
The indicator
element supports excluding
certain levels from the chart by using the
excludeLevels
attribute. For
example:
<indicator excludeLevels="LEVELA;LEVELB">LEVEL</indicator>
Note: This chart is equivalent to using an Optimised Pie Chart with the definition shown below. The pie chart is optimised because the measures it uses have already been computed during the analysis and do not need to be calculated on the fly.
<chart type="OptimizedPie" decimals="2" >
	<measure color="0,81,0" label="A">A_FILE</measure>
	<measure color="3,127,3" label="B">B_FILE</measure>
	<measure color="133,182,2" label="C">C_FILE</measure>
	<measure color="255,255,0" label="D">D_FILE</measure>
	<measure color="255,150,0" label="E">E_FILE</measure>
	<measure color="255,80,0" label="F">F_FILE</measure>
	<measure color="255,0,0" label="G">G_FILE</measure>
</chart>
The Simple Bar chart presents the aggregation of the different ratings found in all the children of the selected artefact as a histogram.
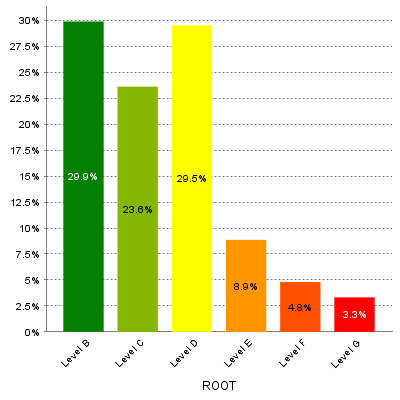
Simple Bar Chart
<chart type="SimpleBar" id="SIMPLE_BAR_ID"
  targetArtefactTypes="FILE" decimals="2">
  <indicator>LEVEL</indicator>
</chart>
The Simple Bar
chart
element may have the following attributes:
targetArtefactTypes
allows to filter descendants according to their type. You can use one or more types (since 14-A).
Concrete and abstract types are supported, so it is possible to use an alias, as described in the section called “Artefact Types”.
There are some limitations to what is supported:
Measures associated to an indicator must have the same measureId for all types and be of the same kind (base or derived)
For Stacked Bar Chart, Simple Temporal Evolution Stacked Bar Chart, Simple Pie and Simple Bar the scale associated to the indicator must be the same for be the same for all types
decimals
is the number of decimal places used to display the data.
asPercentage
(default: false) displays the values as percentages when set to true.
The Simple Bar chart takes only one
indicator
or info
as a sub-element.
For more details about how to use textual information, refer to the section called “Using Textual Information From Artefacts”
The indicator
element supports hiding or excluding
certain levels from the chart by using the hideLevels
excludeLevels
attribute. The difference between
hiding and excluding a level is that hidden levels are taken into account when displaying percentages while
excluded levels are not. For example:
<indicator excludeLevels="UNKNOWN">LEVEL</indicator>
or
<indicator hideLevels="LEVELA;LEVELB">LEVEL</indicator>
The Stacked Bar crosses the performance levels of two indicators for the children of the selected artefact along two axes.
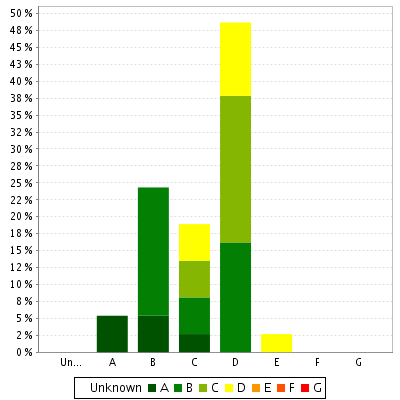
Stacked Bar chart
<chart type="StackedBar" id="STACKED_BAR_ID"
  targetArtefactTypes="FILE" >
  <indicator>TESTABILITY</indicator>
  <indicator>ANALISABILITY</indicator>
</chart>
The
chart
element may have the following attributes:
targetArtefactTypes
allows to filter descendants according to their type. You can use one or more types (since 14-A).
Concrete and abstract types are supported, so it is possible to use an alias, as described in the section called “Artefact Types”.
There are some limitations to what is supported:
Measures associated to an indicator must have the same measureId for all types and be of the same kind (base or derived)
For Stacked Bar Chart, Simple Temporal Evolution Stacked Bar Chart, Simple Pie and Simple Bar the scale associated to the indicator must be the same for be the same for all types
asPercentage
(default: false) displays the values as percentages when set to true.
The chart support two indicator
elements.
The indicator
element supports hiding or excluding
certain levels from the chart by using the hideLevels
excludeLevels
attribute. The difference between
hiding and excluding a level is that hidden levels are taken into account when displaying percentages while
excluded levels are not. For example:
<indicator excludeLevels="UNKNOWN">LEVEL</indicator>
or
<indicator hideLevels="LEVELA;LEVELB">LEVEL</indicator>
The Temporal Evolution Chart shows the evolution of one or measures over time. The measure representation is defined
by a renderer
attribute (as explained in the section called “Datasets” for more details). It replaces the deprecated Temporal Evolution Bar Chart
and the Temporal Evolution Line Chart, and allows representing more than one data sets on the one chart.
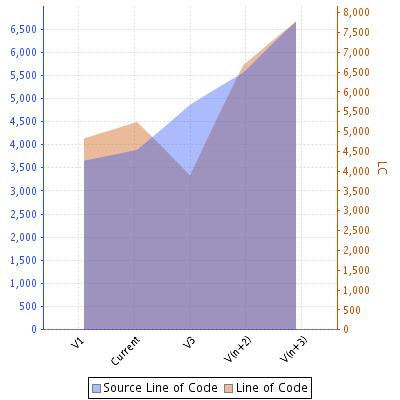
Temporal Evolution Chart using an AREA renderer
<chart type="TemporalEvolution"
		id="TEMPORAL_EVOLUTION_AREA"
		width="400"
		height="400"
		onlyLast="5"
		renderer="AREA">
	<measure color="40,81,245" label="Source Line of Code">SLOC</measure>
	<measure color="0,81,0" label="Line of Code">LC</measure>
</chart>
The Temporal Evolution Chart can also be used to draw a bar chart or a line chart, as shown below:
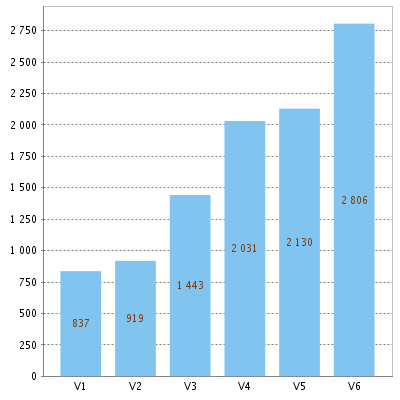
Temporal Evolution Chart using a BAR renderer
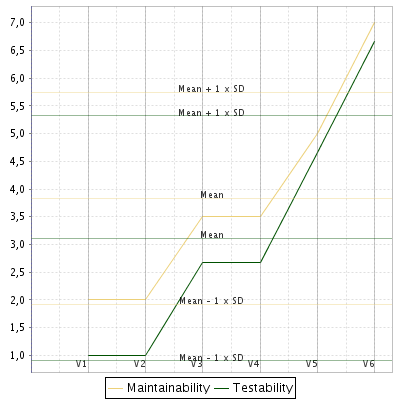
Temporal Evolution Chart using a LINE renderer
The chart above is a normal Temporal Evolution Chart chart where the x-axis uses a regular gap between all versions and uses the version name as the label.
Below is an example of the difference in representation when using the x-axis as a chronological marker.
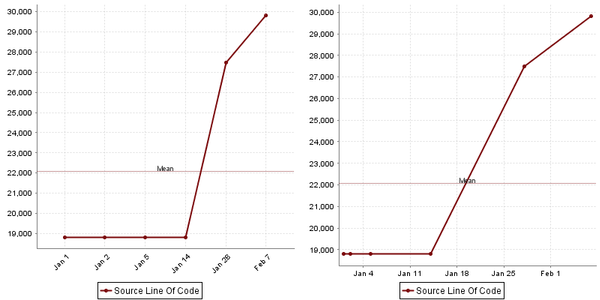
Temporal Evolution Chart with versions distributed evenly on the x-axis, using the version name as the label (left),
or distributed on the x-axis according to the date at which the analysis was carried out.
Labels on the x-axis do to not correspond to the version name this time. (right).
The
chart
element may have the following attributes:
isCChart (optional, default: false)
transforms the chart in a C-Chart if set to true. This draws three extra lines to the chart at the following values on the y-axis:
mean
mean + (coefficient * standard deviation)
mean - (coefficient * standard deviation)
coeff (optional, default: 0)
sets the value of the coefficient used to draw the control lines either side of the mean line when
isCChart
is set to true.
onlyLast
defines the number of versions to be displayed, starting from the
one that is currently selected.
byTime (optional, default: false)
defines whether versions are placed on the x-axis according to their analysis date. When activating this mode,
you can use the advanced options for the x-axis defined in the section called “Time Axis Configuration”.
breakOnMissingData (optional, default: false)
specifies whether the line is interrupted (true) when a value is missing.
timeMeasure="DATE_MEASURE_ID"
(optional) is the measure (of type DATE) to use as the analysis date for a chart where byTime is true. If not
specified, the real analysis date of the version is used.
dateFormat="..." (default: "yyyy/MM/dd")
(optional) allows formatting the version date when displayDate is set to
true according to the Java Simple Date Format described at
http://docs.oracle.com/javase/6/docs/api/java/text/SimpleDateFormat.html.
dateStyle (optional, default: DEFAULT): the date formatting style,
used when the displayType is one of DATE or DATETIME.
timeStyle (optional, default: DEFAULT): the time formatting style,
used when the displayType is one of DATETIME or TIME. See above for available styles.The Temporal Evolution Bar Chart shows a set of bars representing the evolution of a measure over time.
Temporal Evolution Bar Chart
<chart type="TemporalEvolutionBar" id="TEMPORAL_EVOLUTION_BAR_ID" >
<measure color="0,81,0" label="Technical Debt">TECH_DEBT</measure>
  </chart>
A chart that shows the evolution of one or several measures over time. The x-axis can optionally represent the time interval between the creation of two versions (since 13-B).
Temporal Evolution Line Chart
<chart type="TemporalEvolutionLine" id="TEMPORAL_EVOLUTION_LINE_ID"
  isCChart="true" coeff="2" onlyLast="20">
  <measure label="Maintainability">MAINTAINABILITY</measure>
  <measure color="0,81,0">TESTABILITY</measure>
</chart>
The chart above is a normal Temporal Evolution Line Chart chart where the x-axis uses a regular gap between all versions and uses the version name as the label.
Below is an example of the difference in representation when using the x-axis as a chronological marker.
Temporal Evolution Line Chart with versions distributed evenly on the x-axis, using the version name as the label (left),
or distributed on the x-axis according to the date at which the analysis was carried out.
Labels on the x-axis do to not correspond to the version name this time. (right).
<chart type="TemporalEvolutionLine" id="TEMPORAL_EVOLUTION_LINE_ID"
   dateFormat="MMM d" byTime="true"
  isCChart="true" coeff="2" onlyLast="20">
  <measure color="123,10,12" label="Source Line Of Code">SLOC</measure>
</chart>
The
chart
element may have the following attributes:
isCChart (optional, default: false)
transforms the chart in a C-Chart if set to true. This draws three extra lines to the chart at the following values on the y-axis:
mean
mean + (coefficient * standard deviation)
mean - (coefficient * standard deviation)
coeff (optional, default: 0)
sets the value of the coefficient used to draw the control lines either side of the mean line when
isCChart
is set to true.
onlyLast
defines the number of versions to be displayed, starting from the
one that is currently selected.
byTime (optional, default: false)
defines whether versions are placed on the x-axis according to their analysis date. When activating this mode,
you can use the advanced options for the x-axis defined in the section called “Time Axis Configuration”.
breakOnMissingData (optional, default: false)
specifies whether the line is interrupted (true) when a value is missing.
timeMeasure="DATE_MEASURE_ID"
(optional) is the measure (of type DATE) to use as the analysis date for a chart where byTime is true. If not
specified, the real analysis date of the version is used.
dateFormat="..." (default: "yyyy/MM/dd")
(optional) allows formatting the version date when displayDate is set to
true according to the Java Simple Date Format described at
http://docs.oracle.com/javase/6/docs/api/java/text/SimpleDateFormat.html.
dateStyle (optional, default: DEFAULT): the date formatting style,
used when the displayType is one of DATE or DATETIME.
timeStyle (optional, default: DEFAULT): the time formatting style,
used when the displayType is one of DATETIME or TIME. See above for available styles.This chart represents the evolution of several measures across several versions. It takes a a minimum of two measures as elements. The labels on the bars can be displayed as values or a percentage, as shown below:

Temporal Optimised Stacked Bar Chart

Temporal Optimised Stacked Bar Chart using percentages
<chart type="OptimizedTemporalEvolutionStackedBar"
			id="OptimizedTemporalEvolutionStackedBar_BAR_ID"
  targetArtefactTypes="FILE" asPercentage="false">
	<measure color="0,81,0" label="A">A_FILE</measure>
	<measure color="3,127,3" label="B">B_FILE</measure>
	<measure color="133,182,2" label="C">C_FILE</measure>
	<measure color="255,255,0" label="D">D_FILE</measure>
	<measure color="255,150,0" label="E">E_FILE</measure>
	<measure color="255,80,0" label="F">F_FILE</measure>
	<measure color="255,0,0" label="G">G_FILE</measure>
</chart>
The
chart
element may have the following attributes:
targetArtefactTypes
allows to filter descendants according to their type. You can use one or more types (since 14-A).
Concrete and abstract types are supported, so it is possible to use an alias, as described in the section called “Artefact Types”.
There are some limitations to what is supported:
Measures associated to an indicator must have the same measureId for all types and be of the same kind (base or derived)
For Stacked Bar Chart, Simple Temporal Evolution Stacked Bar Chart, Simple Pie and Simple Bar the scale associated to the indicator must be the same for be the same for all types
asPercentage
(default: false) displays the values as percentages when set to true.
A chart that shows the evolution of one or more measures over time including an objective i.e. the different versions analysed by the Squore engine.
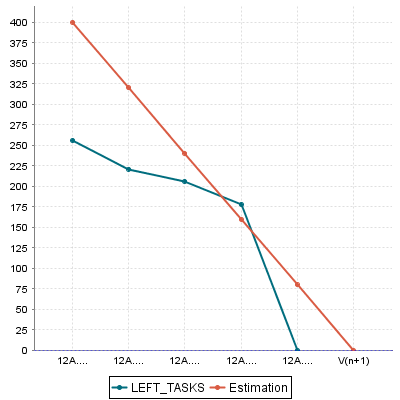
Temporal Evolution Line Chart Including Goal
<chart type="TELIGoal" id="TELIGOAL_ID"
  versionStart="V2" direction="down">
  <target defaultValue="500" version="start" >INIT_TASKS</target>
  <nbStep defaultValue="5" ></nbStep>
  <measure color="0,109,126">LEFT_TASKS</measure>
</chart>
The
chart
element may have the following attributes:
versionStart
(mandatory)
the first version present in the chart.
displayAllVersions
(optional, default: false)
defines whether values are shown on the chart for versions prior to versionStart
.
direction
(optional default: down)
the direction of the Goal line (up or down). Up: From 0 to the target.
Down: From the target to 0.
target
(mandatory)
the measure used for draw the goal line with a default value and
an attribute if we get the current value or the value present in
the version specified by the versionStart attribute.
nbStep
(mandatory)
the measure used for draw the future versions with a default
value.
A chart that shows the evolution of one or more measures over time including an objective i.e. the different versions analysed by the Squore engine.
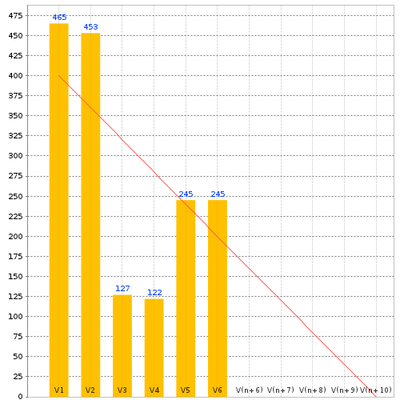
Temporal Evolution Bar Chart Including Goal
<chart type="TEBIGoal" id="NB_OPEN_TASKS_CHART"
  versionStart="V2" direction="down">
  <target defaultValue="400" version="start" >NB_OPEN_TASKS</target>
  <nbStep defaultValue="30" >DAYS_LEFT</nbStep>
  <measure>NB_OPEN_TASKS</measure>
</chart>
The
chart
element may have the following attributes:
versionStart
(mandatory)
the first version present in the chart.
displayAllVersions
(optional, default: false)
defines whether values are shown on the chart for versions prior to versionStart
.
direction
(optional default: down)
the direction of the Goal line (up or down). Up: From 0 to the target.
Down: From the target to 0.
target
(mandatory)
the measure used for draw the goal line with a default value and
an attribute if we get the current value or the value present in
the version specified by the versionStart attribute.
nbStep
(mandatory)
the measure used for draw the future versions with a default
value.
This chart represents the evolution of an indicator across the versions. It takes a single indicator as sub element. The values displayed are calculated on the fly. It is therefore sometimes recommended to use an Temporal Optimised Stacked Bar Chart for performance reasons.
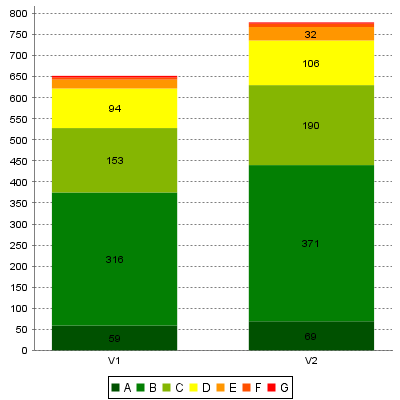
Simple Temporal Evolution Stacked Bar
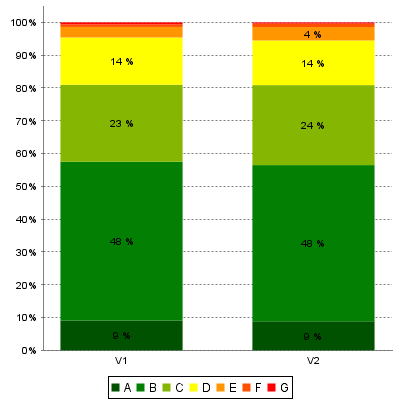
Simple Temporal Evolution Stacked Bar (bars represented as percentages)
<chart type="SimpleTemporalEvolutionStackedBar"
  id="SimpleTemporalEvolutionStackedBar_BAR_ID"
  targetArtefactTypes="FILE"
  asPercentage="false">
  <indicator>MAINTAINABILITY</indicator>
</chart>
The
chart
element has the following attributes:
targetArtefactTypes
allows to filter descendants according to their type. You can use one or more types (since 14-A).
Concrete and abstract types are supported, so it is possible to use an alias, as described in the section called “Artefact Types”.
There are some limitations to what is supported:
Measures associated to an indicator must have the same measureId for all types and be of the same kind (base or derived)
For Stacked Bar Chart, Simple Temporal Evolution Stacked Bar Chart, Simple Pie and Simple Bar the scale associated to the indicator must be the same for be the same for all types
asPercentage
indicates if the values should be displayed as percentages (value
is true or false).
If the
asPercentage
attribute is set to true, the chart will look like this:
The indicator
element supports hiding or excluding
certain levels from the chart by using the hideLevels
excludeLevels
attribute. The difference between
hiding and excluding a level is that hidden levels are taken into account when displaying percentages while
excluded levels are not. For example:
<indicator excludeLevels="UNKNOWN">LEVEL</indicator>
or
<indicator hideLevels="LEVELA;LEVELB">LEVEL</indicator>
The Artefact Table allows displaying a list of child artefacts and one or more of their characteristics in table format, as shown below:
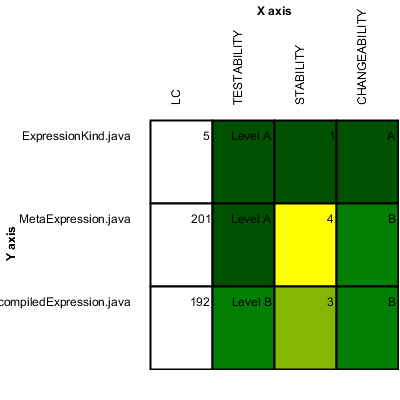
Artefact Table
<chart type="ArtefactTable"
    id="ARTEFACT_TABLE_ID"
    xLabel="X axis"
    yLabel="Y axis"
    onlyDirectChildren="true"
    orderByMeasure="INDEX"
    inverted="false"
    targetArtefactTypes="FILE">
  <indicator label="LC">LC</indicator>
  <indicator displayValueType="NAME" colorFromScale="SCALE_COLOR">TESTABILITY</indicator>
  <indicator displayValueType="RANK">STABILITY</indicator>
  <indicator displayValueType="MNEMONIC">CHANGEABILITY</indicator>
</chart>In the example above, the indicators use different displayValueType
to show
all the supported values.
The Artefact Table
chart
element may have the following attributes:
targetArtefactTypes
allows to filter descendants according to their type. You can use one or more types (since 14-A).
Concrete and abstract types are supported, so it is possible to use an alias, as described in the section called “Artefact Types”.
onlyDirectChildren
(optional, default: true) includes artefacts that are direct children of the current artefact
in the chart when set to true, or all descendants of the current artefact when set to false.
orderByMeasure
(optional, alphabetical if omitted) allows sorting the list of artefacts according to
the value of the specified measure ID.
inverted
(optional, default: false) allows reversing the
sort order defined by the orderByMeasure
attribute.
The Artefact Table chart takes one or more
indicator
sub-elements, which can point to measures or indicators. Note that
the table cells are automatically coloured according to the corresponding scale level colour when the metric
displayed in the table is an indicator. This behaviour can be overridden by using the
colorFromScale
attribute, which takes a scale ID to apply colour from according to the
rank of the value displayed.
In addition, you can add a row and column to aggregate the results found in each table row or column using the
row
or column
element. Each of these elements accepts the following
attributes:
aggregationType
(optional, default: AVG in most charts, SUM in table charts) defines how the values for the
metrics on the chart are aggregated. The supported values are MIN,
MAX, OCC, AVG,
DEV, SUM, MED,
and MOD.
label
(mandatory)
is a string that is displayed as the legend of the row or column.
color
(optional, default: grey)
is the fill colour for the row or column.
colorFromScale
(optional, default: empty)
allows filling cells with a colour taken from a specific scale.
The Distribution Table is an matrix-like visualisation of two characteristics of an artefact's descendants
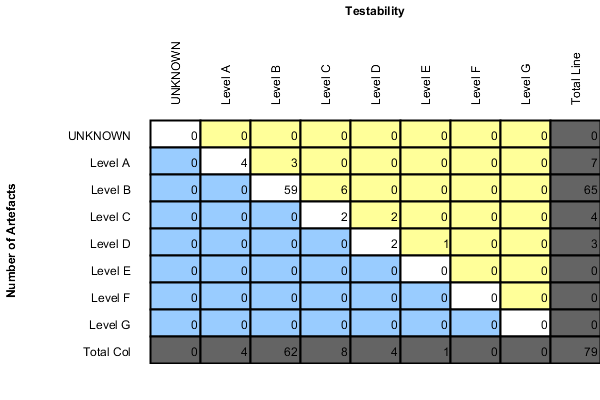
Distribution Table
<chart type="DistributionTable"
  id="DIST_TABLE_FIXED_COLOR"
  width="600"
  height="400"
  targetArtefactTypes="FILE"
  xLabel="Testability"
  yLabel="Number of Artefacts"
  topColor="255,255,153" bottomColor="153,204,255">
  <indicator>ROOT</indicator>
  <indicator>ANALYSABILITY</indicator>

  <row aggregationType="SUM" label="Total Col" color="100,100,100" />
  <column aggregationType="SUM" label="Total Line" color="100,100,100" />
</chart>
The Distribution Table
chart
element may have the following attributes:
targetArtefactTypes
allows to filter descendants according to their type. You can use one or more types (since 14-A).
Concrete and abstract types are supported, so it is possible to use an alias, as described in the section called “Artefact Types”.
color
(optional, default: white)
is the colour used to fill all the cells in the table. An example
Distribution Table using color
is shown later in this section.
colorFromScale
(optional, default: none)
is the colour scale used to fill the cells in the table according to the rank of each cell. An example
Distribution Table using colorFromScale
is shown later in this section.
If several colour attributes are found, they are applied in this order:
The Distribution Table chart takes two
indicator
sub-element that will be used to build a matrix of scale levels.
In addition, you can add a row and column to aggregate the results found in each table row or column using the
row
or column
element. Each of these elements accepts the following
attributes:
aggregationType
(optional, default: AVG in most charts, SUM in table charts) defines how the values for the
metrics on the chart are aggregated. The supported values are MIN,
MAX, OCC, AVG,
DEV, SUM, MED,
and MOD.
label
(mandatory)
is a string that is displayed as the legend of the row or column.
color
(optional, default: grey)
is the fill colour for the row or column.
colorFromScale
(optional, default: empty)
allows filling cells with a colour taken from a specific scale.
Some simpler examples of Distribution Table charts can be found below:
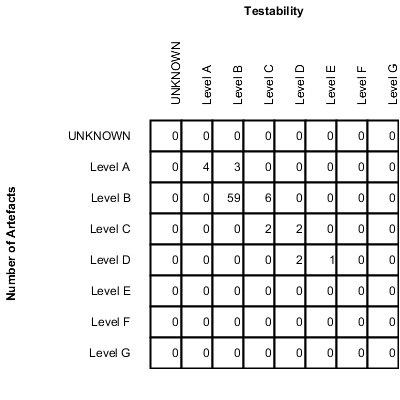
Simple Distribution Table
<chart type="DistributionTable"
		id="DIST_TABLE"
		name="Distribution Table"
		width="400"
		height="400"
		targetArtefactTypes="FILE"
		xLabel="Testability"
		yLabel="Number of Artefacts">
	<indicator>ROOT</indicator>
	<indicator>ANALYSABILITY</indicator>
</chart>
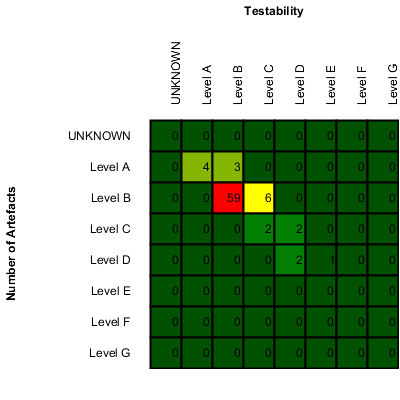
Distribution Table with cells coloured according to a scale
<chart 	type="DistributionTable"
		id="DIST_TABLE_SCALE_COLOR"
		name="Distribution Table Scale Color"
		width="400"
		height="400"
		targetArtefactTypes="FILE"
		xLabel="Testability"
		yLabel="Number of Artefacts"
		colorFromScale="SCALE_TEST_BASIC">
	<indicator>ROOT</indicator>
	<indicator>ANALYSABILITY</indicator>
</chart>

  <Scale scaleId="SCALE_TEST_BASIC">
    <ScaleLevel levelId="LEVELA" bounds="];1]" rank="1" />
    <ScaleLevel levelId="LEVELB" bounds="]1;2]" rank="2" />
    <ScaleLevel levelId="LEVELC" bounds="]2;4]" rank="3" />
    <ScaleLevel levelId="LEVELD" bounds="]4;8]" rank="4" />
    <ScaleLevel levelId="LEVELE" bounds="]8;16]" rank="5" />
    <ScaleLevel levelId="LEVELF" bounds="]16;32]" rank="6" />
    <ScaleLevel levelId="LEVELG" bounds="]32;[" rank="7" />
  </Scale>
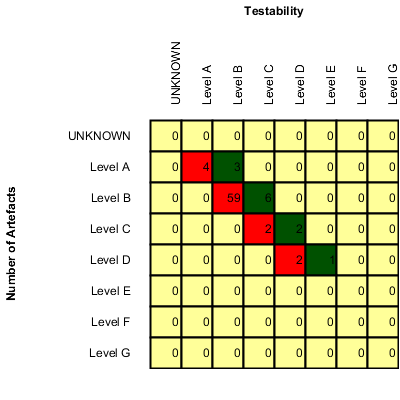
Simple Distribution Table with red/green
<chart 	type="DistributionTable"
		id="DIST_TABLE_SCALE_COLOR_RED_GREEN"
		name="Distribution Table Scale Red/Green"
		width="400"
		height="400"
		targetArtefactTypes="FILE"
		xLabel="Testability"
		yLabel="Number of Artefacts"
		topColorFromScale="SCALE_GREEN"
		middleColorFromScale="SCALE_RED"
		bottomColorFromScale="SCALE_RED">
	<indicator>ROOT</indicator>
	<indicator>ANALYSABILITY</indicator>
</chart>

  <Scale scaleId="SCALE_GREEN">
    <ScaleLevel levelId="BLANK" bounds="];1[" rank="-1" />
    <ScaleLevel levelId="LEVELA" bounds="[1;[" rank="1" />
  </Scale>
  <Scale scaleId="SCALE_RED">
    <ScaleLevel levelId="BLANK" bounds="];1[" rank="-1" />
    <ScaleLevel levelId="LEVELG" bounds="[1;[" rank="1" />
  </Scale>
The Control Flow Chart is a graphical representation of the logical structure of a function using different-coloured shapes reflecting the type of logical break (if, while, switch...) in the code.
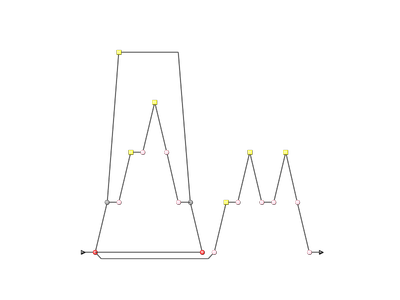
Control Flow Chart
<chart id="CONTROL_ID" type="ControlGraph"</chart>
The chart
for a Control Flow Chart does not accept any elements or attributes apart from the common ones.
The Source Code Viewer is a special chart-like placeholder on a dashboard that allows users to click it to view the source code of the current artefact.
Source Code Viewer
<chart id="SOURCE_CODE_ID" type="SourceCode"</chart>
The chart
for the Source Code Viewer does not accept any elements or attributes apart from the common ones.
The Scrum Board offers a graphical representation of the completion of your tasks for project monitoring. Each task is represented as a sticky note that displays the task ID and provides a link to the issue tracker to review the task.
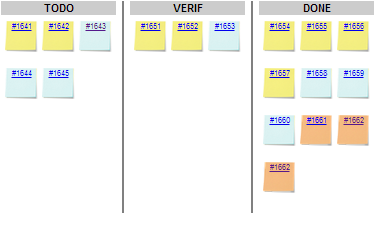
Scrum Board
<chart type="ScrumBoard"   postitByColumn="3"
			  header="SCALE_PARKING_LOT"
			  prefixTaskLink="http://support.example.com/view.php?taskId=" >
  <rule color="255,0,0">EVO_TODO</rule>
  <rule>BUG_TODO</rule>
  <rule>BUG_INT_TODO</rule>
  <rule>EVO_VERIF</rule>
  <rule>BUG_VERIF</rule>
  <rule>BUG_INT_VERIF</rule>
  <rule>EVO_DONE</rule>
  <rule>BUG_DONE</rule>
  <rule>BUG_INT_DONE</rule>
</chart>
The chart
tag accepts the following attributes:
The Scrum Board requires the following elements:
Table of Contents
Wizards provide the entry point for Squore users to create and edit
projects. A model can have one or more wizards, depending on
the options that a Squore administrator decides to display to end-users when they create projects.
This is achieved by editing the file Bundle.xml
located in the Wizards folder inside a particular model.
Creating or editing a project in Squore involves going through these three steps after selecting a wizard:
Note: When editing projects, the Data Provider Selection screen is shown or hidden depending on the ability of each Data Provider selected originally to accept new settings. When nothing can be changed, the step is skipped completely.
The syntax of a Bundle.xml file
offering one wizard to the user is shown below:
<?xml version="1.0" encoding="UTF-8"?>
<Bundle>
	<!-- attributes common to every wizard in this bundle -->
	<tags>
		<tag type="numericValue" name="Project Business Value"
		measureId="BV" suffix = "FP" defaultValue="0" />
	</tags>
	<wizard
	  wizardId="STD_PROJ"
	  versionPattern="V#N1#"
	  autoBaseline="false"
	  users="demo;admin" groups="users"
	  img="wizardicon.png">
		<!-- attributes specific to this wizard -->
		<tags>
			<tag type="numericValue" name="Project Cost" measureId="COST"
			  suffix = "M/M" defaultValue="0" />
		</tags>
		<repositories all="true" hide="false">
			<repository name="FROMPATH" checkedInUi="true">
				<param name="path" value="/media/sources/" />
			</repository>
		</repositories>
		<tools all="true">
			<tool name="SQuORE" optional="false">
				<param name="languages"
				    value="cpp:.c,.C,.h,.H;java:.java;csharp:.cs;"
				    availableChoices="cpp;java;csharp" />
			</tool>
			<tool name="Antic_auto"
			    optional="true"
			    checkedInUI="true"
			    projectStatusOnFailure="warning" />
		</tools>
	</wizard>
</Bundle>
In order for a wizard to appear in Squore, you need to define its ID, default version pattern and icon, and it will become available when clicking on the New Project... button. Note that the availability of a wizard can also be restricted to a set of users or groups . The rest of this chapter covers the settings available for each step of the project creation wizard.
The wizard
element accepts the following attributes:
wizardId
(mandatory): the ID of the wizard, used when creating projects from the command line
versionPattern
(optional): the pattern to apply to define the version number when a new version is created.
img
(mandatory): the ID of the wizard, used when creating projects from the command line
autoBaseline
(optional, default: true) (since 14-B) defines whether versions created using this wizard are by default baselines (true) or drafts (false). More information about baselines and drafts can be found in the Getting Started Guide.
users
(optional, no restriction if empty) is a semi-colon-separated list of users which are allowed to see the wizard
groups
(optional, no restriction if empty) is a semi-colon-separated list of Squore groups whose users are allowed to see the wizard
group
(optional, default: empty) defines a default display group for new projects. projects
that belong to the same group are shown in a common subfolder in the Project Portfolio.
The users
and groups
attributes are only used to filter the list of
wizards in the web interface. This does not prevent users from creating projects using the wizard from the command line, or from launching a
new analysis of an already existing project using this wizard.
The versionPattern parameter allows specifying a pattern to create the version name automatically for every analysis. It supports the following syntax:
#N#: A number that is automatically incremented
#Nn#: A number that is automatically incremented using n digits
#Y2#: The current year in 2-digit format
#Y4#: The current year in 4-digit format
#M#: The current month in two digit format
#D#: The current day in two digit format
#H#: The current hour in 24 hour format
#MN#: The current minute in two digit format
#S#: The current second in two digit format
Any character other than # is allowed in the pattern. As an example, if you want to
produce versions labelled build-198.2013-07-28_13h07m (where 198 is an auto-incremented number and the date and time are the
timestamp of the project creation), you would use the pattern: build-#N3#.#Y4#-#M#-#D#_#H#h#MN#m
Users specify attributes in the first step project
creation or edition at project level. These attributes can also be used for
other artefact types and can be edited after building a project in the Forms tab of the Explorer.
You can define what information can enter when creating a project (or the default values offered to the users) by using the Tags section
of the wizard definition file. The attribute values specified by the user are passed just like measures passed by any other Data Provider.
The values are imported as base measures as long as the model contains a definition that uses the same measure ID.
<tags textAlign="RIGHT" valueAlign="LEFT">
  <tag type="numericValue" name="Project Business Value"
   group="Important Decision Criteria"
   measureId="BV" suffix = "FP"
   defaultValue="0" />
  <tag type="booleanChoice" name="is Critical"
    group="Important Decision Criteria" measureId="CRIT"
   defaultValue="false"  />
  <tag type="multipleChoice" name="Status: " measureId="STATUS"
   defaultValue="SNAPSHOT" displayType="radioButton">
    <value key="SNAPSHOT" value="1" />
    <value key="VALIDATION" value="2" />
    <value key="RELEASE" value="3" />
  </tag>
  <tag type="multipleChoice" name="Department: "
   measureId="DEPART" defaultValue="HR" displayType="comboBox">
    <value key="ACCOUNT" value="1" />
    <value key="HR" value="2" />
    <value key="SALES" value="3" />
    <value key="OTHER" value="4"/>
  </tag>
  <tag type="date" name="Sprint Start: " measureId="SPRINT_START"
    defaultValue="TODAY" />
  <tag type="date" name="Sprint End: " measureId="SPRINT_END"
    defaultValue="2012/12/31" />
</tags>
The image below shows how attributes defined in the wizard appear to a Squore user when creating a version of a project:

This other image shows how attributes defined in the wizard appear to a Squore user when in the Forms tab of the explorer:
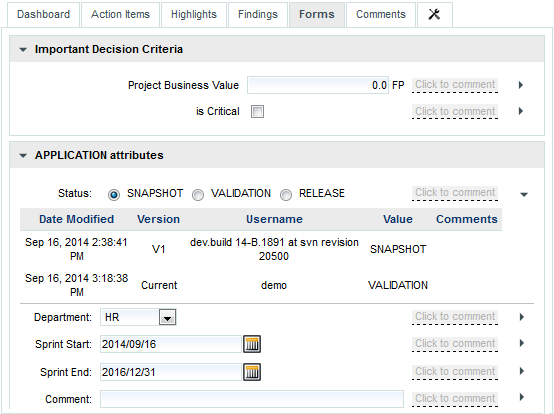
The tags
element is used to group several tag
sub-elements
and accepts the following attributes:
The tag
element accepts the following attributes:
type
(mandatory) defines the type of information accepted as value for this attribute.
The following values are accepted:
text for free text entry
numericValue for numbers
date for dates
booleanChoice for a boolean
multipleChoice for offering a selection as a list
displayType
(optional) allows specifying the display type in the Forms tab and
the project creation wizard. The following values are accepted:
comboBox for attributes of type multipleChoice
radioButton for attributes of type multipleChoice
input for attributes of type text
textarea for attributes of type text
name (optional) is the label used to describe the attribute in the UI.measureId (mandatory) is the ID of the measure that the value is passed to.suffix (optional) is the label displayed after the value in the UI.defaultValue (optional) is the default value of the attribute if not specified by
the user. In the case of a date, the value TODAY() can
be used to automatically use today's date as the default value.group (optional) helps grouping various attributes by category visually in the Forms tab of the Explorer.targetArtefactTypes (optional, default: APPLICATION) allows associating the attribute to other types of artefacts (more on this below).Note: A tag element can appear within a wizard element or at Bundle level.
In case two tag elements impacting the same measureId exist at both levels, the definition within the
wizard element overrides the one at Bundle-level.
All attributes described above are defined at application level. They are visible and editable when creating a project and in the Form tab of the Explorer if the project is in draft mode. It is possible to associate an attribute to any artefact type by using the targetArtefactTypes attribute, as shown below:
<tag group="Project Status"
  targetArtefactTypes="APPLICATION;SOURCE_CODE;DOCUMENTATION;FOLDER"
  type="booleanChoice" name="is tested?" measureId="TESTED"
  defaultValue="false" />
You may specify whether users can use any available Repository Connectors, which is the default one and
what the default values are for each Repository Connector using the repositories
element in your wizard definition . If you
want to allow any Repository Connector in Squore, do not specify any repositories
element, which is the equivalent of using:
<repositories all="true" hide="false" />
The all
attribute instructs Squore to show all Repository Connectors.
The hide
allows hiding the Repository Connector selection fields when going through
the wizard in the web UI. Note that Squore automatically ignores the value of hide
if it detects that at least one of the Data Providers in the project needs sources.
In order to restrict which Repository Connectors are available, use:
<repositories all="false" hide="false">
	<repository name="FROMPATH" checkedInUI="true" >
		<param name="path" value="/media/sources" />
	</repository>
	<repository name="FROMZIP" />
	<repository name="SVN" />
</repositories>
The repository
element accepts the following attributes:
name (mandatory) is the name of the Repository Connector to be used.
It must corresponds to one of the Repository Connectors defined in your configuration
(by default under <INSTALLDIR>/configuration/repositoryConnectors/[name]).
Note: Each repository element accepts name/value pairs as parameters in which you can override
the values defined in the Repository Connector's default configuration.
The following image illustrates how the configuration above is displayed in Squore:
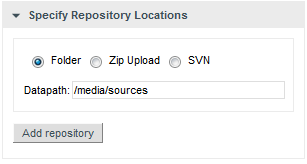
You may specify whether all or some Data Providers are available, and provide their default settings when the project creation wizard runs.
Data Providers are specified using the tools
element. If you simply want to allow users to pick any Data Provider available in Squore, use:
<tools all="true" expandedInUI="true" />
In order to restrict which Data Providers are available, use:
<tools all="false" expandedInUI="true">
	<tool name="SQuORE" optional="false" projectStatusOnFailure="warning" expandedInUI="true" checkedInUI="true" />
	<tool name="CheckStyle" optional="true" projectStatusOnFailure="error" checkedInUI="true" />
	<tool name="Findbugs_auto" optional="true" projectStatusOnFailure="ignore" checkedInUI="false">
		<param name="Findbugs_auto::class_dir"
		      value="/path/to/my/classes" />
	</tool>
</tools>
The tool
element accepts the following attributes:
name is the name of the Data Provider to be used.
It must corresponds to one of the Data Providers defined in your configuration
(by default under <INSTALLDIR>/configuration/tools/[name]).
optional (true|false, default: false): When set to false the Data Provider is always included in the analysis, even when not explicitly called from the command line. It also prevents from unchecking it in the web interface. When set to true, the Data Provider is available but not automatically included in an analysis.
projectStatusOnWarning (ignore|warning|error, default: warning) specifies the status to give the analysis if the Data Provider execution finishes in WARN level.
projectStatusOnFailure (ignore|warning|error, default: warning) specifies the status to give the analysis if the Data Provider execution finishes in ERROR or FATAL level.
When set to ignore, the the project ends in the Created state.
When set to warning, the the project ends in the Warning state, which means that a draft is created (even if you required a baseline version to be created).
When set to error, the the project ends in the Error state, which means that no new version is created.
Note: Each tool element accepts name/value pairs as parameters in which you can override
the values defined in the Data Provider's default configuration.
The following image illustrates how the configuration above is displayed in Squore:
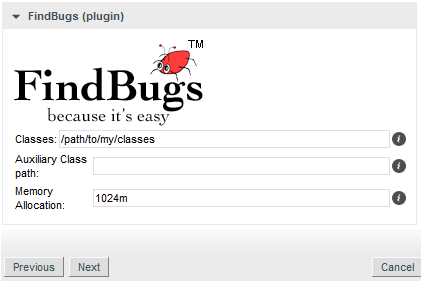
If the wizard definition includes the SQuORE Data Provider, users will be able to select the programming languages for the source code to be analysed.
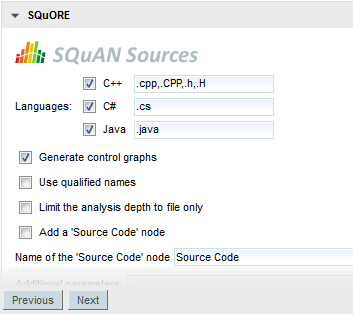
The picture above shows the Data Provider settings for the SQuORE Data Provider
defined by these lines in the wizard's Bundle.xml:
<tools>
	<tool name="SQuORE" optional="false">
		<param name="languages"
		          value="cpp:.c,.C,.h,.H;java:.java;csharp:.cs;"
		          availableChoices="cpp;java;csharp"" />
	</tool>
</tools>
The language settings are defined using the following attributes:
availableChoices
defines the languages available for this wizard. The key must be one of the currently supported languages:
supported languages: ABAP, Ada, C, COBOL, C++, C#, Fortran 77, FOrtran 90, Java, JavaScript, Lustre, PHP, PL/SQL, Python, T-SQL, Visual Basic .NET, XAML
corresponding keys: abap, ada, c, cobol, cpp, csharp, fortran77, fortran90, java, javascript, lustre, php, plsql, python, tsql, vbnet, xaml
value
defines the languages checked by default and their extensions when creating a new project, or used by default when not specified explicitly on the command line. One or more languages can be selected, so you can analyse projects containing source code in multiple languages (since 14-B).
You can also specify the list of default extensions for each language by using the
language:extension1,extension2; format. Here is an example of a full language specification:
<param name="languages"
    value="c:.c,.h;cpp:.cpp,.h;java;csharp"
    availableChoices="cpp;java;csharp" />
Note: You can set the same extension for more than one language,
but you will not be able to run an analysis that contains two languages using the same extension.
In the example above, see .h is a valid extension for C and C++, but you will
not be able to select both C and C++ as part of the same project because of the extension clash.
Table of Contents
Each model described in the Squore Configuration defines a set of reports in
the bundle file under <INSTALLDIR>/Configuration/models/MyModel/Reports/Bundle.xml.
These depend on the Analysis Model chosen, and the role of the currently logged-in user. Every report is
built upon two pieces: a Jasper Report template file, that defines how the report will be organised,
and its content: a set of charts and tabular data.
Here is an example configuration file for a report:
<?xml version="1.0" encoding="UTF-8"?>
<Bundle xmlns:xi="http://www.w3.org/2001/XInclude">
  <SquoreReport
    id="DR_DASHBOARD_REPORT"
    templatePath="../../Shared/Reports/templates/template.jrxml" logo="header_image.png">
    <Role name="DEFAULT;PROJECT_MANAGER;DEVELOPER">
      <Report type="APPLICATION;FILE">
        <Charts displayComments="true">
          <xi:include href="../../Analysis/key_performance_indicator.xml"/>
          <xi:include href="../../Analysis/Code/ISO9126_Maintainability/MaintainabilityKiviat.xml"/>
          <xi:include href="../../Analysis/Code/TechnicalDebt/TechnicalDebtTrend.xml"/>
          <xi:include href="../../Analysis/Code/ArtefactRating/FunctionOptimisedPie.xml"/>
        </Charts>
        <Tables>
          <xi:include href="../Dashboards/tables/line_counting.xml" />
          <xi:include href="../Dashboards/tables/dates.xml" />
          <xi:include href="../Dashboards/tables/levels.xml" />
          <xi:include href="../Dashboards/tables/displayed.xml" />
          <xi:include href="../Dashboards/tables/ArtefactsTable.xml" />
        </Tables>
        <Data>
          <Findings id="VIOLATIONS" />
          <Findings id="PRACTICES" type="ALL_PRACTICE" />
          <DefectReports id="WORST" />
        </Data>
      </Report>
    </Role>
	</SquoreReport>
</Bundle>
A Bundle is composed of one or more SquoreReport
elements. Each
SquoreReport
is associated to a Jasper template file (a file with a .jrxml extension).
The attributes allowed for the SquoreReport
element are the following:
The following sections will take you through restricting your template to certain roles or artefact types, and
define which Charts
, Tables
and
Data
(action items and findings) are included in the report.
Squore uses Jasper Reports for its reports templates. A jasper template is an XML file with .jrxml extension. There are three levels of templates used in a Squore report:
The main formatting template, that defines the two main areas (charts and data), which allows to set a specific document template.
A template for the Action Items and Findings lists.
A template for displaying each row of the Action Items and Findings list.
The following generic attributes are available in a report template:
$P{application}: The name of the project.
$P{artefactName}: The name of the artefact
$P{artefactType}: The type of the artefact
$P{author}: The name of the user generating the report
$P{model}: The analysis model used
$P{version}: The name of the version
$P{versionDate}: The creation date of the version
The following attributes specific to charts can also be used:
$P{CHART_ID}: a unique identifier for the chart
$P{CHART_URL_0} to $P{CHART_URL_X}: used to resolve the path to chart [0] to [X]
$P{CHART_NAME_0} to $P{CHART_NAME_X}: used to resolve the name of chart [0] to [X]
Note: iReport is the official visual building tool edited by JasperSoft, the company behind Jasper Reports. Since the template file is written in XML, a simple text editor like Notepad++ can be used, for advanced users at least.
You can override the default header image in the report file by adding a logo
attribute in Bundle.xml, as shown below:
<SquoreReport id="DR_DASHBOARD_REPORT"
    templatePath="../../Shared/Reports/templates/template.jrxml"
    logo="../../Shared/Reports/templates/header_logo.png">
The path to the header logo file is relative to the location of Bundle.xml.
For best results, use a header image with a ratio of 408 by 65 points.
In each SquoreReport
element, one or more Role
elements can be defined to specify what data is needed for this each of user. The only required attribute for the
Role
tag is name
, with a comma-separated list of roles.
If you want your template to be available to any logged-in user, specify the role name DEFAULT.
Each role contains one or mode Report
elements, each one with a
type
attribute that contains the target artefact type for the report template.
Charts
describes the chart elements that the report will display,
according to the template file definition.
The Charts
element has one or more chart
elements. The charts available
for reports are the same as the charts used for dashboards. See the section called “The Charts Area” for a complete
list of available charts. The ID attribute is needed to load generated images in templates. Note that you can choose
to include the chart's comments in the report by setting the displayComments
to
true.
Tables
describes the chart elements that the report will display,
according to the template file definition.
The Tables
element has one or more table
elements. You can
use the tables created for the dashboard or create a table that is not included in any dashboard.
Refer to the section called “Scorecard Tables” for a complete reference about tables.
The Data
element describes the action items (element: DefectReports
)
and findings (element: Findings
)that will be included in the report,
according to the template file definition.
The attributes allowed for the DefectReports
element are the following:
The Findings
element are the following:
Action Items and Findings are sorted in the same way as in the user interface, which you can customise for each model by following the procedure described in the section called “Sort Order for Action Items and Findings”.
Each model described in the Squore Configuration may define a set of
exports in the models/MODEL/Exports/Bundle.xml bundle file.
Exports available in the user interface depend on the role of the currently
logged-in user and the selection in the Project Portfolios and the Artefact Tree
views.
Here is an example of a bundle file:
<?xml version="1.0" encoding="UTF-8"?>
<Bundle>
	<Role name="ADMINISTRATOR;PROJECT_MANAGER">
		<Export type="MODEL">
			<ExportScript name="EXP2" script="${scriptDir}/sqexport.pl">
				<arg value="-f" />
				<arg value="${outputFile}" />
				<arg value="versions" />
				<arg value="-ml" />
				<arg value="${idModel}" />
			</ExportScript>
		</Export>
		<Export type="APPLICATION">
			<ExportScript name="EXP1" script="${scriptDir}/sqexport.pl">
				<arg value="-f" />
				<arg value="${outputFile}" />
				<arg value="findings"/>
				<arg value="-pcR"/>
				<arg value="${idApplication}"/>
				<arg value="${idVersion}"/>
			</ExportScript>
		</Export>
	</Role>
</Bundle>
The default Squore configuration includes the following scripts by default. Each script is described in an appendix at the end of this manual.
The Bundle.xml file above contains some variables
that are replaced at runtime. The following is the list of variables that
can be used in the ExportScript
and
arg
XML elements.
Note that the ${outputFile} variable is mandatory.
Used to resolve the location of the addons directories on Squore Server, in
which the scripts/export-scripts subdirectory contains the default
scripts.
Used to resolve the location of the configuration directories on Squore Server,
in which the <MODEL_NAME>/Exports subdirectory contains
the scripts you added to the product.
The name of the output file where the export script writes to. The filename is guaranteed to be unique on each call.
The identifier of the logged in user.
The identifier of the model that is currently selected in the Project Portfolios.
The identifier of the application that is currently selected in the Project Portfolios.
The identifier of the version that is currently selected in the Project Portfolios.
The identifier of the artefact that is currently selected in the Artefact Tree.
This function resolves at runtime the type aliases of TYPENAME. That may be used to simplify bundles, as you may achieve the exact same thing by manually listing all types. The result is a coma separated list of types.
Table of Contents
The list of action items raised by Squore according to the triggers configured in your decision model can be exported out of Squore so it is reused and managed in any third-party application you use to track defects or issues. By default, Squore supports exporting in these formats:
This list can be expanded by adding custom export formats to your configuration.
Before making a new export available, you need to understand the information that is available to export. In order to see the full export, export action items from Squore using the XML export to dumps all the information available to an xml file. Creating a new format is as simple as creating a stylesheet to manipulate the contents of the full export to your liking.
Let's first look at what an export
configuration looks like. On Squore Server, go to <INSTALLDIR>/Configuration/scripts/export.
Each export format is specified in its own folder. Each export format is defined by two files: transform.xsl
and export.properties. The file file transform.xsl is a stylesheet to define what information
gets exported, and the file export.properties defines the extension and charset of the export file.
Note: The export.properties file is optional. If omitted, Squore will create a file with a ".xml" extension using the UTF-8_BOM character set, as if using the file below:
charsetName = UTF-8_BOM
extension = .xml
For more information about available charsets, consult http://docs.oracle.com/javase/6/docs/api/java/nio/charset/Charset.html
After you to define your stylesheet, create a new folder called MyCustomExport
in Squore's configuration folder and create the two definition files needed by saving your stylesheet as transform.xsl
and specifying the desired extension and charset for the report file . The new export format will be available in Squore the next time
you refresh your dashboard.
Table of Contents
The Highlights tab in Squore's Explorer is a flat list of artefacts in predefined categories for a model. These categories are defined in your model by including content in the highlights Bundle.xml file for your model. In this chapter, you will learn to understand the default highlights in the default models and will be able to consult the full reference for formatting a highlights bundle.
The default highlights bundle looks similar to this:
<Bundle>
  <Role name="DEFAULT" preSelectedType="FUNCTION">
  <Filters type="PACKAGES">

        <TopArtefacts id="TOP_10_WORST_ARTEFACTS"
            order="DESC" resultSize="10"/>

        <TopDeltaArtefacts id="TOP_10_MOST_DETERIORATED_ARTEFACTS"
            order="DESC" resultSize="10"/>

        <TopDeltaArtefacts id="TOP_10_MOST_IMPROVED_ARTEFACTS"
            order="ASC" resultSize="10"/>

        <TopBorderlineArtefacts id="TOP_10_'BORDERLINE'_ARTEFACTS"
            order="ASC" minLevel="LEVELC" resultSize="10"/>

        <TopNewArtefacts id="ALL_NEW_ARTEFACTS"
            order="DESC" resultSize="*"/>

        <TopModifiedArtefacts id="ALL_MODIFIED_ARTEFACTS"
            order="DESC" resultSize="*"/>

    </Filters>
</Bundle>
This results in the following flat lists being displayed in Squore:

The Squore Default Highlight Categories
The top element of the highlights bundle consists of a Bundle
top element in which two elements are allowed:
Role defines the user roles allowed to use the predefined highlight categories for this model using the name attribute (mandatory) and the default artefact type selected in the UI using the preSelectedType attribute (optional).Filters defines a list of highlight categories for certain types of artefact types, defined using the type attribute.There are several types of predefined highlights categories:
TopArtefacts is used to retrieve artefacts with
the biggest value for a given measure.TopDeltaArtefacts is used to retrieve artefacts
with the biggest variation in the value of a given measure since an earlier version.TopBorderlineArtefacts is used to retrieve
artefacts that are closest to the upper limit of a given scale level, and therefore
most likely to be easy to improve with the smallest effort.TopNewArtefacts is used retrieve artefacts that
are new in the current version, sorted according to the value of a given measure.TopModifiedArtefacts is used to retrieve the artefacts
modified in the current version, sorted according to the value of a given measure.
TopArtefacts
allows the following attributes:
id (mandatory): the id of the filter.name (deprecated): unused.artefactTypes (optional): the types of artefacts to filter on.excludingTypes (optional, default: none): the artefact types for which the metric should not be displayed. This allows refining the types entered in the main filter above.measureId (optional, default: the measureId associated with the root indicator): the name of the measure Id to filter on.order (optional, default: ASC): the sort order for the list according to the reference measure ID. Valid values are ASC and DESC.altMeasureId (optional, default: empty): The second measure ID to use for sorting.altOrder (optional, default: empty): The sort order for the second measure ID. Valid values are ASC and DESC.resultSize (mandatory): the number of results to include in the list. Use 10 to display 10 artefacts or * to display all artefacts.
altMeasureId
and altOrder
shall be both set or not set.
TopDeltaArtefacts
allows the following attributes:
id (mandatory): the id of the filter.name (deprecated): unused.artefactTypes (optional): the types of artefacts to filter on.measureId (optional, default: LEVEL): the name of the measure Id to filter on.order (mandatory): the sort order for the list according to the reference measure ID. Valid values are ASC and DESC.resultSize (mandatory): the number of results to include in the list. Use 10 to display 10 artefacts or * to display all artefacts.
TopBorderlineArtefacts
allows the following attributes:
id (mandatory): the id of the filter.name (deprecated): unused.artefactTypes (optional): the types of artefacts to filter on.indicatorId (optional, default: LEVEL): the name of the measure Id to filter on.minLevel (optional, default: empty): The name of the rank to be used as the threshold for results. If you want to exclude artefacts above LEVELC, set minLevel to LEVELC.order (mandatory): the sort order for the list according to the reference measure ID. Valid values are ASC and DESC.resultSize (mandatory): the number of results to include in the list. Use 10 to display 10 artefacts or * to display all artefacts.
TopNewArtefacts
allows the following attributes:
id (mandatory): the id of the filter.name (deprecated): unused.artefactTypes (optional): the types of artefacts to filter on.measureId (optional, default: LEVEL): the name of the measure Id to filter on.order (mandatory): the sort order for the list according to the reference measure ID. Valid values are ASC and DESC.resultSize (mandatory): the number of results to include in the list. Use 10 to display 10 artefacts or * to display all artefacts.
TopModifiedArtefacts
allows the following attributes:
id (mandatory): the id of the filter.name (deprecated): unused.artefactTypes (optional): the types of artefacts to filter on.order (mandatory): the sort order for the list according to the reference measure ID. Valid values are ASC and DESC.resultSize (mandatory): the number of results to include in the list. Use 10 to display 10 artefacts or * to display all artefacts.
All highlights categories support the following nested elements, to customise output:
Column
allows the following attributes:
measureId (optional): the ID of the measure.indicatorId (optional): the ID of the indicator.artefactTypes (optional, default: the parent value of artefactTypes): the artefact types for which the metric should be displayed. This allows refining the types entered in the main filter above.excludingTypes (optional, default: the parent value of excludingTypes): the artefact types for which the metric should not be displayed. This allows refining the types entered in the main filter above.headerDisplayType (optional, default: NAME): the label to display in the header.
NAME is the measure's nameMNEMONIC is the measure's mnemonicdisplayType (optional, default: VALUE): the value display type.
VALUE is the measure's numeric value.RANK is the indicator's rank.ICON is the indicator's rank icon.DATE is the measure's value, displayed as an UTC date.DATETIME is the measure's value, displayed as an UTC date and time.TIME is the measure's value, displayed as an UTC time.dateStyle (optional, default: DEFAULT): the date formatting style,
used when the displayType is one of DATE or DATETIME.
timeStyle (optional, default: DEFAULT): the time formatting style,
used when the displayType is one of DATETIME or TIME. See above for available styles.datePattern (formerly dateFormat) (optional, default: empty): the date pattern, used when
the displayType is one of DATE,
DATETIME or TIME.
decimals (optional, default: 2): the number of decimals, used when
the displayType is VALUE.suffix (optional, default: empty): the text to display after the measure.
Where
allows the following attributes:
OrderBy
allows the following attributes:
Table of Contents
Some configuration options are also available to tweak the Squore user interface.
These options need to be specified in a file called properties.xml located at
the root of your Configuration folder, or in various other Bundle.xml files.
This chapter describes these options and their effect on the user interface.
By default, the Explorer shows the following tabs for all users:

The default set of tabs in the Explorer, the tab displayed by default is the Dashboard tab.
Users can change the displayed tabs by clicking the Tab Manager icon right of the last tab. You can also define the
available tabs and their default state (shown, hidden, default) by editing properties.xml as shown below:
	<!-- Active tabs -->
	<explorerTabs>
		<tab name="dashboard" default="true"/>
		<tab name="action-items" mandatory="true"/>
		<tab name="highlights"/>
		<tab name="findings"/>
		<tab name="reports" rendered="false"/>
		<tab name="attributes"/>
		<tab name="indicators" rendered="false"/>
		<tab name="measures" rendered="false"/>
		<tab name="annotations"/>
	</explorerTabs>
Each tab
element accepts the following parameters:
name
(required, must be one of dashboard,
action-items, highlights, findings,
reports, attributes, indicators,)
measures or annotations) identifies the tab.
mandatory
(optional, default: false) removes the option to hide the tab from the web UI for all users.
default
(optional, default: false) makes the tab the default tab in Squore. Every link to a project or artefact that does not specifically request a target tab will open the Explorer with this tab active by default. Note that when set to true, the tab is automatically mandatory as well.
rendered
(optional, default: true) specifies whether the tab is shown (true) or hidden (false) by default. Hidden tabs can be shown by checking a box in the Tab Manager. Note that the value of this attribute is ignored if either default
or mandatory
is set to true.
You can use the help
option to add links that will appear in the Help menu in Squore
(? in the main toolbar), as shown below.
<?xml version="1.0" encoding="utf-8" standalone="yes"?>
  <Bundle>
	  <!-- Customise the help links that appear in the right menu -->
	  <help label="OWASP 25" url="http://cwe.mitre.org/top25/" />
	  <help label="JBoss Wiki" url="http://www.jboss.org/jbosswiki"
        	profiles="ADMINISTRATOR;" />
  </Bundle>
The help
element accepts the following attributes:
A customised Help menu for a user with the ADMINISTRATOR profile.
If you wish to hide some of the models available in Squore, you can use the hideModel
option to prevent some folders under the models folder in the configuration from being read by
Squore, as shown below.
<?xml version="1.0" encoding="utf-8" standalone="yes"?>
  <Bundle>
	<!-- Hidden models -->
	<hideModel name="ISO9126_Maintainability_Xaml" />
  </Bundle>
By default, Squore displays all versions of a project created with an earlier version of your model in orange.
The hideObsoleteModels
option allows disabling this behaviour, so that there is no warning
displayed for versions analysed with a different model.
<?xml version="1.0" encoding="utf-8" standalone="yes"?>
  <Bundle>
	<!-- Ignore model obsolescence
	        (do not highlight versions analysed with an obsolete model)
	        default=false -->
	<hideObsoleteModels value="true" />
  </Bundle>
If it does not makes sense to display a specific measure in the Indicator Tree or the Model Viewer, you can hide it by editing the Properties bundle of a model (since 13-B). This is useful to remove confusion about how a measure is computed.
In order to hide a measure:
Edit the model's Properties/Bundle.xml.
Add a <hideMeasure targetArtefactTypes="" path="" > element.
Fill in the artefact types for which this measure is hidden (this is optional).
Specify the complete path of the measure to be hidden.
Below is an example of two hidden paths. The first one is only hidden at application level. The second one is always hidden.
configuration/models/[ModelFolder]/Properties/Bundle.xml:
<bundle>
  <!-- Hidden measures -->
  <hideMeasure targetArtefactTypes="APPLICATION" path="I.MAINTAINABILITY/I.ANALYSABILITY/I.FUANA_IDX" />
  <hideMeasure path="I.MAINTAINABILITY/I.CHANGEABILITY/I.ROKR_CHAN/D.RKO_CHAN" />
</bundle>
Note that you should always use the precise notation path elements, with the I., B. or D. to avoid ambiguities.
You can define for each model the order that is used to sort items in the Action Items and Findings pages (since 13-B).
This is done by defining one or more scales and adding them to the Properties/Bundle.xml file using the
findingsTab
and actionItemsTab
options, as shown below:
configuration/models/[ModelFolder]/Properties/Bundle.xml:
<bundle>
  <!-- sort order for columns -->
  <findingsTab orderBy="SCALE_PRIORITY;SCALE_SEVERITY" />
  <actionItemsTab  orderBy="SCALE_REMEDIATION;SCALE_SEVERITY" />
</bundle>
You can define for each model the columns that should be hidden in the Action Items and Findings pages (since 15-A).
This is done by defining one or more scales and adding them to the Properties/Bundle.xml file using the
findingsTab
and actionItemsTab
options, as shown below:
configuration/models/[ModelFolder]/Properties/Bundle.xml:
<bundle>
  <!-- sort order for columns -->
  <findingsTab hideColumns="SCALE_PRIORITY;SCALE_SEVERITY" />
  <actionItemsTab hideColumns="SCALE_REMEDIATION;SCALE_SEVERITY" />
</bundle>
The Findings tab can be customised to provide extra filters based on indicators in your model. You can see the difference in the filters available on the Findings tab in the images below:
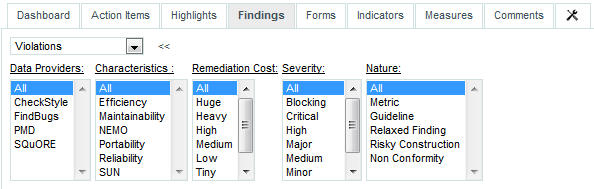
The default filters on the Findings tab
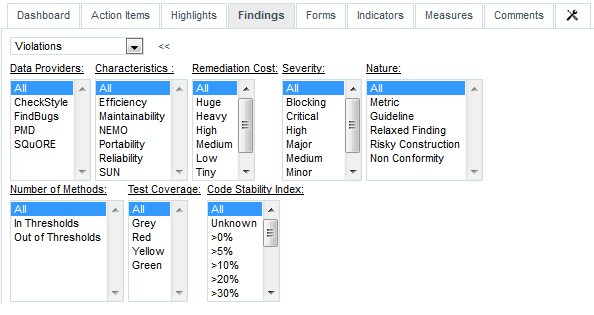
The Findings tab with advanced filters on the number of methods, test coverage and code stability index indicators
In order to configure the indicators that are used in the advanced filters, customise the Properties bundle for your model, as shown below:
configuration/models/[ModelFolder]/Properties/Bundle.xml:
<bundle>
  <!-- Advanced Filtering -->
  <findingsTab artefactFilters="I.NOM;I.TEST_COVERAGE;I.SI" />
</bundle>
Squore uses a menus folder in its configuration so you can add functionality that will
be available in the user interface to run external tools (since 14-A). These external scripts are launched in Squore Server's context, and can
therefore benefit from Squore's authentication and permission mechanism. They are launched from the web interface via a Tools menu visible to the users whose profile grants access to the Use External Tools feature.
Each external tool is defined within its own sub-folder in menus and appears as a link in
the main Squore toolbar, as shown below:
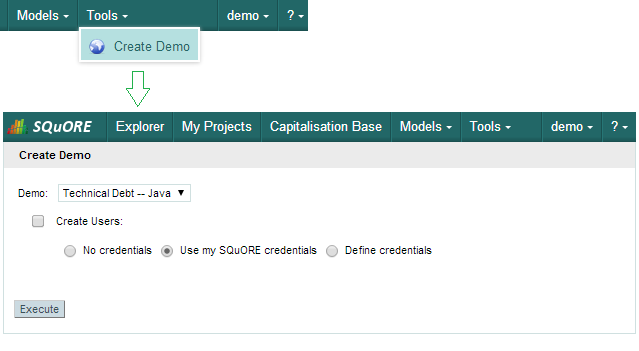
A Tools menu containing an external tool to create a demo environment, and the associated page to configure and launch the script.
The menu in the image above was added using the following form.xml:
<INSTALLDIR>/configuration/menus/CreateDemo/form.xml:
<?xml version="1.0" encoding="UTF-8"?>
<tags name="Create Demo" baseName="CreateDemo" multiUsers="false" users="demo;admin" image="earth.png">
	<tag type="multipleChoice" changeable="true" displayType="comboBox" name="Demo:" key="demo" defaultValue="TD_JAVA" >
		<value key="ISO9126" name="ISO9126 -- C" />
		<value key="RISK" name="Risk Index -- C" />
		<value key="RISK" name="Risk Index -- Java" />
		<value key="TD" name="Technical Debt -- Java" />
	</tag>
	<tag type="booleanChoice" changeable="true" name="Create Users:" key="create_users" defaultValue="false"/>
	<tag type="multipleChoice" changeable="true" displayType="radioButton" name="" key="useAccountCredentials"
		defaultValue="USE_ACCOUNT_CREDENTIALS" credentialType="USE_ACCOUNT_CREDENTIALS">
		<value key="NO_CREDENTIALS" name="No credentials" />
		<value key="USE_ACCOUNT_CREDENTIALS" name="Use my SQuORE credentials" />
		<value key="PERSONAL_CREDENTIALS" name="Define credentials" />
	</tag>
	<tag type="text" changeable="true" name="Username: " key="username" defaultValue="" credentialType="LOGIN" />
	<tag type="password" changeable="true" name="Password: " key="password" defaultValue="" credentialType="PASSWORD" />
</tags>
The tags
element accepts the following attributes:
name: The name of the menu item displayed in Squore's web interface
baseName: The name of folder in Squore's addons folder that contains the executable tcl script
multiUsers: If true, only one running instance of the tool is allowed per user. If false, only one running instance at a time is allowed for the entire Squore Server.
users: a semicolon-separated list of user logins. If specified, this attribute limits the availability of the menu to the users explicitly listed.
groups: a semicolon-separated list of user groups. If specified, this attribute limits the availability of the menu to users belonging to the groups explicitly listed.
You can then add a series of tag
elements that follow the same specification as the one described in the section called “Attributes” to use as parameters on your custom page, with two extra types available:
type="decoration" allows you to display an image followed by some text:
<tag type="decoration" image="custom-logo.png" style="width:500px">
	This is the text that will be displayed next to the image.
	</tag>
required="true|false" (optional, default value: false) allows marking the field as required, which displays a red asterisk next to the field label.
type="file" allows you choose a file to upload to the server:
<tag type="file" changeable="true" name="Upload this file: "
    key="file" defaultValue="" acceptedTypes="xls,xlsx"/>
The file is immediately uploaded on the server, and the TCL variable matching the specified key ($file
in the example above) is set to the absolute path of the uploaded file.
Consider the security implications of letting users upload arbitrary files to the server running Squore before using the file upload functionality.
The following variables are injected in the script execute.tcl before execution:
outputDir: The directory associated with the menu.
tmpDir: The temporary directory associated with the menu
toolName: The name of the directory of the menu
toolBaseName: The name of the directory of the addons part of the menu
toolDir: The directory where the addons part of the menu can be found
toolkitDir: The directory where the Squore toolkit tcl scripts can be found
logFile: The name of the log file to use for displaying information
Table of Contents
This section links to other documents or resources that may be of interest.
Installation and Administration Guide
Getting Started Guide
Reference Manual
For more information on software engineering methods and metrics, you may check:
Jasper Reports home: jasperforge.org
iReport home: jasperforge.org/projects/ireport.
Reference Manual
Table of Contents
sqexport.pl — Squore export utility
sqexport.pl [
option
...]
users
[
-r
]
sqexport.pl [
option
...]
groups
[
-m
]
sqexport.pl [
option
...]
versions
-m
[
-l
] [
-u
]
id_user
id_model
sqexport.pl [
option
...]
versions
-p
[
-l
] [
-u
]
id_user
id_project
sqexport.pl [
option
...]
artefacts
-m
[
-R
] [
--add-measure
...] [
measure
-T
...] [
type
-L
] [
level
-u
]
id_user
id_model
sqexport.pl [
option
...]
artefacts
-p
[
-R
|
-r
] [
id_rvers
--add-measure
...] [
measure
-T
...] [
type
-L
] [
level
-u
]
id_user
id_project
[
id_vers
]
sqexport.pl [
option
...]
findings
-m
[
-M
...] [
measure
-u
]
id_user
id_model
sqexport.pl [
option
...]
findings
-p
[
-c
[
-R
|
-r
]] [
id_rvers
-M
...] [
measure
-u
]
id_user
id_project
[
id_vers
]
sqexport.pl [
option
...]
findings
-a
[
-c
] [
-r
]
id_rvers
id_art
id_vers
The sqexport.pl script connects to the Squore database and exports data into the CSV format.
This command extracts raw data from the database. That is, it does not read i18n files or model properties to translate strings.
Columns common to the
versions
,
artefacts
,
findings
exports are:
model_id - the database identifier of the model (verbose mode only).
model - the model name.
app_id - the database identifier of the project (verbose mode only).
app_name - the project name.
root_id - the database identifier of the root artefact (verbose mode only).
v_id - the database identifier of the version (verbose mode only).
v_name - the version name.
These columns are exported:
uid - the database identifier of the user (verbose mode only).
login - the login of the user.
sqexport.pl
users
[
-r
]
This command exports all user information for all Squore users. The output contains these additional columns:
fullname - the full name of the user.
email - the e-mail of the user.
password - the SHA-1 of the user password, base 64 encoded.
department - the department of the user.
When the -r option is specified, the user profiles are
exported instead. The output contains these additional columns:
role_id - the database identifier of the profile (verbose mode only).
role - the profile name of the user.
These columns are exported:
gid - the database identifier of the group (verbose mode only).
group - the name of the group.
sqexport.pl
groups
[
-m
]
This command exports all Squore groups.
When the -m option is used, group members are exported
instead. Here are the additional columns in this mode:
uid - the database identifier of the group member (verbose mode only).
login - the login of the group member.
These additional columns are exported:
status - the project's version status.
sl_rank - the (numeric) rank of the level of the project.
level - the level of the project.
app_name - The project name.
sqexport.pl
versions
-m
[
-l
] [
-u
]
id_user
id_model
This form exports all versions of projects that use the model identified
by id_model. If -l is used, only the
last version of each project is exported.
The id_user is used to restrict output data,
using access controls defined in Squore. If not supplied, versions and
projects are exported regardless of access control lists.
sqexport.pl
versions
-p
[
-l
] [
-u
]
id_user
id_project
This form exports all versions of the project identified by
id_project. If -l is used, only
the last version of the project is exported.
The id_user is used to restrict output data,
using access controls defined in Squore. If not supplied, versions and
projects are exported regardless of access control lists.
These additional columns are exported:
art_id - the database identifier of the artefact.
art_path - the path of the artefact.
art_name - the name of the artefact.
type - the type of the artefact.
sl_rank - the (numeric) rank of the level of the artefact.
level - the level of the artefact.
trend - the trend of the artefact, compared to
the reference version (with -R or -r
only). Values are 'N' for new artefacts, '^' for artefacts that improved,
'v' for artefacts that regressed, and '=' for others.
* - the measure values, as specified with
the --add-measure options.
sqexport.pl
artefacts
-m
[
-R
] [
--add-measure
...] [
measure
-T
...] [
type
-L
] [
level
-u
]
id_user
id_model
Exports all artefacts of the id_model model,
eventually filtered out by the -T and -L
filters. Both parameters of these options are identifiers of the types and
the level, as specified in the model. This is possible to specify types
separated by a comma, or multiple -T options. Such types
are then OR-ed.
Only artefacts that belong to the last version of projects are exported.
If the -R option is set, the trend of levels of artefacts is
computed against the last but one version of the projects. By default, there
is no trend computation.
Use the --add-measure option to specify the list of measures
to add to the output. Use with caution on large result sets.
The id_user is used to restrict output data,
using access controls defined in Squore. If not supplied, artefacts are
exported, regardless of access control lists.
sqexport.pl
artefacts
-p
[
-R
|
-r
] [
id_rvers
--add-measure
...] [
measure
-T
...] [
type
-L
] [
level
-u
]
id_user
id_project
[
id_vers
]
This form exports artefacts of the id_project project
in its id_vers version. If id_vers
is not specified, the last version if the project is used. Artefacts may be
filtered out with the -T and
type
-L options.level
The reference version to compute trends of levels of artefacts is either set
with -R (use the version right before id_vers),
or with -r to set an explicit
version of the project.id_rvers
Use the --add-measure option to specify the list of measures
to add to the output. Use with caution on large result sets.
The id_user is used to restrict output data,
using access controls defined in Squore. If not supplied, artefacts are
exported, regardless of access control lists.
These additional columns are exported:
measure_id - the database identifier of the measure (verbose mode only).
measure - the external identifier of the measure.
tool - the tool name that produced the measure.
finding_id - the database identifier of the finding.
art_id - the database identifier of the artefact.
art_path - the path of the artefact.
art_name - the name of the artefact.
art_location - the location of the finding, within the artefact.
In counting mode (see -c option), these columns
are exported instead:
measure_id - the database identifier of the measure (verbose mode only).
measure - the external identifier of the measure.
tool - the tool name that produced the measure.
count - the number of findings in the
id_vers version.
delta - the variation of findings from
id_rvers to id_vers (with
-c only).
* - there is one additional column per scale in the model for this measure.
sqexport.pl
findings
-m
[
-M
...] [
measure
-u
]
id_user
id_model
This form exports all findings found in the model identified by
id_model, using the last version of each project.
One line is exported per localisation of findings (that is, there is one line per cloned artefact, for example). Use the finding_id, which is unique per finding, to identity multiple localisations.
Use the -M option to
filter findings per rule. Multiple rules are OR-ed.measure
The id_user is used to restrict output data,
using access controls defined in Squore. If not supplied, findings are
exported, regardless of access control lists.
sqexport.pl
findings
-p
[
-c
[
-R
|
-r
]] [
id_rvers
-M
...] [
measure
-u
]
id_user
id_project
[
id_vers
]
This form exports findings of the project identified by
id_project found in the id_vers
version. If id_vers is not supplied, the last version
of the project is used.
Use the -M option to
filter findings per rule. Multiple rules are OR-ed.measure
The -c option turns on findings counting (grouped by
the measure id).
Delta computation can be turned on with either the -R to
use the version right before id_vers, or with the
-r option to explicitly
set the reference version. Available in counting mode only. id_rvers
The id_user is used to restrict output data,
using access controls defined in Squore. If not supplied, findings are
exported, regardless of access control lists.
sqexport.pl
findings
-a
[
-c
] [
-r
]
id_rvers
id_art
id_vers
Exports findings of the id_art artefact, and all
its descendants, that exist in the id_vers version.
The -c option is currently mandatory, and turns on counting
(there is no full listing of findings so far).
If -r is set, delta are computed against the
id_rvers version. There is no delta
computing by default.
These options are common to all export types.
-h host
Overrides the database host name.
-p port
Overrides the database port number.
-d dbname
Overrides the database name.
-u user
Overrides the database user name.
-f file
Set the CSV output file. If not specified, the output is written to the standard output.
-s sep
Set the CSV separator. Defaults to the ';' character.
-S slices
Specifies a subset of columns to write, starting from 0. The column numbering is computed against the verbose mode, not the standard mode. Separate column numbers with the ',' character.
-v
Turns on the verbose mode. Exports additional columns (mainly internal database ids), and displays some SQL and post processing timings.
-a
Turns on export at the artefact level.
-m
Turns on export at the model level.
-p
Turns on export at the project level.
-c
Counts entries only, do not list all of them.
-l
Exports the last version of each project only.
-R
Set the reference version for delta or trend computations to the last but one version of the project, from either its last version, or the user supplied version.
-r id_rvers
Set the reference version for delta or trend computations to
the version pointed to by the id_rvers.
-T type
...
Filter artefacts of types type, which is
the external id of the artefact type, as specified by the model,
like APPLICATION, CLASS, FUNCTION, etc. Types may be coma separated.
-L level
Artefacts shall have the level level,
which is the external id of the level of performance of a scale, as
specified by the model, like LEVELA, LEVELB, etc.