| > Show on single page > Show on multiple pages |
The Optimised Pie chart is a pie chart that takes several measure as input. It simply displays a pie chart with the values previously computed.
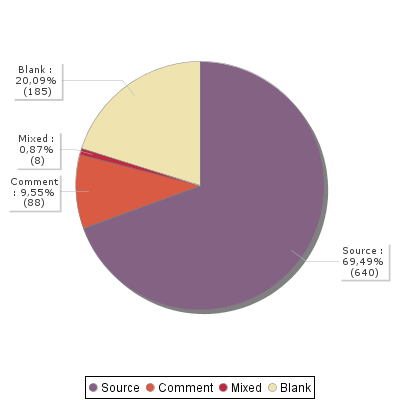
Optimised Pie Chart
<chart type="OptimizedPie"
		id="OPTIMIZED_PIE_ID"
		decimals="2">
   <measure label="Source">SLOC_ONLY</measure>
   <measure label="Comment">CLOC_ONLY</measure>
   <measure label="Mixed">MLOC</measure>
   <measure color="239,228,176" label="Blank">BLAN</measure>
</chart>
The Optimised Pie uses the
decimals
attribute to decide how many decimal places to display in the labels and a minimum of two measure
elements.
The Optimised Bar chart is a bar chart that takes several measure as input. It simply displays a bar chart with the values previously computed.
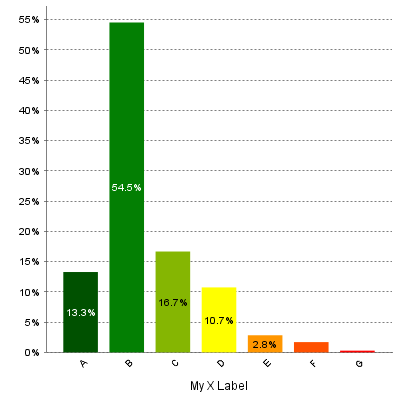
Optimised Bar Chart
<chart type="OptimizedBar"
		id="OPTIMIZED_BAR_ID"
		asPercentage="true">
          <measure color="0,81,0" label="A">A_FILE</measure>
          <measure color="3,127,3" label="B">B_FILE</measure>
          <measure color="133,182,2" label="C">C_FILE</measure>
          <measure color="255,255,0" label="D">D_FILE</measure>
          <measure color="255,150,0" label="E">E_FILE</measure>
          <measure color="255,80,0" label="F">F_FILE</measure>
          <measure color="255,0,0" label="G">G_FILE</measure>
</chart>
The Optimised Bar uses the
decimals
attribute to decide how many decimal places to display in the labels and the
asPercentage
to specify whether the values are displayed as real values or percentages.
It requires a minimum of two measure
elements.
This special chart is used to represent the level of the selected artefact in reference to an indicator.
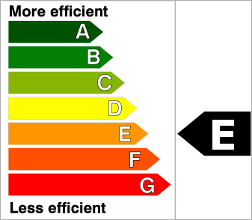
Key Performance Indicator
The following is an example of the syntax used for defining a KPI chart:
<chart type="KPI" id="KEY_PERFORMANCE_INDICATOR"
indicatorId="MAINTAINABILITY" />
The following attributes are allowed for
the KPI
chart
tag:
indicatorId
is the reference to an
Indicator. See
the section called “Descriptions”
for more information about the
indicatorId
.
The Dial chart represents the value of the measure associated
to an indicator against a backdrop of the scale associated to this indicator. The Dial chart requires one
indicator
as a sub-element.
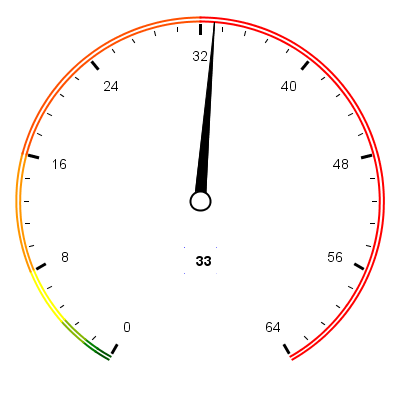
Dial Chart
<chart type="Dial" id="DIAL_LINEAR_ID"
				decimals="0"
				majorTickIncrement="8"
				minorTickCount="4">
  <indicator>VALUE_LINEAR</indicator>
</chart>
The Dial
chart
element may have the following attributes:
The majorTickIncrement
and minorTickCount
parameters only need to
be used if you want to completely control the appearance of the chart. Generally,
they can be omitted, as the defaults should be smart enough to show what you need.
You can control the bounds of the axis of this chart using the datBounds attributs on each metric,
as explained in the section called “Common Attributes for measure and indicator
”.
The indicator
element supports excluding
certain levels from the chart by using the
excludeLevels
attribute. For
example:
<indicator excludeLevels="LEVELA;LEVELB">LEVEL</indicator>
The Meter chart represents the value of the measure associated to an indicator against a backdrop of the scale associated to this indicator.
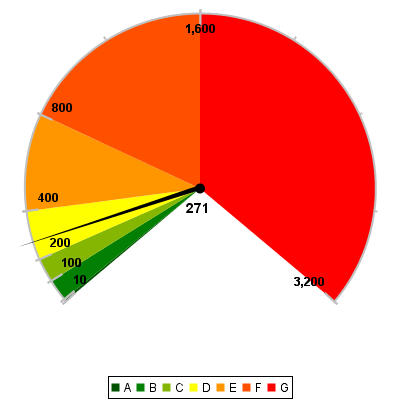
Meter Chart
<chart type="Meter" id="METER_ID"
				decimals="0"
				majorTickIncrement="400">
  <indicator>VALUE_LINEAR</indicator>
</chart>
The Meter
chart
element may have the following attributes:
The Meter chart takes only one
indicator
as a sub-element.
You can control the bounds of the axis of this chart using the datBounds attributs on each metric,
as explained in the section called “Common Attributes for measure and indicator
”.
The indicator
element supports excluding
certain levels from the chart by using the
excludeLevels
attribute. For
example:
<indicator excludeLevels="LEVELA;LEVELB">LEVEL</indicator>
The Kiviat chart displays three or more indicators in a radar-type chart.
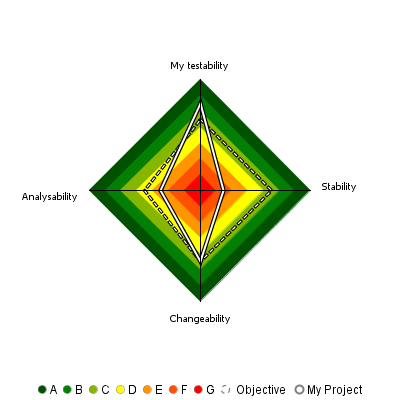
Kiviat Chart
The Kiviat chart takes a set of at least three indicators as sub-elements.
<chart type="Kiviat"
		id="KIVIAT_ID"
		isInverted="true">
	<indicator label="My testability"
	              objective="LEVELC">TESTABILITY</indicator>
	<indicator objective="LEVELC">STABILITY</indicator>
	<indicator objective="LEVELC">CHANGEABILITY</indicator>
	<indicator objective="LEVELD">ANALYSABILITY</indicator>
</chart>
The attributes allowed for the
chart
element are
the following:
The indicator
element accepts a specific, optional objective
attribute
that draws a dotted line at the specified level representing the objective line.
The objective attribute accepts:
A scale level (LEVELA)
An indicator ID (since 14-B) (TESTABILITY). In this case, both indicators must use the same scale.
A computation (since 14-B) (LC+100). The computed value is then used together with the scale of the indicator to define the level to display.
Note that only a scale level is accepted for Kiviat charts at analysis model level.
This chart represents the SQALE Pyramid, representing a minimum of two different measures or indicators as a matrix.
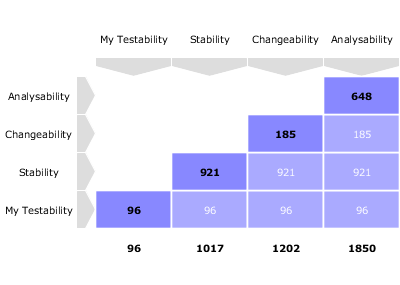
SQALE Pyramid Chart
<chart type="SQALEPyramid" id="MAINTAINABILITY_PYRAMID" decimals="0">
  <measure label="My Testability" >TESTABILITY</measure>
  <measure>STABILITY</measure>
  <measure>CHANGEABILITY</measure>
  <measure>ANALYSABILITY</measure>
</chart>
A typical Histogram that shows the repartition of a value for
the children
of the selected artefact It requires one measure
element.
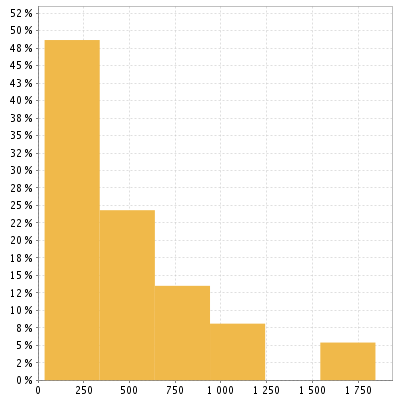
Histogram Chart
<chart type="Histogram" id="HISTOGRAM_ID" targetArtefactTypes="FILE"
  nbBars="10" >
  <measure color="242,205,57" >SUMLC</measure>
</chart>
The
chart
element may have the following attributes:
targetArtefactTypes
allows to filter descendants according to their type. You can use one or more types (since 14-A).
Concrete and abstract types are supported, so it is possible to use an alias, as described in the section called “Artefact Types”.
There are some limitations to what is supported:
Measures associated to an indicator must have the same measureId for all types and be of the same kind (base or derived)
For Stacked Bar Chart, Simple Temporal Evolution Stacked Bar Chart, Simple Pie and Simple Bar the scale associated to the indicator must be the same for be the same for all types
You can control the bounds of the axis of this chart using the datBounds attributs on each metric,
as explained in the section called “Common Attributes for measure and indicator
”.
The Y-Cloud chart is a visual representation of the values of a measure or indicator for the
children of the selected artefact. For each child of the requested type, a dot is drawn with the
value found for the selected measure. The chart requires one indicator
element.
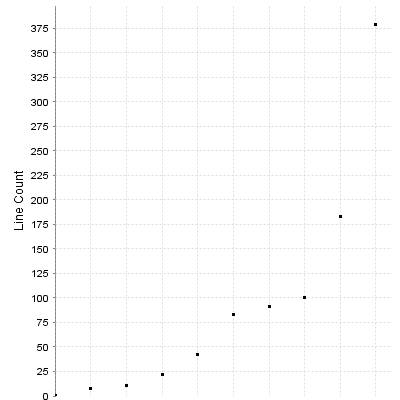
Y-Cloud Chart
<chart type="YCloud" id="CLOUD_ID"
  targetArtefactTypes="FILE">
  <indicator color="0,0,0" label="LC">LC</indicator>
</chart>
The
chart
element may have the following attributes:
targetArtefactTypes
allows to filter descendants according to their type. You can use one or more types (since 14-A).
Concrete and abstract types are supported, so it is possible to use an alias, as described in the section called “Artefact Types”.
There are some limitations to what is supported:
Measures associated to an indicator must have the same measureId for all types and be of the same kind (base or derived)
For Stacked Bar Chart, Simple Temporal Evolution Stacked Bar Chart, Simple Pie and Simple Bar the scale associated to the indicator must be the same for be the same for all types
The Treemap offers a graphical representation of child artefacts as
a set of tiled rectangles.
The Treemap requires one measure
to
define the size of the tiles and accepts a colorFromIndicator
attribute to pick the colors of the tiles. Clicking a tile takes you to the dashboard
of the corresponding artefact.
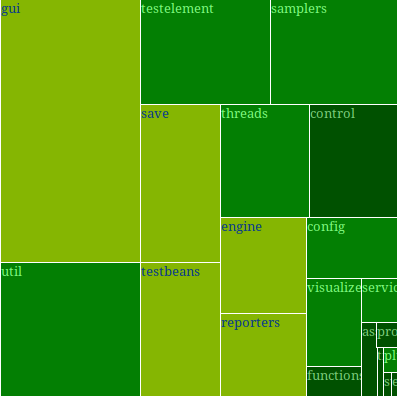
Treemap
<chart id="TREEMAP" type="TreeMap"
  colorFromIndicator="MAINTAINABILITY"
  onlyDirectChildren="false" targetArtefactTypes="FOLDER">
  <measure>SUMLC</measure>
</chart>
The chart
tag accepts the following attributes:
targetArtefactTypes
allows to filter descendants according to their type. You can use one or more types (since 14-A).
Concrete and abstract types are supported, so it is possible to use an alias, as described in the section called “Artefact Types”.
There are some limitations to what is supported:
Measures associated to an indicator must have the same measureId for all types and be of the same kind (base or derived)
For Stacked Bar Chart, Simple Temporal Evolution Stacked Bar Chart, Simple Pie and Simple Bar the scale associated to the indicator must be the same for be the same for all types
onlyDirectChildren
(optional, default: true) includes artefacts that are direct children of the current artefact
in the chart when set to true, or all descendants of the current artefact when set to false.
colorFromIndicator
(optional) uses an indicator's colour scale to assign a colour to each drawn tile.
defaultColor
(optional, default:RANDOM colour based on artefact name) uses an indicator's colour scale to assign a colour to each drawn tile.
The Artefact Pie offers a graphical representation of the values of a specific measure
for each child artefact in a pie chart.
The Artefact Pie requires one measure
to
define the size of the pie slice and accepts a colorFromIndicator
attribute to pick the colors of the pie slices based on a scale. Clicking a pie slice
takes you to the dashboard of the corresponding artefact.
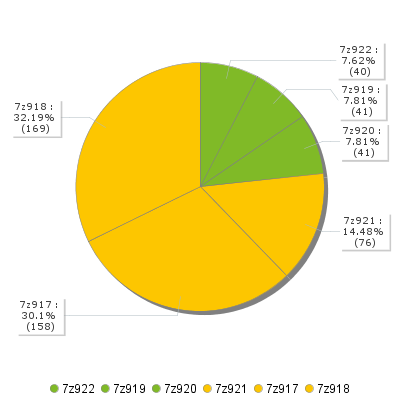
Artefact Pie
<chart id="ARTEFACT_PIE_FILE_DESCENDANTS" type="ArtefactPie"
  colorFromIndicator="MAINTAINABILITY"
  onlyDirectChildren="false" targetArtefactTypes="FILE">
  <measure>SUMLC</measure>
</chart>
The chart
tag accepts the following attributes:
targetArtefactTypes
allows to filter descendants according to their type. You can use one or more types (since 14-A).
Concrete and abstract types are supported, so it is possible to use an alias, as described in the section called “Artefact Types”.
There are some limitations to what is supported:
Measures associated to an indicator must have the same measureId for all types and be of the same kind (base or derived)
For Stacked Bar Chart, Simple Temporal Evolution Stacked Bar Chart, Simple Pie and Simple Bar the scale associated to the indicator must be the same for be the same for all types
onlyDirectChildren
(optional, default: true) includes artefacts that are direct children of the current artefact
in the chart when set to true, or all descendants of the current artefact when set to false.
colorFromIndicator
(optional) uses an indicator's colour scale to assign a colour to each drawn pie slice.
The X/Y-Cloud chart is a visual representation of the values of two measures or indicators for the children of the selected artefact. For each child of the requested type, a dot is drawn with the value found for the selected measure.
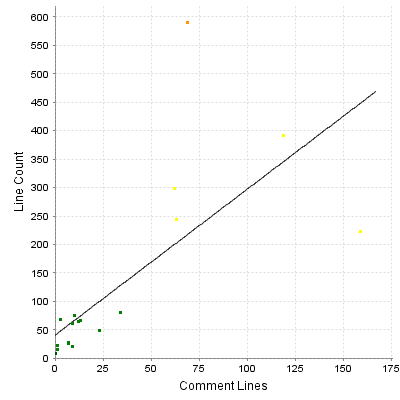
X/Y-Cloud Chart
<chart type="XYCloud" id="XYCLOUD_ID"
  targetArtefactTypes="FILE" colorFromIndicator="COMPLEXITY"
  showPolynomialRegression="true" coeff="1">
  <xmeasure label="Comment Lines">CLOC</xmeasure>
  <ymeasure label="Line Count">LC</ymeasure>
</chart>
The
chart
element may have the following attributes:
targetArtefactTypes
allows to filter descendants according to their type. You can use one or more types (since 14-A).
Concrete and abstract types are supported, so it is possible to use an alias, as described in the section called “Artefact Types”.
There are some limitations to what is supported:
Measures associated to an indicator must have the same measureId for all types and be of the same kind (base or derived)
For Stacked Bar Chart, Simple Temporal Evolution Stacked Bar Chart, Simple Pie and Simple Bar the scale associated to the indicator must be the same for be the same for all types
showPolynomialRegression (optional, default: true) (since 14-A)
Whether the polynomial regression is drawn (true) or not drawn (false) on the chart.
coeff
the degree of the drawn polynomial. Supported values are 1 (linear), 2 (quadratic) and 3 (cubic).
colorFromIndicator (optional)
sets the colour of the dot to the colour of the level of the specified indicator (since 13-B).
The chart takes one xmeasure
element
and one ymeasure
with the following attributes.
The Quadrant chart displays information about the descendants of the current artefact. Three measures are required to construct the chart: one for the X-axis, one for the Y-axis one for the size of the bubbles. The chart also allows to set markers to define coloured areas.
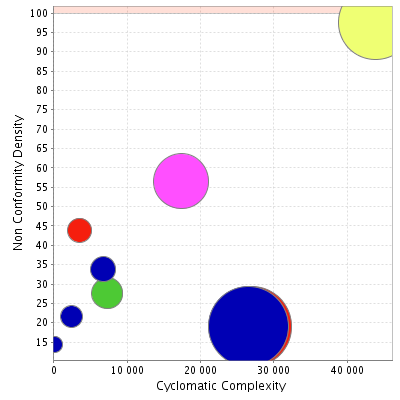
Quadrant Chart
<chart type="quadrant"
 id="NON_CONFORMITY_DENSITY_VS_COMPLEXITY"
 targetArtefactTypes="FILE"
 xMin="0" xMax="50000"
 yMin="0" yMax="100"
 onlyDirectChildren="false" >
  <xmeasure color=>SUMVG</xmeasure>
  <ymeasure>NCD</ymeasure>
 <zmeasure>FUNC</zmeasure>
  <markers>
    <marker value="100" color="255,50,0"
     alpha="50" isVertical="false" />
    <marker value="100" color="255,50,0"
     alpha="50" isVertical="true" />
  </markers>
</chart>
The
chart
element may have the following attributes:
targetArtefactTypes
allows to filter descendants according to their type. You can use one or more types (since 14-A).
Concrete and abstract types are supported, so it is possible to use an alias, as described in the section called “Artefact Types”.
There are some limitations to what is supported:
Measures associated to an indicator must have the same measureId for all types and be of the same kind (base or derived)
For Stacked Bar Chart, Simple Temporal Evolution Stacked Bar Chart, Simple Pie and Simple Bar the scale associated to the indicator must be the same for be the same for all types
onlyDirectChildren
(optional, default: true) includes artefacts that are direct children of the current artefact
in the chart when set to true, or all descendants of the current artefact when set to false.
colorFromIndicator (optional)
sets the colour of the bubble to the colour of the level of the specified indicator (since 13-B).
The Simple Pie chart presents the aggregation of the different ratings found in all the children of the selected artefact.
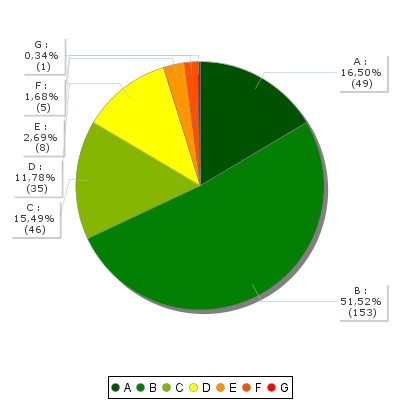
Simple Pie Chart
<chart type="SimplePie" id="SIMPLE_PIE_ID"
  targetArtefactTypes="FILE" decimals="2">
  <indicator>LEVEL</indicator>
</chart>
The Simple Pie
chart
element may have the following attributes:
targetArtefactTypes
allows to filter descendants according to their type. You can use one or more types (since 14-A).
Concrete and abstract types are supported, so it is possible to use an alias, as described in the section called “Artefact Types”.
There are some limitations to what is supported:
Measures associated to an indicator must have the same measureId for all types and be of the same kind (base or derived)
For Stacked Bar Chart, Simple Temporal Evolution Stacked Bar Chart, Simple Pie and Simple Bar the scale associated to the indicator must be the same for be the same for all types
decimals
is the number of decimal places used to display the data.
The Simple Pie chart takes only one
indicator
or info
as a sub-element.
For more details about how to use textual information, refer to the section called “Using Textual Information From Artefacts”
The indicator
element supports excluding
certain levels from the chart by using the
excludeLevels
attribute. For
example:
<indicator excludeLevels="LEVELA;LEVELB">LEVEL</indicator>
Note: This chart is equivalent to using an Optimised Pie Chart with the definition shown below. The pie chart is optimised because the measures it uses have already been computed during the analysis and do not need to be calculated on the fly.
<chart type="OptimizedPie" decimals="2" >
	<measure color="0,81,0" label="A">A_FILE</measure>
	<measure color="3,127,3" label="B">B_FILE</measure>
	<measure color="133,182,2" label="C">C_FILE</measure>
	<measure color="255,255,0" label="D">D_FILE</measure>
	<measure color="255,150,0" label="E">E_FILE</measure>
	<measure color="255,80,0" label="F">F_FILE</measure>
	<measure color="255,0,0" label="G">G_FILE</measure>
</chart>
The Simple Bar chart presents the aggregation of the different ratings found in all the children of the selected artefact as a histogram.
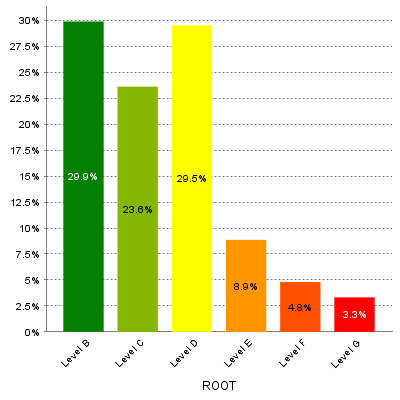
Simple Bar Chart
<chart type="SimpleBar" id="SIMPLE_BAR_ID"
  targetArtefactTypes="FILE" decimals="2">
  <indicator>LEVEL</indicator>
</chart>
The Simple Bar
chart
element may have the following attributes:
targetArtefactTypes
allows to filter descendants according to their type. You can use one or more types (since 14-A).
Concrete and abstract types are supported, so it is possible to use an alias, as described in the section called “Artefact Types”.
There are some limitations to what is supported:
Measures associated to an indicator must have the same measureId for all types and be of the same kind (base or derived)
For Stacked Bar Chart, Simple Temporal Evolution Stacked Bar Chart, Simple Pie and Simple Bar the scale associated to the indicator must be the same for be the same for all types
decimals
is the number of decimal places used to display the data.
asPercentage
(default: false) displays the values as percentages when set to true.
The Simple Bar chart takes only one
indicator
or info
as a sub-element.
For more details about how to use textual information, refer to the section called “Using Textual Information From Artefacts”
The indicator
element supports hiding or excluding
certain levels from the chart by using the hideLevels
excludeLevels
attribute. The difference between
hiding and excluding a level is that hidden levels are taken into account when displaying percentages while
excluded levels are not. For example:
<indicator excludeLevels="UNKNOWN">LEVEL</indicator>
or
<indicator hideLevels="LEVELA;LEVELB">LEVEL</indicator>
The Stacked Bar crosses the performance levels of two indicators for the children of the selected artefact along two axes.
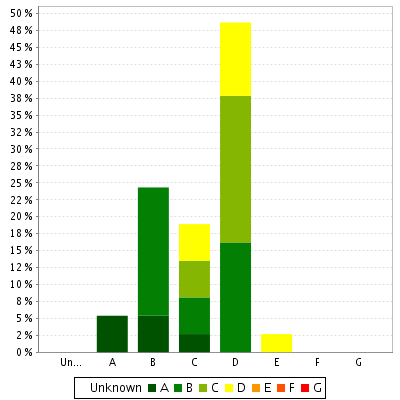
Stacked Bar chart
<chart type="StackedBar" id="STACKED_BAR_ID"
  targetArtefactTypes="FILE" >
  <indicator>TESTABILITY</indicator>
  <indicator>ANALISABILITY</indicator>
</chart>
The
chart
element may have the following attributes:
targetArtefactTypes
allows to filter descendants according to their type. You can use one or more types (since 14-A).
Concrete and abstract types are supported, so it is possible to use an alias, as described in the section called “Artefact Types”.
There are some limitations to what is supported:
Measures associated to an indicator must have the same measureId for all types and be of the same kind (base or derived)
For Stacked Bar Chart, Simple Temporal Evolution Stacked Bar Chart, Simple Pie and Simple Bar the scale associated to the indicator must be the same for be the same for all types
asPercentage
(default: false) displays the values as percentages when set to true.
The chart support two indicator
elements.
The indicator
element supports hiding or excluding
certain levels from the chart by using the hideLevels
excludeLevels
attribute. The difference between
hiding and excluding a level is that hidden levels are taken into account when displaying percentages while
excluded levels are not. For example:
<indicator excludeLevels="UNKNOWN">LEVEL</indicator>
or
<indicator hideLevels="LEVELA;LEVELB">LEVEL</indicator>