| > Show on single page > Show on multiple pages |
If you need more background information about the measures and indicators used in the charts and tables in the dashboard, the Indicators, Measures and Findings tabs can provide more details about the statistics recorded for the current artefact. Note that these tabs are not displayed by default. If you want to show them in Squore, click the Explorer Settings menu and then Manage Tabs to display the Tab Manager to enable these tabs, as shown below:
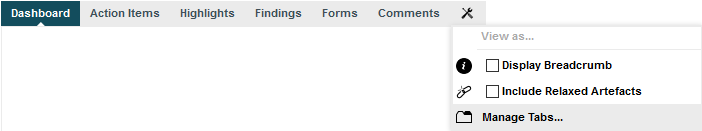
The Manage Tabs option in the Explorer Settings allows to display the Tab Manager
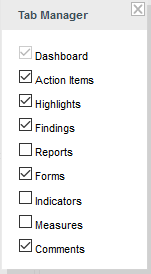
The Tab Manager allows to display tabs hidden by default by checking them. Note that not according to your configuration, some tabs may not be removeable
If you want to understand the scale used for a particular indicator, to see for example how close you are to moving up the rating scale, you can check the scale used for this indicator in the Indicators tab of the dashboard.
Log in and search for the artefact DB5_backup.c in the Neptune project, where the indicator Adherence to 'Analysability' Standards is rated D. While this tells you about the current rating for this artefact, this does not tell you how to improve it. In order to learn how to improve this score, let's first take a look at the scale used for this indicator. Click the Indicators tab of the Explorer. The table of indicators opens, as shown below:
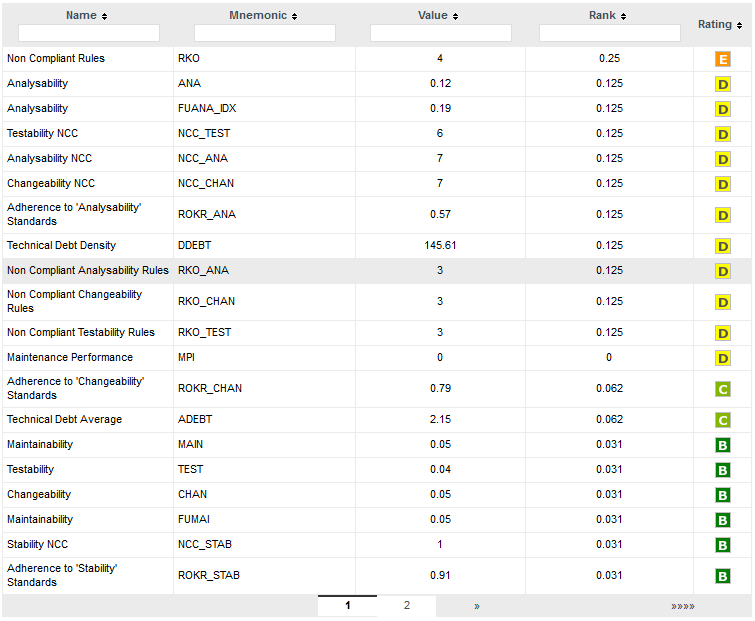
The indicators table for DB5_backup.c
The table lists all the indicators available for the artefact over several pages. The scale and levels available for an indicator can be viewed in a tooltip by placing your mouse over a rating. Using the filter above the "name" column, look for the entry named Adherence to 'Analysability' Standards, then click its value in the rating column. The scale for the indicator indicates that the artefact is rated D because the value of the indicator is 3. In order to improve the score, the value would need to decrease to under 2 to be rated C, as shown below:
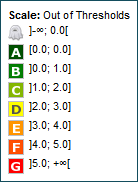
The scale used for rating Adherence to 'Analysability' Standards
To understand how to improve the rating, you need to know how the indicator's value is computed. Clicking the indicator name in the Indicator Tree shows the following explanation in the indicator popup:
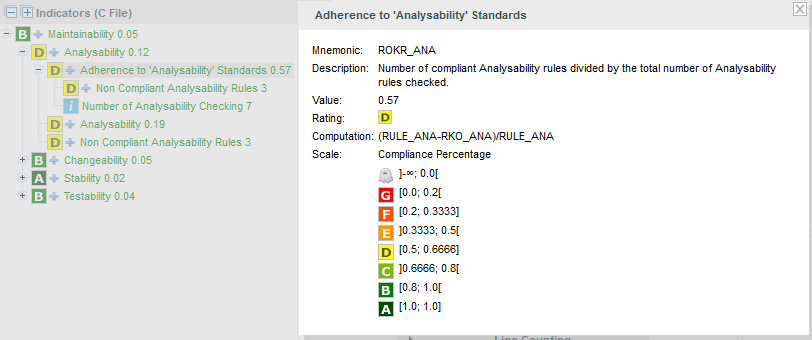
The indicator popup for the Adherence to 'Analysability' Standards indicator
The computation, i.e. the formula used to calculate the rating is
(RULE_ANA-RKO_ANA)/RULE_ANA, meaning that the indicator
is a ratio of the number of broken analysability rules.
To find out what these rules are, click the
Findings tab.
Squore displays all the findings for a particular artefact in a table in the Findings tab. Next to the finding's label is a number of occurrences followed by a colour-coded delta value (red for more occurrences, green for less) compared to a previous analysis.
If you want to find out which rules
are taken into account by the Adherence to 'Analysability' Standards indicator, click the
>> button next to the default filter to show the advanced filtering options. Highlight ANALYSABILITY
in the Characteristics filter to see the corresponding rules, as shown in the picture below:
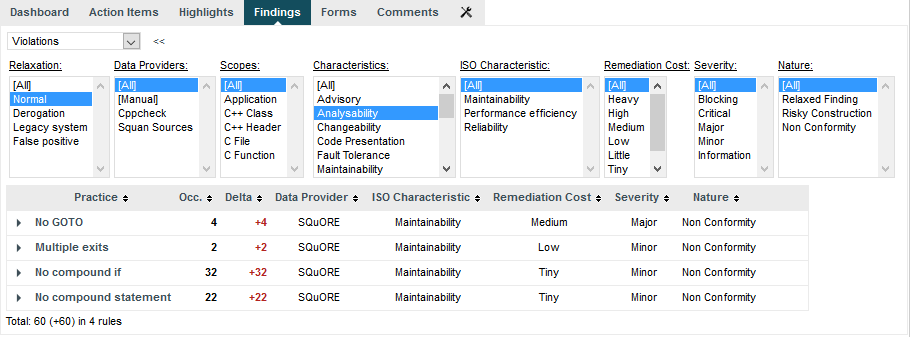
The findings table for DB5_backup.c
You can filter violations according to many criteria, including relaxation status, origin, artefact type and other characteristics from the analysis model
The rules No GOTO, Multiple exits and No compund if are the rules that should be fixed in order to improve the analysability rating of DB5_backup.c.
You can expand the No GOTO rule to show each occurrence of the rule being broken, and also review the location in the source code that breaks the rule, as shown below:
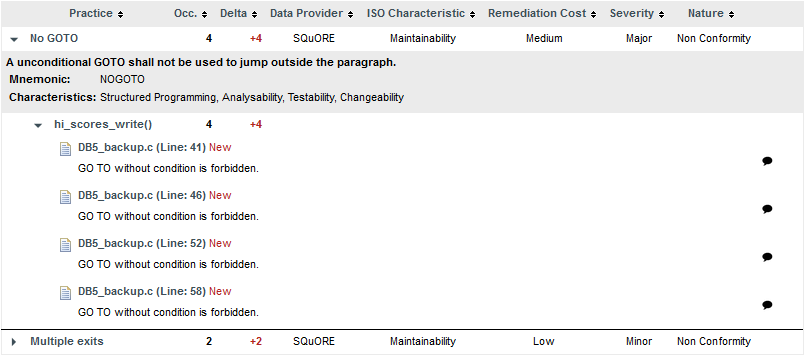
The location of the broken occurrences of the No GOTO rule
The list of findings indicates if a finding is New, Closed or Modified since the reference version. Findings are traceable through time, so even if your code is modified, you can to go back to the version in which it was first detected.
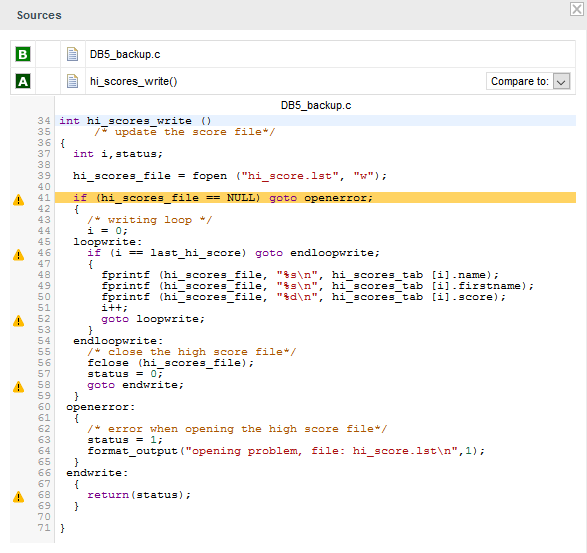
Finally, clicking on the line number for each rule breaking occurrence opens the source code viewer in full screen so you can carry out your code review:
The source code viewer allows comparing the code against another version of the code. Select a version name in the Compare to: list to switch to diff mode, as shown below:
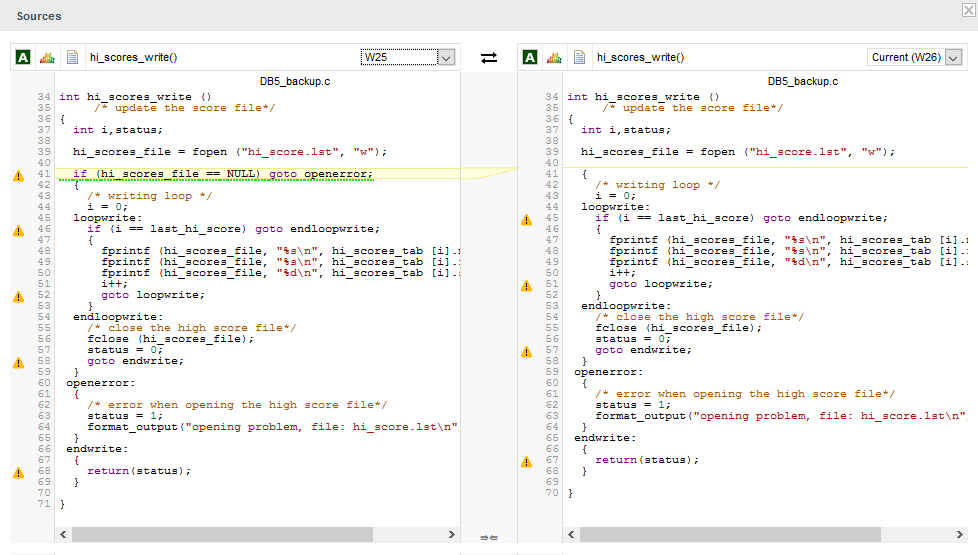
The source code viewer in diff mode
In diff mode, use the top arrows to switch the left and right panes, and the bottom arrows to turn synchronised scrolling on or off. Characters that were removed are underlined in green, while characters that were added are underlined in red.
Analysing findings helps improving the quality of the code in your project. There is much more you can do with the Findings tab by using the built-in filters to detect regressions and improvements:
Violations: displays all the rules violated in this version
Lost Practices: displays violations that are new in this version since a specified version
Acquired Practices: displays all violations not occurring anymore in this version since a previous version
Deteriorated Practices: displays all violations with more occurrences in this version than in a previous version
Improved Practices: displays all violations with less occurrences in this version than in a previous version
New violations: displays all the new violations since a previous version
Fixed violations: displays all the violations fixed since a previous version
All changed violations: displays all the rules where a change in the number of violations was detected, essentially providing the combination of New violations and Fixed violations in one list
All rules: displays all the rules checked by the model, i.e. the violated ones as well as the ones that are not
By default, the Findings tab displays violations compared to the previous analysis, but you can refine the search by adjusting the Reference drop-down list (under the Explorer Settings menu) that contains all the versions analysed in your project.
You can learn about more automated ways to review and fix code in the section called “How Do I Review And Manage Action Items Flagged by Squore?”.
You can click the Export button at the bottom of the list of findings, to generate a CSV file of the findings displayed in the user interface. The contents of the file reflect your current filter selections on the page. The following is a CSV export for the Findings of the Earth project, which you can download in full here.
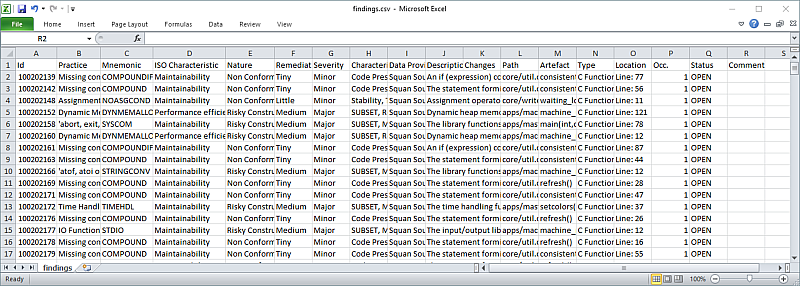
A CSV export of the findings of the Earth project
If the Export button is greyed out, your licence does not include the option to export data to CSV files.