| > Show on single page > Show on multiple pages |
Squore provides tools to understand, verify and enhance your model under the Models menu.
The Viewer, a graphical representation of all the analysis models on Squore Server
The Validator, a debug tool for model writers
The Dashboard Editor, which allows customising the dashboards that all users will see
The Analysis Model Editor, which allows modifying the model's ruleset
Users whose profile grants the "View Models" permission have access to the first two tools.
Users whose profile grants the "Modify Models" permission have access to the last two tools.
To use the Viewer:
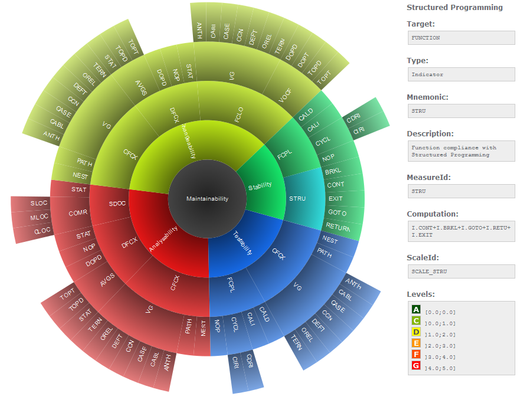
Upon selecting the parameters above, the page is refreshed with the top-level indicators in the model, and you can click each indicator to unveil sub-indicators and their characteristics. You can drag the tree left and right to reveal all sub-levels if necessary. For each indicator selected, Squore displays the following information:
Target is the target artefact type for the selected item
Type is the type of the selected item
Mnemonic is the short code for the selected item
description is the description of the selected item
Data Provider is the Data Provider responsible for computing the selected item
MeasureId is the measure ID of the selected item
Computation is the formula used to compute the value of the selected item
ScaleId is ID of the scale associated with the selected item
Levels is the list of levels available for the selected item and their ranges
Note: The information available depends on the type of item selected.
If your work involves adjusting the model's metrics or dashboard, you can use the Validator to verify its integrity during as you make changes. Click Models > Validator to display the diagnostics organised by category, as shown below:
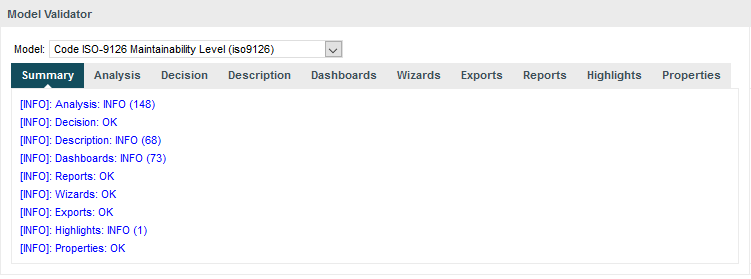
The iso9126 model in the Validator
The Summary tab displays a summary of all the diagnostics run for each category. By clicking any of the other tabs, more details are shown about potential problems found in your model. You can also show the complete XML of the model to understand the errors reported. The XML can be searched by using the Ctrl+F key combination to bring up the search dialogue, and then Ctrl+G to search for the next occurrence of the search term:
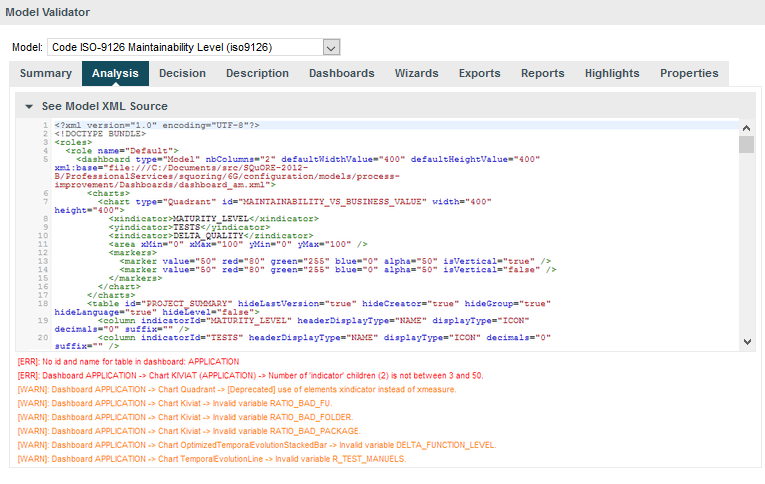
The Validator reporting errors
Your Squore administrator can help you get more information model development. You can also refer to the Squore Configuration Guide for a complete reference.
The Dashboard Editor is a graphical editor for the dashboards of a particular model. Dashboards consist of a key performance indicator, a list of tables and one or more columns of predefined charts. With the Dashboard Editor, you can rearrange the information shown on the dashboard for all users, or create a completely new dashboard for a new role in your project.
In order to use the Dashboard Editor:
Click Models > Dashboard Editor
Select a model and load an existing dashboard
The current dashboard skeleton is loaded in the editor, as shown below:
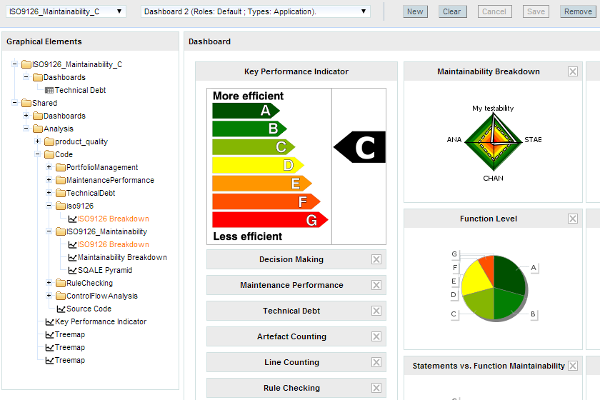
The iso9126 model in the Dashboard Editor
The tree contains the list of pre-configured graphical elements that you can add to your current dashboard. When you hover over a dashboard element, a tooltip explains what metrics it displays. You can drag and drop an element over an existing chart on the current dashboard, drag charts and tables to rearrange them. When you are satisfied with your changes, you can save your modifications. You can also create a new dashboard, using an existing one as a basis for the new one, or start from a blank canvas.
In the tree, graphical elements are colour-coded so that you know before you add them to your dashboard if they are compatible with your model. Blue elements have minor incompatibilities with your current model and orange elements are likely not compatible. Use the tooltip for an element to understand why the element is flagged as incompatible.
More detailed explanations about the Dashboard Editor can be found in the Squore online help.
The Analysis Model Editor is a graphical ruleset editor where you can turn rules on and off, or adjust the categories associated to each rule in your model.
It also allows you to save ruleset templates so that you can use a different set of rules for each project you create
In order to use the Analysis Model Editor:
Click Models > Analysis Model Editor
Select a model to load its ruleset
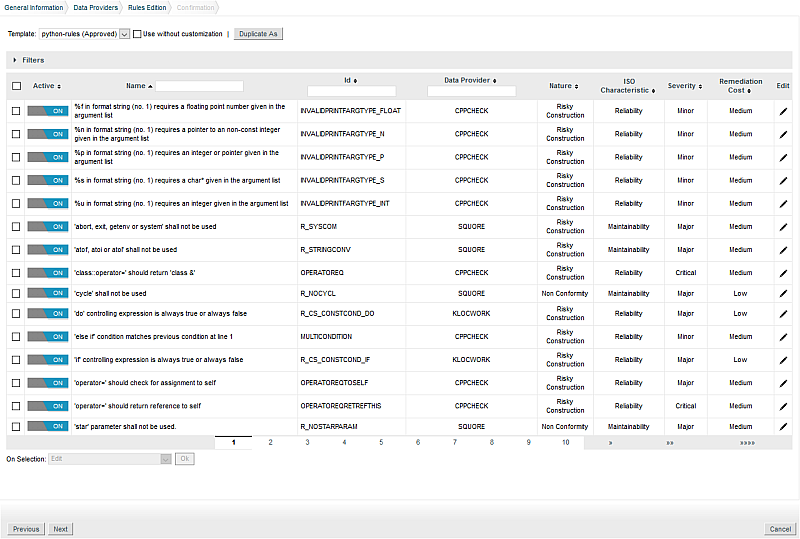
The entire ruleset for the current model is displayed in table form, as shown below:
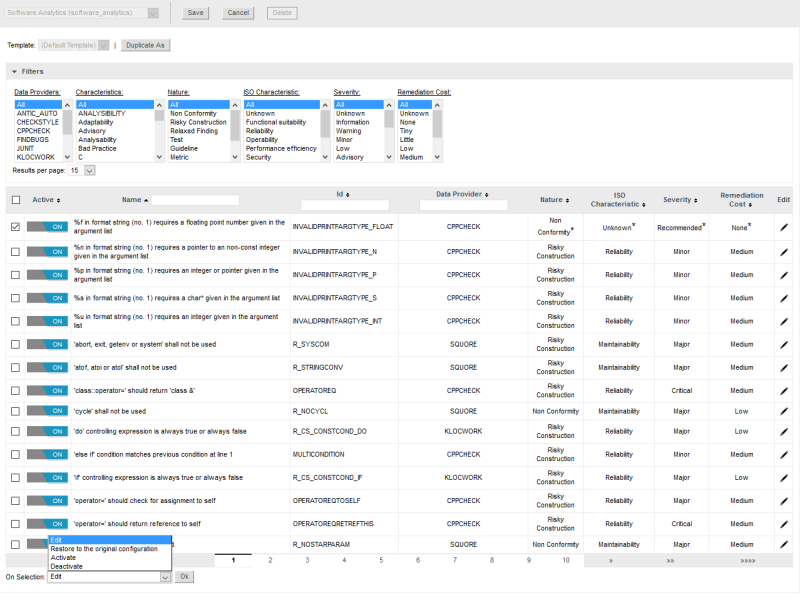
The Analysis Model Editor displaying the ruleset of the Squore Risk Index model
Use the filter pane and the table headers to find the rule you want to modify. You can activate or deactivate a rule by clicking the on/off switch in the table. If you want to make more modifications, cick the Edit icon for this rule.
You can edit multiple rules at once by checking several rules and using the actions list at the bottom of the page. When you save your changes, the configuration is reloaded and every new analysis for this model will use the new settings.
Changes made in the web interface are saved in the configuration folder on the server in a file called editor.xml.
Using the Analysis Model Editor, you can set up various ruleset templates to modify or ignore rules that do not apply for certain departments or project teams within your organisation.
Users with model edition privileges (see the Modify Models permission in the section called “User Profiles”) can define templates right from the Analysis Model Editor. Project managers can decide to modify existing templates or create new ones from the project wizard. In order to ensure that projects are analysed using company-wide standards, templates can be marked as approved, which prevents them from being modified by project managers.
In order to create a ruleset template:
Click on Models > Analysis Model Editor
Select an analysis model and locate the Template selection list above the filter tools. For a model where no templates exist yet, only the Duplicate As button is available so can can create a new template from the default one.
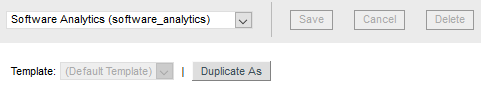
The ruleset template tools for a model with no custom templates yet
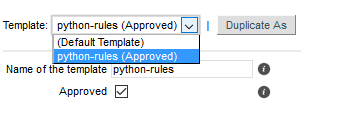
Click Duplicate As to create a new template and enter edit mode. In this example, we are creating a ruleset that contains only rules that apply to the Python programming language. By checking the Approved box, we are defining this ruleset template as read-only for project managers.
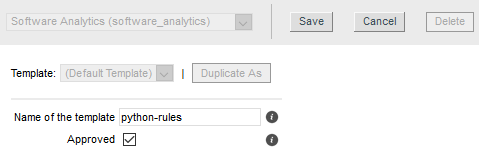
Creating a new python-rules ruleset template
Activate, deactivate or modify any rule you want for the template. In this example, we use the filter tools to select all Data Providers, turn off all the rules, and then select the Python-related Data Providers to activate all their rules
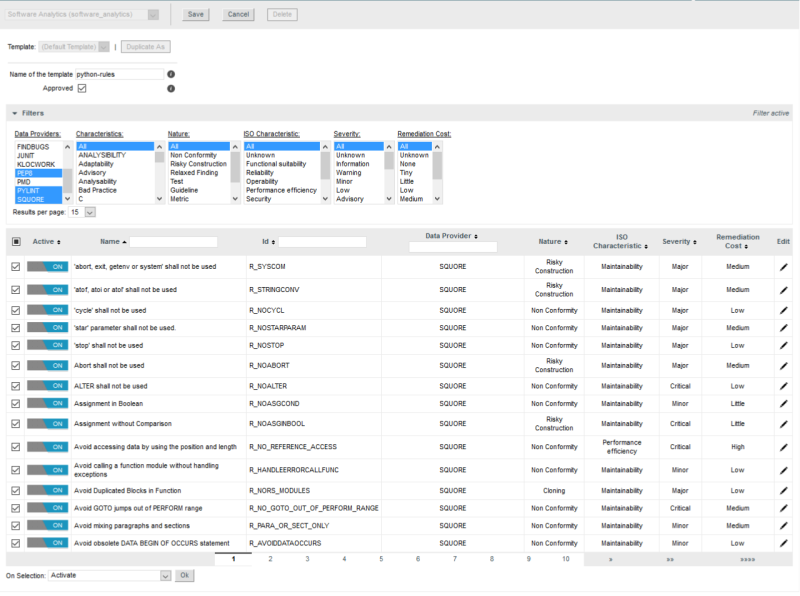
The python ruleset template includes the Pylint, pep8 and Squan Sources rulesets
When you are satisfied with your rule selection, click Save to save the template. It now appears in the template selection list. You can still modify it as needed, or click Duplicate As to start creating a new template based on your first template.
The saved python ruleset
Project managers can start using your template immediately by selecting it in the Ruleset Edition page of the project wizard, which is displayed after the Data Provider selection screen:
The template selection in the project wizard
Templates can also be applied to projects from the command line using the --rulesetTemplate parameter:
--rulesetTemplate="python-rules"