| > Show on single page > Show on multiple pages |
Project Managers may be interested in monitoring several projects as a whole. Squore provides a special dashboard view which compounds information about several projects into an analysis model dashboard, which can help you prioritise projects according to their current status.
In order to view the analysis model dashboard:
Log into Squore with the demo user.
Click the model name "Code ISO-9126 Maintainability Level" in the Project Portfolios.
The dashboard refreshes to show the compounded information for all projects analysed with this model using Quadrant charts and a summary table of the main indicators, the rating and the trend of each projects. and tables:
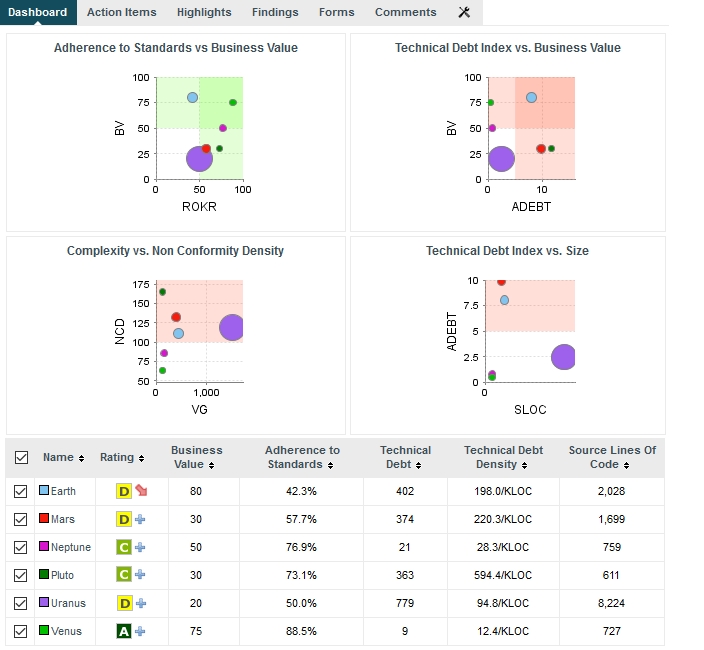
The analysis model dashboard for iso9126 projects
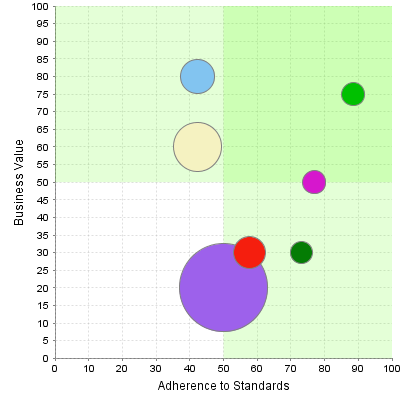
In the quadrants, each project is represented as a bubble. Two indicators define the horizontal and vertical position of the bubble along the axes, while a third indicator defines the bubble size. Let's see how you should prioritise maintanance work on the your project portfolio for the sample projects. Click on the Adherence to Standards vs Business Value quadrant to view the full version:
In this chart, projects with a high business value appear higher, while more standards-compliant projects appear more to the right. The size of each bubble indicates the size of the project in terms of source lines of code. Therefore, a project with a high business value like Earth (blue) is in a difficult situation because it is important for your company, but more work is required to bring it to an acceptable standard like the smaller projects in the top-right section of the chart (Venus, in light green) As a project manager, you knew that as a general rule you need to focus on moving projects in the top half of the chart (the valuable ones) to the right half of the chart (the standards-compliant ones).
Below the quadrants, Squore displays tables with the values used in the charts so you can refine the information read in the charts. All the information shown in the analysis model dashboard can be configured by a Squore administrator. Refer to the Squore Configuration Guide for more information.