| > Show on single page > Show on multiple pages |
When working with charts that support displaying a timeline (Temporal Evolution Line Chart and Temporal Evolution Bar Chart charts
with an attribute byTime="true"
), the x-axis can be customised to display the level
of details that suits you best. The following attributes can be used (since 14-A):
timeInterval
(optional, default: MILLISECOND) displays only the last value available for the time period selected. This allows you to display a result trend for the past year where only the last of every month is drawn on the chart (onlyLast="12" timeInterval="MONTH"). The values allowed for this attribute are MILLISECOND, SECOND, MINUTE, HOUR, DAY, WEEK, MONTH, QUARTER and YEAR. Note that for Temporal Evolution Bar Chart charts, this setting defines the width of the bar.
timeAxisByPeriod
(optional, default: false) allows labelling the x-axis with periods of time (true) instead of actual dates (false). The minor and major labels displayed are specified by the timePeriodMinorTick
and timePeriodMajorTick
attributes below.
timePeriodMinorTick
(optional, default: auto) defines the interval at which minor ticks are drawn on the chart. The values allowed are the same as for the timeInterval
attribute.
timePeriodMajorTick
(optional, default: auto) defines the interval at which major ticks are drawn on the chart. The values allowed are the same as for the timeInterval
attribute.
By default, the date used for each version is the actual date of when the analysis was run. However, you can override this date and specify the real date of an analysis in the UI using the Version Date field, or via the command line using the versionDate parameter. Refer to the Command Line Interface and the Online Help for more details.
You can display future or past versions on a chart using the forecast
element on a measure, as shown below.
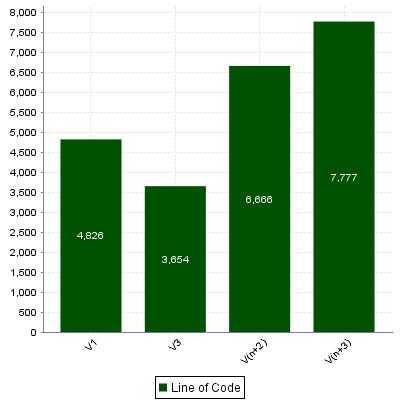
Planned (future) versions on a Temporal Evolution Bar Chart chart
<chart type="TemporalEvolutionBar"
		id="TEMPORAL_EVOLUTION_BAR_FORECAST_ID">
	<measure color="0,81,0" label="Line of Code">LC
		<forecast>
			<version value="SLOC" timeValue="DATE(2014,10,31)" label="V3" />
			<version value="6666" timeValue="DATE(2014,11,30)" />
			<version value="3333+4444" timeValue="DATE(2014,12,31)" />
		</forecast>
	</measure>
</chart>
The forecast
element supports one or more
version
elements with the following attributes:
value
(mandatory) is a computation valid for the current artefact type (same limitation as for displayOnlyIf
).
timeValue
(mandatory) is a computation valid for the current artefact type that is used to position the version on a time axis. The result has to be a number of milliseconds since January 1st 1970.
label
(optional, default: V(n+x)) is the label used to represent the
version on the chart.
Displaying 6 future versions can be done with the following example:
<measure color="170,70,67" label="Objective" dataBounds="]-1;[">OBJECTIVE
	<forecast>
		<version value="OBJECTIVE_VNP1" timeValue="DATE_VNP1" />
		<version value="OBJECTIVE_VNP2" timeValue="DATE_VNP2" />
		<version value="OBJECTIVE_VNP3" timeValue="DATE_VNP3" />
		<version value="OBJECTIVE_VNP4" timeValue="DATE_VNP4" />
		<version value="OBJECTIVE_VNP5" timeValue="DATE_VNP5" />
	</forecast>
</measure>
If the measures used for timeValue are updated for each analysis, you can create a rolling chart. If the timeValues are fixed, then the future versions will always be the same.
If you want to use fixed planned versions (January to December for example), you can use the dataBounds
attribute's value to prevent a specific version from being displayed:
<version value="IF(TODAY()>DATE_VNP1,-1,OBJECTIVE_VNP1)" timeValue="DATE_VNP1" />