| Installation and Administration | Getting Started | Command Line | Configuration | Eclipse Plugin | Reference Manual |
| Show on single page Show on multiple pages |
|
|
|
|
Copyright © 2017 Squoring Technologies
Licence
No part of this publication may be reproduced, transmitted, stored in a retrieval system, nor translated into any human or computer language, in any form or by any means, electronic, mechanical, magnetic, optical, chemical, manual or otherwise, without the prior written permission of the copyright owner, Squoring Technologies.
Squoring Technologies reserves the right to revise this publication and to make changes from time to time without obligation to notify authorised users of such changes. Consult Squoring Technologies to determine whether any such changes have been made.
The terms and conditions governing the licensing of Squoring Technologies software consist solely of those set forth in the written contracts between Squoring Technologies and its customers.
All third-party products are trademarks or registered trademarks of their respective companies.
Warranty
Squoring Technologies makes no warranty of any kind with regard to this material, including, but not limited to, the implied warranties of merchantability and fitness for a particular purpose. Squoring Technologies shall not be liable for errors contained herein nor for incidental or consequential damages in connection with the furnishing, performance or use of this material.
Abstract
This edition of the Getting Started Guide applies to Squore 17.1.2 and to all subsequent releases and modifications until otherwise indicated in new editions.
Table of Contents
The following conventions are used in this manual.
| Typeface or Symbol | Meaning |
| Bold | Book titles, important items, or items that can be selected including buttons and menu choices. For example: Click the Next button to continue |
| Italic | A name of a user defined textual element. For example:
Username
: admin
|
Courier New
| Files and directories; file extensions, computer output. For example:
Edit the config.xml file |
Courier Bold
| Commands, screen messages requiring user action. For example:
Username
: admin
|
| > | Menu choices. For example: Select
File > Open
. This means select the File menu, then select the Open
command from it. |
| <...> | Generic terms. For example:
<SQUORE_HOME> refers to the Squore
installation directory. |
Notes
Screenshots displayed in this manual may differ slightly from the ones in the actual product.
The following acronyms and abbreviations are used in this manual.
| CI | Continuous Integration |
| CLI | Command Line Interface |
| DP | Data Provider, a Squore module capable of handling input from various other systems and import information into Squore |
| RC | Repository Connector, a Squore module capable of extracting source code from source code management systems. |
Table of Contents
This document was released by Squoring Technologies.
It is part of the user documentation of the Squore software product edited and distributed by Squoring Technologies.
This document is the Getting Started Guide for Squore.
It is indented as a follow up to the Squore Installation and Administration Guide and will help you understand how to use the Squore user interface to create and update projects. It is divided into several chapters, as detailed below:
Chapter 2, The Tools at Your Disposal provides details on where to find the sample Squore projects.
Chapter 3, Accessing Squore will guide you through your first access to Squore as a user.
Chapter 4, Creating Projects and Versions covers ways of creating new projects and versions.
Chapter 5, Understanding Analysis Results describes the user interface and functionality you will use in Squore on a daily basis.
Chapter 6, Managing Your To-Do List With Squore helps you integrate action items suggested by Squore into your workflow.
Chapter 7, Track Your Favourite Indicators shows how you can track your favourite items and consult Squore results on mobile devices.
Chapter 8, Focus on Your Milestones guides you through the introduction and management of milestones and objectives in Squore.
Chapter 9, Communicating With Squore covers all reporting features of Squore.
Chapter 10, Keep it Tidy: Project Maintenance in Squore helps you maintain a Squore installation.
Chapter 11, Repository Connectors and Chapter 12, Data Providers detail the various Repository Connectors and Data Providers you can use when launching analyses.
If you are already familiar with Squore, you can navigate this manual by looking for what has changed since the previous version. New functionality is tagged with (new in 17.1) throughout this manual. A summary of the new features described in this manual is available in the entry * What's New in Squore 17.1? of this manual's Index.
For information on how to use and configure Squore, the full suite of manuals includes:
Squore Installation Checklist
Squore Installation and Administration Guide
Squore Getting Started Guide
Squore Command Line Interface
Squore Configuration Guide
Squore Eclipse Plugin Guide
Squore Reference Manual
If the information provided in this manual is erroneous or inaccurate, or if you encounter problems during your installation, contact Squoring Technologies Product Support: http://support.squoring.com/
You will need a valid Squore customer account to submit a support request. You can create an account on the support website if you do not have one already.
For any communication:
support@squoring.com
Squoring Technologies Product Support
76, allées Jean Jaurès / 31000 Toulouse - FRANCE
Approval of this version of the document and any further updates are the responsibility of Squoring Technologies.
The version of this manual included in your Squore installation may have been updated. If you would like to check for updated user guides, consult the Squoring Technologies documentation site to consult or download the latest Squore manuals at http://support.squoring.com/documentation/17.1.2. Manuals are constantly updated and published as soon as they are available.
Table of Contents
Squore ships with a collection of sample projects that we will refer to throughout this guide. Each project consists of one or several versions of the source code of an application. The code can be found in Squore Server and Squore CLI in the folder <SQUORE_HOME>/samples. If you do not have access to the sample projects, contact your Squore administrator to obtain a copy of the code.
Squore ships with a database that contains two sample users that you can use to familiarise yourself with all the functionality available:
You can use these two default users, but we recommend that you change their passwords after your first connection. The privileges and permissions assigned to these default users can be modified as needed. You can familiarise yourself with Squore permissions and privileges by referring to the section called “Understanding Profiles and Roles”.
You may choose to read this manual from beginning to end, or jump straight to a specific topic. Logging in as the demo user, gives you access to a Tools menu that allows to reproduce the examples shown in this manual. Click Tools > Build Demo Projects and select the Software Analytics - C samples to get started.

The menu is only accessible to the user demo or any user who belongs to a group called demo. Contact your Squore administrator if you do not have access to the Tools to create the sample projects.

If at any moment you have doubts about how a feature works, Squore offers help in HTML and PDF formats. A Wiki and support site are also available.
The Squore online help can be accessed from anywhere in Squore by clicking on the ? > Help menu entry.
The online help is contextual and provides information in a popup window about the page that you are currently viewing in Squore.
The Squore user guides are available in PDF and HTML format by clicking the ? > User Guides menu entry in Squore. You can download a copy for offline use.
The Squoring Technologies Support Wiki provides release notes, known issues and hints and tips for current and past Squore versions. Visit http://openwiki.squoring.com for more information.
Every owner or Project Manager of a project can retrieve the analysis log files for their projects without the need to consult an administrator. This is done by accessing the Manage page for a particular project and viewing the Versions tab (Projects page > Manage icon > Versions tab) as shown below:

Clicking the Log icon opens a page showing the project's client and server logs, as well as configuration and output files will open in a new browser tab.
Clicking the Download link in the Debug info column downloads a zip file of the logs and project data that can be further analysed to understand problems during problem creation.
In order to investigate application failures (rather than project analysis errors), Squore administrators have the possibility to extract the latest log file created by the application. You can access the log if you have administrator privileges by clicking Administration > Server Log in the toolbar after logging in. The log file opens in a new browser window or tab.
Administrators can also get debug information and manage any project created on the server by clicking Administration > Projects, which provides a detailed view of all projects created on Squore Server, on a summary page shown below.

A debug info package contains the following items:
A DataProviders folder containing the output files generated by
each Data Provider run during the analysis.
A [DataProviderName].log file for each Data Provider included in the analysis.
A [projectId]_conf.xml file summarising the project parameters used for the analysis.
A [projectId]_output.xml file containing the output information requested with the --filter parameter during the analysis.
A build.log file containing the information relative to actions carried out on the server during the analysis.
A build_client.log file containing the information relative to actions carried out on the client during the analysis.
A excluded.log file containing the list of all files not included in the analysis and the reason for their exclusion. Note that this file is only generated if some files were excluded.
A table.md5 file containing state information about the analysed source code, if any.
A storage folder containing information about the analysed source code, if any.
If you do not want to download the entire debug package, note that the main log files can also be downloaded individually from the Projects page by clicking on the project status label.
Table of Contents
This chapter walks you through your first access to Squore and covers the web interface and some ways to customise it to your liking.
Before you start working with Squore, it is essential to understand how access management works. The various permissions and privileges that can be assigned to Squore users are grouped in profiles and roles respectively. A set of default roles and profiles is available when you first start the server. You can edit them, or create more as needed.
Use this simple trick to remember the different between a profile and a role:
A Squore user with the Administrator profile can manage users, their roles and profiles. A Squore user with the Project Manager role for a project can create a new version of this project or give access to another user to this project's analysis results.
You can use profiles to grant or deny access to the following Squore features:
Manage Server: Configure the server, access server logs, manage all projects.
Manage Users, Groups and Roles: Complete access to user management on the server.
View Models: Allows users to use the Viewer and the Validator.
Use Capitalisation Base: Provides access to the Capitalisation Base feature to learn from past data in order to improve your model.
Create Projects: Allows users to run analyses.
Modify Models: Allows users to use the Dashboard Editor and the Analysis Model Editor.
Use External Tools: View and use external tools configured by your Squore Administrator. To learn more about this feature, consult the Configuration Guide.
Manage Configuration: Allows users to reload the server configuration from disk.
View Online Help: Allows users to consult the online help from the web interface.
View User Manuals: Allows users to consult the product documentation from the web interface.
Three profiles are available by default, with permissions set as shown below:

Note that a profile can be assigned to a user or a group of users. It is therefore possible for a user be a member of more than one profile. In this case, the user's profile is the combination of all permissions from all the profiles they are a member of.
A role is the set of privileges that a user enjoys in the context of a project. You can use roles to allow users to undertake these actions within the scope of a project:
TODO to Relaxed
for example. Without this privilege, the status is displayed
as a read-only field.Six roles are available by default, with privileges assigned as shown below:

Note that a user can have multiple roles in a project. This allows a user to view the dashboard in the Explorer as a user from another role would. A View As option in the option menu of the Explorer allows to you to switch between the various dashboards available to you. When you have multiple roles in a project, you combine privileges from all the roles that you are a member of.
The owner role is assigned automatically to the user who creates the first version of a project. A project has only one owner, and you can control how much a project owner can see and do by modifying the permissions of the OWNER role. An administrator can transfer ownership of a project to a new user if required.
Your Squore installation runs on
http://localhost:8180/SQuORE_Server
by default. By accessing this page in your browser, you will be
redirected to the Squore login page,
as shown below:

Type in a username and a password and click Login to log in.
To begin using Squore, log in as the demo user with
demo as username and password on the
login page. Click the Login button
and wait for the Welcome page to open.

From the Welcome page, you can automatically return to the last projects or favourite artefacts that you had opened in the Explorer before logging out. You can also get links to the help and other features available for your account.
As the demo user, you are an advanced user of Squore and have access to the following functionality from the toolbar:
Explorer, where you can review your analysis results.
Projects, where you can launch new analyses and manage your projects.
Favourites, where you can view and manage your favourite charts across projects.
Capitalisation, where aggregated statistical data can be found.
Models, under which you can examine all characteristics of your model and edit your dashboards.
Tools, which contains shortcuts to scripts that recreate demo projects. Note
that only the demo user and members of the demo group have access to this menu by default.
<username>, where you can set your preferences and log out from Squore.
?, where online help, user manuals and application information can be found.
Note: If you log in as an administrator of Squore using admin
as the username and password, your will gain access to the Administration
menu where you can configure access management and administer the server.
You can log out of Squore by clicking your user name in the menu bar and selecting the Logout option. Note that if you close your browser without logging out, your session will automatically time out after two hours.


The Squore look and feel can be adapted to your liking, with three provided themes, accessible from the
<username>
menu option. Select one of the available
colour schemes to change the color of the interface. Your changes are saved using a browser cookie.

You can use Squore in various languages. English and French are provided by default, and
your Squore administrator can add more as needed. If you want to change the language of the Squore user interface,
click the
<username>
menu option and click one
of the flags available. The changes are applied immediately and your preferences are saved even after you log out.
Table of Contents
In this chapter, you will learn about the various ways to create a project in Squore: using the UI, using a command line tool or triggering analyses in a continuous integration environment.
Creating a project in Squore is as easy as following a wizard that will prompt you for information about the source material to analyse, and the external Data Providers to add to the analysis results.
The example below assumes that the source code for the sample project used is available on a network share. The path to the source files to analyse is relative to the server.
In order to create a project for the sample application Neptune2, follow these steps:
Access
http://localhost:8180/SQuORE_Server
in your browser.
The log-in page appears.
Log in as the demo user with the login/password combination
demo/demo.
Click the Login button. You are presented with the Squore home page.
Click Projects to switch to the projects view and click Create Project to create the Neptune2 project.
The General Information screen appears.

The General Information screen
If your Squore installation has been customised to provide more than one project wizard, you will see a Wizard Selection screen where you can choose which project wizard to follow. Project wizards allow you to use different analysis models and tools to analyse your projects. For this demo, click the Software Analytics wizard to start creating the project.

The Wizard Selection screen
On this screen, you can enter the information relative to your project in the Project Identification section
The Version Date field allows specifying a custom date for the analysis, so that different analyses can be placed correctly on a timeline later for certain charts in the dashboard. If you leave it empty, then the actual time at which you are running the analysis is used.
The Software Analytics model offers extra parameters below the Project Identification section, but you can ignore them for now.
Click the Next button. The Data Providers screen is shown:

The Data Providers options screen
This screen allows configuring the repository locations and tools that will be used in your analysis.
Set the source code files option to Folder. In the Datapath text box,
type the path to the Neptune2 source code: \\server\share\samples\c\Neptune\W25.
The only Data Provider used in our analysis is Squan Sources, the source code analyser, so you can leave all the other tools unchecked.
If you want to learn more about the available Repository Connectors and Data Providers, consult Chapter 11, Repository Connectors and Chapter 12, Data Providers .
In the Squan Sources parameters, ensure that C is one of the programming languages selected, as shown below:

The Squan Sources Data Provider parameters
Click the Next button to read the Rules Edition screen. This screen allows you to tweak the ruleset available in the analysis model.

The Rules Edition screen
The table displays the entire model's ruleset, which you can filter and sort by data provider or category. Each rule can be turned on or off, and you can click the Edit button to adjust the categories for each rule. Note that any modifications from the original configuration are displayed with an asterisk.
Click the Next button when you are satisfied with your modifications. Note that your modifications are applied for any subsequent analysis of this project and do not affect other projects using the same model.
This screen may not be enabled in your wizard, as your administrator may have disabled it in your configuration. Your administrator can also decide to make modifications to the ruleset that apply to any project created with this model using the Analysis Model Editor. Consult the section called “Analysis Model Editor” and the section called “Using Ruleset Templates” to learn more.
Before launching the analysis, a summary of your selections is displayed. Review the information and click Run to confirm the project creation.
The summary page lists all lists all the options you specified for the project creation and also allows outputting them in various formats so that you can repeat the project creation in command line. For more information about reusing the project parameters in a different context, consult the online help or the section called “Can I Create a Project Via the Command Line?”.
When the project analysis completes, Squore shows you the list of projects. Neptune2 appears in the list, together with information about the current version and its computed rating:
To consult the results of the analysis, click on the project name to view the Squore Dashboard. More information on how to read the Dashboard is available in the section called “Where Are My Analysis Results?”.
Adding a version to an already-existing project is a simple procedure that is carried out from the Projects page.
Follow these steps to create version 2 of your project:
After logging into Squore, click on Projects.
Click the Build
icon
( )
for the Neptune2 project in order to access the source code file options.
)
for the Neptune2 project in order to access the source code file options.
The first screen of the wizard enables you to specify the version name and to modify some of the project attributes if necessary.

Parameters For the New Version of Neptune2
Click the Next button to reach the project language and source settings screen. On this screen, you can modify the path to the source code and point to the newer version. Note that by default, Squore displays the path used when analysing the last version. Leave the path as it was for version 1. We are going to create a version that analyses the same code in this example. If you scroll down to the code analysis option, you will notice that some of them are now disabled. This is because the project configuration was set in version 1 and is not allowed to be modified in subsequent analyses. This ensures that your project is scored using the same criteria every time you analyse new code.

Unavailable options when creating version 2 of a project
Note: You can add new sources to the project at this stage if needed. Read more about projects using sources spread over multiple locations in the section called “Can I Create Projects with Sources From Multiple Locations?”.
Click Finish and Run to launch the analysis of Neptune2 V2. When the analysis finishes, Neptune2 V2 will be listed in the list of projects on the Projects page.
This section covers an essential workflow feature of Squore: baselining. While it is possible to keep every version of a project created in Squore, you may want to permanently keep analysis results only for particular milestones and work with an always updating draft version.
You can decide whether a version is a draft or a baseline when you create it, or after the analysis is finished.
The most important thing to remember about a draft version is that it is a snapshot of your data at a given time. You can use it to compare the evolution of your project against the last baseline created. There is therefore only one draft version available per project (the latest version), which Squore creates automatically if your previous version was a baseline. A baseline version, on the other hand, is permanently saved and will not be overwritten the next time an analysis is launched.
When you create a draft version, it is always called Current and can be modified in several ways:
Forms can be updated
Attribute values can be modified so that a new value is taken into account in the next analysis
Artefacts can be manually added, modified or deleted
Folders and files can be relaxed or excluded from the project
Action Items can have their status changed
Rules and individual violations can be relaxed
Being able to view draft versions of a project is a user privilege that can be granted to users of a particular role, and so is the ability to baseline a project. For more information about roles, refer to the section called “Understanding Profiles and Roles”. This means that as a project manager, you can give access to every version to users within your team, but can restrict the project visibility to the rest of the company to show them only milestone versions (the ones you baselined). You can also decide which members of your team are allowed to change the status of a version from draft to baseline.
Use the Automatic Baselining option on the General Information screen of the project wizard to create a draft or baseline as follows:
You can use the Baseline option on the Projects page to create a baseline version of the current draft as follows:
 ) next to the project you want to baseline.
After confirming the baseline creation, you are redirected to the Projects page and the last draft version becomes the new latest baseline. All changes made manually to artefacts and findings are kept, and will be incorporated the next time an analysis runs. Note that baselining is only available for users whose role allows the Baseline Projects privilege. For more information about roles, consult the section called “Understanding Profiles and Roles”
Baselining manually is useful if you have reviewed the current draft and have not made any changes to the analysis results. If you have modified form entries or relaxed artefacts and findings in a way that should impact the rating, consider launching a new build or using the Apply Changes button instead of baselining. See the section called “Handling Manual Modifications” for more information.
When you have made changes to form values or you have relaxed artefacts and findings in the current draft, there are two ways to get these changes reflected in the dashboard:
running a new analysis
clicking Apply Changes
Running a new analysis will allow you to change the source code repository settings and input files for data providers, or keep them. You can choose if this new analysis should produce a baseline or a draft version. In all cases, the artefacts you relaxed or excluded, the action items you modified and the findings you relaxed are taken into account to produce the rating of the new version.
Clicking Apply Changes ( ) allows you to merge the manual modifications to artefacts, forms, action items and findings into a new
draft version without reanalysing source code and re-running data providers. Manual modifications are simply merged with the already-
existing results to update the rating, which is a lot faster than running a full analysis. Note that Apply Changes is not available when you have excluded artefacts.
) allows you to merge the manual modifications to artefacts, forms, action items and findings into a new
draft version without reanalysing source code and re-running data providers. Manual modifications are simply merged with the already-
existing results to update the rating, which is a lot faster than running a full analysis. Note that Apply Changes is not available when you have excluded artefacts.
You can also use Apply Changes after modifying your analysis model to migrate a project to the new version of a model without running a full analysis.
There are three types of changes you can make to Squore projects:
Changes to attribute values
Changes to source code locations
Changes to some of the Data Provider options
Project attributes are always editable when creating a new version of a project, except for the name of the project.
The location of the source code can always be modified. When editing a project, you can also add more source locations as needed, following the steps described in the section called “Can I Create Projects with Sources From Multiple Locations?”.
Whether you can edit the settings used in the Data Providers for the project depends on their ability to support edits. This ability is defined by a Squore administrator via the configuration of the Squore wizards. For more information, refer to the Squore Configuration Guide.
Instead of creating a project from the Squore web interface, you can create a project directly from the command line using Squore CLI. Squore CLI is a client for Squore that enables you to create and analyse projects locally and send the results to Squore Server. Alternatively, you can use Squore CLI to instruct Squore Server to carry out the analysis.
If you have installed Squore CLI on your computer, you can call it using Java, passing the parameters you would have passed in the web interface to create projects. The following is an example of the command line you can use to create a project using Squore CLI on Windows:
@echo off
java -Dsquore.home.dir="%SQUORE_HOME%" ^
-jar %SQUORE_HOME%\lib\squore-engine.jar ^
--url=http://localhost:8180/SQuORE_Server ^
--commands=DELEGATE_CREATION ^
--name=Mars2 ^
--repository "type=FROMPATH,path=\\server\share\samples\c\Mars2\V3.2.6" ^
--color=rgb(103,25,237) ^
--version=1.0 ^
--login=demo ^
--password=demo ^
--filter=APPLICATION,MEASURE,LEVEL ^
--wizardId="ANALYTICS" ^
--dp "type=SQuORE"
echo done
pause
The example above shows how to specify commands, parameters and project options to Squore CLI. This would create a project named Mars2 in version 1.0, analysing source code located in \\server\share\samples\c\Mars2\V3.2.6 with the Data Provider SQuORE (the internal name for Squan Sources).
You can find more information about using Squore CLI in the Command Line Interface manual, which explains how to install the client and create projects.
If you use a Continuous Integration tool like Jenkins or CruiseControl, you can add Squore to your build process and analyse projects every time your code is compiled. This requires the installation of Squore CLI on the continuous integration server, and is therefore described in greater details in the Command Line Interface Manual.
The source code analysed by Squore does not have to be located on the same machine as Squore Server or Squore CLI. When you create a project, you get the option to choose from a range of Repository Connectors to pull source code from:
Direct file system access (local drive, network share, mass storage media...)
Zip upload
A ClearCase view
A CVS checkout
Git cloning
An Integrity repository
A Perforce depot
A Subversion revision
A Synergy database
A TFS server
Each option requires different parameters, which can be specified from the project wizard, or via the command line. For more information, refer to Chapter 11, Repository Connectors.
Squore provides support for analysing projects whose sources are
spread over several locations or version control
systems. If your source code resides in
/products/common and
/projects/myproject,
you can specify these two locations in the
Squore project wizard by clicking the
Add Repository
button. Similarly, if some of your code is managed by a
SVN repository and the rest is handled by a Git server,
you can configure both locations as part of the same project,
as shown below:

A project using sources from two SVN repositories and a network drive
Now that you have created a project, you are ready to start reviewing the analysis results in the main section of Squore, the Explorer, which consists of a set of trees for browsing through project artefacts and various dashboards to display the information associated with these artefacts.

The Squore Explorer
Common icons are used throughout the explorer to indicate the rating of a component and its evolution compared to the previous version. The image below shows the meaning of the different icons used:

The Squore Explorer icons
The left-hand part of the Explorer is a three-panel section containing expandable trees.

The Tree Pane
The top panel contains the Project Portfolios and the Review Set.
The Project Portfolios is a list of all the projects you have access to, grouped by analysis model. Each project is listed with its latest rating and evolution and can be expanded to show all versions of the project that were analysed with Squore.
The Review Set is a flat list of artefacts you collect from various projects in order to review them. This list is saved when you log out and log into Squore again.

The expanded Earth project, rated E, and its 7 versions in the Project Portfolios
The tree in the middle panel is the Artefact Tree . When Squore analyses a project, it breaks it down into artefacts of various configurable types, for example APPLICATION, PROGRAM, FOLDER, FILE, CLASS or FUNCTION, according to the analysis model used. The artefacts in the tree are displayed for the version selected in the Project Portfolios. clicking a different version of a project refreshes the artefact tree with the ratings for the version just selected. Above the artefact tree are tools for filtering, pinning, sorting and searching artefacts. Each artefact is displayed with its current rating and can be expanded to reveal child artefacts if available. The number in brackets indicates the amount of child artefacts for the current artefact. You will learn about these tools later in the section called “Has the Quality of My Project Decreased Since the Previous Analysis?” and the section called “How Do I Find and Keep Track of Artefacts?”.

The Artefact Tree for version 6 of the Earth project
The bottom panel is the Indicator Tree , in which ratings for the indicators defined in the analysis model at the current level are displayed. Each indicator can be expanded to display the rating of each of its sub-indicators. The Indicator Tree displays statistics for the artefact currently selected in the Artefact Tree and refreshes when the selection is changed. The type of artefact selected in indicated in brackets. Two shortcut buttons can be found above the top node to quickly expand and collapse the entire tree.

The partly expanded Indicator Tree for version 6 of the Earth project at Application level
Clicking one of the tree nodes reveals more information about the indicator, including the formula used by Squore to compute its value and rating.

The popup displayed when clicking the Complexity Distribution indicator at application level
The right-hand side of the Squore Explorer contains a series of tabs, the first of which is the Dashboard. The Dashboard is dynamic and always displays information about the artefact currently selected in the artefact tree. There is not one Dashboard, but a Dashboard per node in the tree. Additionally, the Dashboard can be customised by a Squore administrator so that users see a different Dashboard according to their role in a project, thus highlighting different information for project managers, quality engineers and developers for example. Ask your Squore administrator about Dashboard customisation, or refer to the Squore Configuration Guide for more information.
The left-hand area of the Dashboard contains the score card , which consists of a graphical representation of the key performance indicator for the current artefact, and some tables highlighting key metrics about the project.

The score card area
Each table lines display a series of details about the key performance indicator:
The name of the metric (e.g. Rule Compliance). When clicked, a popup shows the way the metric is computed. Optionally, some metrics may allow an extra link to be displayed. This link shows the list of findings taken into account when calculating this metric (See Non Conformity Count).
The raw value of the metric and its evolution according to the previous version (e.g. -99.77% =). Clicking a value ion this column displays a chart of the history of the last 10 values recorded for this metric.
If the metric displayed is an indicator, the rating of the indicator is displayed, along with its evolution (e.g. Level A, stable). If the metric is a measure, then an information icon is shown. In both cases, you can click the information in this column to display more details about how the metric is computed.
The right-hand area of the Dashboard contains a series of charts representing key information about the current artefact. Clicking a graph opens a larger version of the image so you can analyse the data. Note that the available charts will differ depending on the type of artefact selected in the tree. Files and functions for example include a Source Code chart (for users who have the privilege to browse source code), which does not appear in the Dashboard for folders and applications.

The charts area
The Dashboard is only the first of a series of tabs in the Explorer. In the following chapter, you will find out more about the role of the Action Items, Highlights, Findings, Forms, Reports, Indicators, Measures and Comments tabs. Note however that like the Dashboard, the information displayed in each tab is always relative to the node currently selected in the Artefact Tree.
In contexts where your projects reuse code from other projects that you also analyse in Squore, you can create a meta-project that will show the analysis results from the various software bricks in a single project.
This feature is not enabled by default in the standard configuration, so consult your Squore administrator to make the necessary changes to your model, following the instructions described in the Configuration Guide.

Selecting a wizard for building meta-projects
When you select a wizard that allows to create a meta-project, you do not have to specify any locations for source files or any data providers to run. Instead, you are presented with a project picker that allows you to tell Squore which sub-projects compose your meta-project. In the example below, we will create a project that uses Earth (V2), Mars (v3.2.6), and Saturn (Prel) as its parts. You can choose any baseline version of any project you have access to in Squore as a component of your meta-project.

Building a new meta-project with code from Earth, Mars and Saturn
When the analysis finishes, the meta-project is listed along with the other projects in the Project Portfolios. You can expand the Artefact Tree for your meta-project to browse the artefacts of the three sub-projects that are part of your meta-project, and consult all their Action Items, Findings and Highlights.

The dashboard for the meta-project Solar, composed of Earth, Mars and Saturn
Table of Contents
This chapter describes the main features available in the Explorer. By the end of the chapter, you should be able to make the most of the information and decisions presented by Squore and start applying them to improve your development practices.
After completing the analysis of a new version of your project, you will probably want to investigate how it has evolved, more specifically for which artefacts the quality has decreased. Let's look at the history of the Earth Project (which should be available if your Squore administrator has created the sample projects shipped with the Squore installation) to find out how to spot the worst-scored components in your project.
Log into Squore as the demo user using demo/demo
and observe the evolution of the Earth project in the
Project Portfolios:

The versions of the Earth Project
The trend arrows before the version names in the the Project Portfolios indicate that the overall rating has not changed (More information about the quality indicator icons is available in the section called “Where Are My Analysis Results?”.). If you take a closer look at the Technical Debt Trend chart however, you can notice that the technical debt is growing for this project.

The Technical Debt Trend chart for the current version of Earth
Since the trend accelerated in V6, we will focus on this version. Let's click V6 in the tree and start our evaluation by looking at the score card, which rates Earth at E.
Let's also look at the Developer dashboard, which offers more insight into coding violations. Select View As > Developer in the Explorer menu:

The View As menu allows to switch roles in the project
Some values under Artefact Counting, Line Counting and Issue Distribution explain the lower score: the application contains more files and functions, more lines of code, less comments and more rules violations.

The score card for the version V6 of Earth
By now you probably want to find out which components in your project are responsible
for increasing the technical debt the application in this version. If you want the Artefact Tree to
reflect this information, you can change the sort order to show the worst scores first
by clicking on the sort icon
( )
and selecting
LEVEL > Worst first to display artefacts from worst-scored to
best-scored.
)
and selecting
LEVEL > Worst first to display artefacts from worst-scored to
best-scored.
In this section, you will learn to look for artefacts the hard way by using filters and search. For a more automated way to find artefact that fit a specific category, take a look at the section called “Finding Artefacts Using Highlights”.
Click the Filter icon
( )
above the Artefact Tree to show the filter options and select only the levels F and lower:
)
above the Artefact Tree to show the filter options and select only the levels F and lower:

The filter popup with the boxes checked to filter artefacts rated F and lower
Click Apply to apply the changes, and the Artefact Tree should refresh to show only artefacts in the levels selected, as shown below:

The filtered Artefact Tree showing artefacts rated F and lower
The notice Filter active is always displayed above the Artefact Tree when you are using a filter. The tree now only shows artefacts rated F and lower, along with their ancestors (i.e. their parents and ancestors), even though the ancestors may not be rated F and lower.
While a filter is active, you can still search for other artefacts by typing a search term in the search box. Try typing ma in the search box above the Artefact Tree, and watch the search results list get populated as you type:

The search results for the term entered in the search box
If you select the first search result in the list above,
you will open the dashboard for machine.c.
Let's go back to our filtered tree. The filter singled out two artefacts with the
required score range: player.c and
robot.c. The artefact player.c deteriorated in
version 6. Click on the artefact player.c to view its
dashboard. Note how the score card indicates that the artefact has more blocker issues than
in the previous analysis.

One more blocker issue for player.c in this version
You can click the link in the table to directly view the new blocker violation on the Findings tab. In this case, the rule NOFALLTHROUGH was broken:

A new blocker issue for player.c in this version
Another convenient way to try and find why a project's quality is deteriorating is to filter on the trend of an artefact.
Select the current version of Earth again and edit the active filter: Uncheck the boxes for levels F and lower, and select
the Deteriorated category in the Evolution column.
When applying the filter, you should see the artefacts in the tree
that have the  icon
next to their name.
icon
next to their name.

The artefacts that deteriorated in the current version of Earth
The functions you looked at earlier are still here, but there are more deteriorated artefacts
that you can start reviewing. If you click on
hi_scores_disp(int) for example, which is rated E.
In order to find out where the degradation took place, you can look at the indicators tree to understand where the decline in quality comes from. Expand all the nodes in the indicators tree to reveal the issues with the artefact:

The Indicator Tree for hi_scores_disp(int)
Squore makes it easy to spot the irregularities quickly, like the fact that the Maintainability Non Conformity indicator is one of the causes for the worse score in this version. This is probably the first item to review in this function.
Take a look at the Coding Rules Compliance section of the artefact's scorecard to confirm the results:

The scorecard for hi_scores_disp(int)
By clicking the link icon, you can directly view the violations for this artefact in the Findings tab.
You can dive further into the analysis results by looking at the information contained in other tabs and assign action items to your team by referring to Chapter 6, Managing Your To-Do List With Squore or report your progress as explained in Chapter 9, Communicating With Squore.
In the previous section (the section called “Finding Artefacts Using Filters and Search”), you got familiar with searching and filtering to find the artefact that have a negative impact on the overall rating of a project. in this section, you will learn to master the Highlights functionality, which aims to make the process of finding certain categories of artefacts easier.
Highlights are flat lists of artefacts ordered in predefined categories for a model.
Let's try to confirm our findings about the worst and most deteriorated artefacts in Earth. Click on the current version of Earth and clear the filter. Click the Highlights tab of the Explorer and select the Top 10 worst artefacts category. The list appears as shown below:

The Top 10 worst artefacts in the current version of Earth
The list confirms that the artefacts with the worst rating are player.c and robot.c. The Highlights table shows you the artefact rating, name and path, and allows you to go to the artefact's dashboard directly by clicking the artefact name.
Now you can also find the deteriorated artefact hi_scores_disp(int) that you identified with a filter earlier in the section called “Finding Artefacts Using Filters and Search”: select the Top 10 most deteriorated artefacts highlight category to see the artefact appear in the list of deteriorated artefacts in this version.

The Top 10 most deteriorated artefacts in the current version of Earth
Artefacts are sorted by degradation, i.e. the difference between the value of the main indicator in the previous baseline version compared to the current value. By clicking the Export button, you can export the selected items to a CSV file. If the Export button is greyed out, your licence does not include the option to export data to CSV files.
By default, the list of most deteriorated artefacts is compiled based on the previous version. By using the Reference list
in the Explorer Settings menu ( )and choosing another reference version, you can update the statistics based on the
new reference version you just selected.
)and choosing another reference version, you can update the statistics based on the
new reference version you just selected.
Note: The notions of baseline and draft versions is explained in the section called “Working with Draft and Baseline Versions”.
Squore administrators can customise and expand this list by referring to the Squore Configuration Guide.
For some projects, you may want to collect artefacts so you can review them later. Squore enables you to build a Review Set, a list containing artefacts that you want to keep track of. Let's log in as the demo user to review all the new artefacts added to a project, in order to evaluate their level of quality.
Isolating the new artefacts can be done in three steps:
Log in using the demo user (demo/demo).
Click on version V6 of Earth in the Project Portfolios to display the dashboard for the last version of the project.
Click the Filter icon to display only items in the Evolution column with the status New and apply your changes
You should see the following artefacts in the Artefact Tree:

The new artefacts in the current version of Earth
Squore makes it easy for you to keep track of these artefacts. Click on the icon above the Artefact Tree and select Add Filtered Results to Review Set.
You can now clear your filter, the artefacts you want to review are stored in your Review Set. Click the Review Set tab in the left pane of the explorer to find the items you just saved.

The Review Set filled with new artefacts for the new version of Earth
At any moment, the artefact currently selected in the Artefact Tree can be sent to the Review Set as well. Simply display the context menu for an artefact and click Add to Review Set to add it to the Review Set. Clicking an item in the Review Set pane has the same effect as clicking it in the Artefact Tree: the dashboard refreshes to show the information for that artefact. You can use the left and right arrows in the Review Set pane to go to the previous and next artefact in the list.
If you want to know more about what actions you can take after reviewing artefacts, refer to Chapter 6, Managing Your To-Do List With Squore and Chapter 9, Communicating With Squore.
Squore provides tools to understand, verify and enhance your model under the Models menu.
The Viewer, a graphical representation of all the analysis models on Squore Server
The Validator, a debug tool for model writers
The Dashboard Editor, which allows customising the dashboards that all users will see
The Analysis Model Editor, which allows modifying the model's ruleset
Users whose profile grants the "View Models" permission have access to the first two tools.
Users whose profile grants the "Modify Models" permission have access to the last two tools.
To use the Viewer:
Upon selecting the parameters above, the page is refreshed with the top-level indicators in the model, and you can click each indicator to unveil sub-indicators and their characteristics. You can drag the tree left and right to reveal all sub-levels if necessary. For each indicator selected, Squore displays the following information:
Target is the target artefact type for the selected item
Type is the type of the selected item
Mnemonic is the short code for the selected item
description is the description of the selected item
Data Provider is the Data Provider responsible for computing the selected item
MeasureId is the measure ID of the selected item
Computation is the formula used to compute the value of the selected item
ScaleId is ID of the scale associated with the selected item
Levels is the list of levels available for the selected item and their ranges
Note: The information available depends on the type of item selected.
If your work involves adjusting the model's metrics or dashboard, you can use the Validator to verify its integrity during as you make changes. Click Models > Validator to display the diagnostics organised by category, as shown below:

The software_analytics model in the Validator
The Summary tab displays a summary of all the diagnostics run for each category. By clicking any of the other tabs, more details are shown about potential problems found in your model. You can also show the complete XML of the model to understand the errors reported. The XML can be searched by using the Ctrl+F key combination to bring up the search dialogue, and then Ctrl+G to search for the next occurrence of the search term:

The Validator reporting errors
Your Squore administrator can help you get more information model development. You can also refer to the Squore Configuration Guide for a complete reference.
The Dashboard Editor is a graphical editor for the dashboards of a particular model. Dashboards consist of a key performance indicator, a list of tables and one or more columns of predefined charts. With the Dashboard Editor, you can rearrange the information shown on the dashboard for all users, or create a completely new dashboard for a new role in your project.
In order to use the Dashboard Editor:
Click Models > Dashboard Editor
Select a model and load an existing dashboard
The current dashboard skeleton is loaded in the editor, as shown below:

The Software Analytics model in the Dashboard Editor
The tree contains the list of pre-configured graphical elements that you can add to your current dashboard. When you hover over a dashboard element, a tooltip explains what metrics it displays. You can drag and drop an element over an existing chart on the current dashboard, drag charts and tables to rearrange them. When you are satisfied with your changes, you can save your modifications. You can also create a new dashboard, using an existing one as a basis for the new one, or start from a blank canvas.
In the tree, graphical elements are colour-coded so that you know before you add them to your dashboard if they are compatible with your model. Blue elements have minor incompatibilities with your current model and orange elements are likely not compatible. Use the tooltip for an element to understand why the element is flagged as incompatible.
More detailed explanations about the Dashboard Editor can be found in the Squore online help.
The Analysis Model Editor is a graphical ruleset editor where you can turn rules on and off, or adjust the categories associated to each rule in your model.
It also allows you to save ruleset templates so that you can use a different set of rules for each project you create
In order to use the Analysis Model Editor:
Click Models > Analysis Model Editor
Select a model to load its ruleset
The entire ruleset for the current model is displayed in table form, as shown below:

The Analysis Model Editor displaying the ruleset of the Software Analytics model
Use the filter pane and the table headers to find the rule you want to modify. You can activate or deactivate a rule by clicking the on/off switch in the table. If you want to make more modifications, cick the Edit icon for this rule.
You can edit multiple rules at once by checking several rules and using the actions list at the bottom of the page. When you save your changes, the configuration is reloaded and every new analysis for this model will use the new settings.
Changes made in the web interface are saved in the configuration folder on the server in a file called editor.xml.
Using the Analysis Model Editor, you can set up various ruleset templates to modify or ignore rules that do not apply for certain departments or project teams within your organisation.
Users with model edition privileges (see the Modify Models permission in the section called “User Profiles”) can define templates right from the Analysis Model Editor. Project managers can decide to modify existing templates or create new ones from the project wizard. In order to ensure that projects are analysed using company-wide standards, templates can be marked as approved, which prevents them from being modified by project managers.
In order to create a ruleset template:
Click on Models > Analysis Model Editor
Select an analysis model and locate the Template selection list above the filter tools. For a model where no templates exist yet, only the Duplicate As button is available so can can create a new template from the default one.

The ruleset template tools for a model with no custom templates yet
Click Duplicate As to create a new template and enter edit mode. In this example, we are creating a ruleset that contains only rules that apply to the Python programming language. By checking the Approved box, we are defining this ruleset template as read-only for project managers.

Creating a new python-rules ruleset template
Activate, deactivate or modify any rule you want for the template. In this example, we use the filter tools to select all Data Providers, turn off all the rules, and then select the Python-related Data Providers to activate all their rules

The python ruleset template includes the Pylint, pep8 and Squan Sources rulesets
When you are satisfied with your rule selection, click Save to save the template. It now appears in the template selection list. You can still modify it as needed, or click Duplicate As to start creating a new template based on your first template.

The saved python ruleset
Project managers can start using your template immediately by selecting it in the Ruleset Edition page of the project wizard, which is displayed after the Data Provider selection screen:

The template selection in the project wizard
Templates can also be applied to projects from the command line using the --rulesetTemplate parameter:
--rulesetTemplate="python-rules"
Project Managers may be interested in monitoring several projects as a whole. Squore provides a special dashboard view which compounds information about several projects into an analysis model dashboard, which can help you prioritise projects according to their current status.
In order to view the analysis model dashboard:
Log into Squore with the demo user.
Click the model name "Software Analytics" in the Project Portfolios.
The dashboard refreshes to show the compounded information for all projects analysed with this model using Quadrant charts and a summary table of the main indicators, the rating and the trend of each projects. and tables:

The analysis model dashboard for Software Analytics projects
In the quadrants, each project is represented as a bubble. Two indicators define the horizontal and vertical position of the bubble along the axes, while a third indicator defines the bubble size. Let's see how you should prioritise maintanance work on the your project portfolio for the sample projects. Click on the Complexity Volume Vs Cloning quadrant to view the full version:
In this chart, projects with a high code cloning ratio appear higher, while more complex projects appear more to the right. The size of each bubble indicates the size of the project in terms of source lines of code. Therefore, it may be easier to improve the quality of a project with a more cloning but less complexity like Pluto (dark green) than a project with less cloning but more complexity (Mars, in red) As a project manager, you know that as a general rule you need to focus on moving projects towards the bottom-left corner of the chart for a healthy portfolio of projects.
Below the quadrants, Squore displays tables with the values used in the charts so you can refine the information read in the charts. All the information shown in the analysis model dashboard can be configured by a Squore administrator. Refer to the Squore Configuration Guide for more information.
Table of Contents
The analysis results you obtained by creating your first projects in Chapter 4, Creating Projects and Versions and observed in Chapter 5, Understanding Analysis Results can be drilled down further by looking at the other tabs available in the Explorer. In this chapter, you will learn how to use the information contained in Indicators, Measures, Findings and Action Items to better understand and reuse the information provided by Squore in your development workflow.
If you need more background information about the measures and indicators used in the charts and tables in the dashboard, the Indicators, Measures and Findings tabs can provide more details about the statistics recorded for the current artefact. Note that these tabs are not displayed by default. If you want to show them in Squore, click the Explorer Settings menu and then Manage Tabs to display the Tab Manager to enable these tabs, as shown below:

The Manage Tabs option in the Explorer Settings allows to display the Tab Manager

The Tab Manager allows to display tabs hidden by default by checking them. Note that not according to your configuration, some tabs may not be removeable
If you want to understand the scale used for a particular indicator, to see for example how close you are to moving up the rating scale, you can check the scale used for this indicator in the Indicators tab of the dashboard.
Log in and search for the artefact DB5_backup.c in the Neptune project, where the indicator Maintainability Non-Conformity is rated E. While this tells you about the current rating for this artefact, this does not tell you how to improve it. In order to learn how to improve this score, let's first take a look at the scale used for this indicator. Click the Indicators tab of the Explorer. The table of indicators opens, as shown below:

The indicators table for DB5_backup.c
The table lists all the indicators available for the artefact over several pages. The scale and levels available for an indicator can be viewed in a tooltip by placing your mouse over a rating. Using the filter above the "name" column, look for the entry named Maintainability Non-Conformity, then click its value in the rating column. The scale for the indicator indicates that the artefact is rated E because the value of the indicator is 472.09. In order to improve the score, the value would need to decrease to under 250 to be rated D, as shown below:

The scale used for rating Maintainability Non-Conformity
To understand how to improve the rating, you need to know how the indicator's value is computed. Clicking the indicator name in the Indicator Tree shows the following explanation in the indicator popup:

The indicator popup for the Maintainability Non-Conformity indicator
The computation, i.e. the formula used to calculate the rating is
1000*(WEIGHTED_NC_MAI/ELOC), meaning that the indicator
computes a ratio of broken Maintainability rules.
To find out what these rules are, click the
Findings tab.
Squore displays all the findings for a particular artefact in a table in the Findings tab. Next to the finding's label is a number of occurrences followed by a colour-coded delta value (red for more occurrences, green for less) compared to a previous analysis.
If you want to find out which rules
are taken into account by the Maintainability Non-Conformity indicator, click the
>> button next to the default filter to show the advanced filtering options. Highlight Maintainability
in the ISO Characteristics filter to see the corresponding rules, as shown in the picture below:

The findings table for DB5_backup.c
You can filter violations according to many criteria, including relaxation status, origin, artefact type and other characteristics from the analysis model
The rules BWGOTO, STDIO, NOGOTO, RETURN and COMPOUNDIF are the rules that should be fixed in order to improve the Maintainability rating of DB5_backup.c.
You can expand the BWGOTO rule to show each occurrence of the rule being broken, and also review the location in the source code that breaks the rule, as shown below:

The location of the broken occurrences of the BWGOTO rule
The list of findings indicates if a finding is New, Closed or Modified since the reference version. Findings are traceable through time, so even if your code is modified, you can to go back to the version in which it was first detected.
Finally, clicking on the line number for each rule breaking occurrence opens the source code viewer in full screen so you can carry out your code review:
The source code viewer allows comparing the code against another version of the code. Select a version name in the Compare to: list to switch to diff mode, as shown below:

The source code viewer in diff mode
In diff mode, use the top arrows to switch the left and right panes, and the bottom arrows to turn synchronised scrolling on or off. Characters that were removed are underlined in green, while characters that were added are underlined in red.
Analysing findings helps improving the quality of the code in your project. There is much more you can do with the Findings tab by using the built-in filters to detect regressions and improvements:
Violations: displays all the rules violated in this version
Lost Practices: displays violations that are new in this version since a specified version
Acquired Practices: displays all violations not occurring anymore in this version since a previous version
Deteriorated Practices: displays all violations with more occurrences in this version than in a previous version
Improved Practices: displays all violations with less occurrences in this version than in a previous version
New violations: displays all the new violations since a previous version
Fixed violations: displays all the violations fixed since a previous version
All changed violations: displays all the rules where a change in the number of violations was detected, essentially providing the combination of New violations and Fixed violations in one list
All rules: displays all the rules checked by the model, i.e. the violated ones as well as the ones that are not
By default, the Findings tab displays violations compared to the previous analysis, but you can refine the search by adjusting the Reference drop-down list (under the Explorer Settings menu) that contains all the versions analysed in your project.
You can learn about more automated ways to review and fix code in the section called “How Do I Review And Manage Action Items Flagged by Squore?”.
You can click the Export button at the bottom of the list of findings, to generate a CSV file of the findings displayed in the user interface. The contents of the file reflect your current filter selections on the page. The following is a CSV export for the Findings of the Earth project, which you can download in full here.

A CSV export of the findings of the Earth project
If the Export button is greyed out, your licence does not include the option to export data to CSV files.
If you realise that a violation found during an analysis is not justified, you can relax it from the Findings tab of the Explorer.
In the example below, a we consider that a Backward goto violation should not be reported, because it is a false positive. Let's start by locating the violation in the Findings tab:

The backward goto violation we want to relax
When you hover over the menu icon for the violation, you can display a context menu that allows you to change the status of the finding:

The finding context menu
Click Change Status... to view the available statuses for the violation.

The Change Status Popup
Type a justification or comment for the relaxation and choose from one of the reasons for relaxing the violation:
Normal is the default status for new findings, which means no relaxation
Derogation means that you are relaxing a true violation for an exceptional reason
False positive can be used to work around a violation that was falsely detected by a data provider
Legacy system is used when a violation is detected in a piece of code that was analysed but cannot or will not be fixed.
In our example, select False Positive, enter a comment and click Change. The Findings page will reload and the violation will be gone from the list.

The updated findings list after relaxing the backwards goto
Relaxed findings are never deleted. If you want to review the list of findings that were relaxed in your project, adjust the filter on the Findings tab to display relaxed findings, as shown below;

The filtered list of findings for the project, including the backwards goto false positive
You can relax an individual finding, all findings for an artefact, or an entire rule at once. Note that instead of relaxing a rule.
Note that you can also relax artefacts from the Artefact Tree (see the section called “Relaxing Artefacts”) deactivate rules by using the Analysis Model Editor (see the section called “Analysis Model Editor”).
Squore provides a violation relaxation mechanism that is triggered via comments found in the source code itself. There are two pre-requisites for relaxation to work:
The model used to analyse your source code must implement a special rule called R_RELAX for relaxation to take place.
You need to know the mnemonic of the violated rule you want to relax, in order to use it as a key in your comment.
Squore interprets comments formatted in one of these three ways:
Inline Relaxation
This syntax is used to relax violations on the current line.
some code; /* %RELAX<keys> : Text to justify the relaxation */
Relax Next Line
This syntax is used to relax a violation on the first following line that is not a comment. In the example the text of the justification will be: "Text to justify the relaxation the text of the justification continues while lines are made of comments only"
/* >RELAX<keys> : Text to justify the relaxation */
/* the text of the justification continues while */
/* lines are made of comments only */
some code;
Block Relaxation
This syntax is used to relax violations in an entire block of code.
/* {{ RELAX<keys> : Text to justify the relaxation */
/* like for format 2 text can be on more than one line */
int my_func() {
   /* contains many violations */
   ...
}
/* }} RELAX<keys> */
<keys> can be one of the following:
<*>: relax all violations
<MNEMO>: relax violations of the rule MNEMO
<MNEMO1,MNEMO2,...,MNEMOn>: relax violations of rules MNEMO1 and MNEMO2 ... and MNEMOn
The relaxed violations are still shown in the Findings page after the next analysis, but they appear under the rule R_RELAX, showing the mnemonic of the relaxed violation and the justification text.
As an example, this is how you would relax the violations of the rule Backward goto for Maintainability Non-Conformity in Neptune:
click the violation of Backward goto on the Findings page to find the rule's mnemonic (BWGOTO) and the location of the finding (DB5_backup.c line 52).

The details of the Backward goto violation
Edit the code of the sample project to relax the violation as shown below.
goto loopwrite; /* %RELAX<BWGOTO> : This backward goto is acceptable in our code. */
Create a new version of the project.
On the Findings page, the violation now visible if you select to display derogations in the filter:

The relaxed violation is visible when displaying derogations
In this section, you will learn how to relax artefacts directly from the Artefact Tree instead of relaxing violations by editing the source code of the application. Relaxing artefacts ensures that their metrics do not impact the rating of the project, however, data providers will still generate findings for the relaxed artefacts.
This example uses the Mars project from the samples folder. Ensure that you are a Project Manager in this project, or are part of a role with the View Drafts of Projects and Modify Artefacts privileges before you begin.
Expand the Project Portfolios to show all the versions of Mars. There are two versions in the tree (from bottom to top):
For more information about the concepts behind baseline and draft versions, refer to the section called “Working with Draft and Baseline Versions”.
Click on Mars > Current to see the artefacts in the Mars project as created by the demo script:

The artefacts in the Current version of the Mars project and their rating
To relax an artefact and therefore tell Squore that its rating should not impact the rest of the project, display the context menu for this artefact. The relaxation options appear at the bottom of the menu if they are available for your model, as shown below:

The artefact context menu
There are two actions that can be taken to relax an artefact:
Relax... allows simply marking an artefact as relaxed, leaves it in the tree in a way that will not impact the overall rating of the project.
Exclude... also relaxes the artefact but then removes it from the Artefact Tree so it will not be visible anymore in future analyses.
In both cases, the relaxation action is only made on a draft version and can be reversed by selecting the Un-relax... entry in the menu or the Clear unapplied changes option in the project portfolio.
Clicking Relax... or Exclude... brings up a pop-up menu where you can type
a comment to explain the reason for the relaxation. Let's relax mars_common.c so it stops impacting the
overall project rating. Click the Relax... option in the menu to display the relaxation
popup and enter a relaxation comment:

The relaxation justification
Click Confirm to save your comment, and notice how the Artefact Tree is updated to reflect the finding's status:

The relaxed mars_common.c in the Artefact Tree
Other users can review the justification for the relaxation by clicking on the Log... item in the artefact context menu:

The log of changes for the artefact mars_common.c
If you keep relaxing artefacts in this project and create a new draft build of the project, then you will end up seeing changes in the overall rating,
When you relax an artefact, the action items and findings relevant to this artefact are hidden, except when you specifically click on the relaxed artefact. If you want to show them, you can do so by clicking the Include Relaxed Artefacts option from the Explorer Settings menu.
You can show or hide relaxed and excluded artefacts by checking the boxes with the appropriate status in the filter popup:

The artefact statuses shown by default in the Artefact Tree
If you notice that a violation in the code or an issue in the project was not detected during an analysis, you can decide to create a finding manually from the Artefact Tree.
This feature, like the creation of manual artefacts (see the section called “Adding and Removing Artefacts Manually”) is only available if your model was configured to support it. Consult your Squore administrator to verify if it is available in your configuration.
In this example, we add a finding to notify of a documentation issue in the Neptune project. Click on the Current version of the project, and display the context menu for the artefact where you consider that the documentation is wrong.

When you click the Add a finding... option, a dialog appears and lets you select the type of finding to add, as well as a description of the issue:

Click Add to save the finding. You can check that it was added successfully in the Findings tab of the Explorer:

Manual findings are displayed automatically in the Findings tab like other findings. If you want to filter them, use the advanced filter and select or exclude [Manual] in the Data Provider category.
Like regular findings, yout finding also displays in the source code viewer, as show below:

Squore lets you view and edit project attributes in a dedicated form tab of the explorer. You can therefore design your wizards to present checklists to a user. They can fill in the values manually after an analysis and they will be taken into account when creating the next version of the project. There are permissions associated with editing form values, so you can make them read-only for guests but read-write for project managers. The attributes displayed on the Forms tab depend on the type of the current artefact, and values are saved individually for each artefact in the project.
To begin working with forms, make sure you select the Current version of the project in the tree and that the Forms tab is visible in the Explorer.
When you click a project in the Project Portfolios and view the Forms tab of the Explorer, all the project attributes available at application level are displayed, as shown below:

The Forms tab for the Neptune project at application level
The values displayed correspond to the application attributes passed when the last version of Neptune was created. Users with the whose role grants them the Modify Artefacts Attributes privilege can edit the current value of the form for any artefact, and the value will be taken into account during the next analysis.
When you modify the values in the form, you can use the comment field to justify the change you made. A history of the modifications can be displayed by expanding the attribute field, as shown below

A history of modifications for the Test Coverage attributes
If you have doubts about the measures computed by Squore and their meaning, they can usually be solved by looking at the Measures tab of the Explorer. The content of the measures tab is also always refreshed to reflect the data for the current artefact, and is organised in a table displaying the measure's mnemonic, full name, description and value for the current selection, as shown in the picture below.

The table of measures for the DB5_backup.c
Measures can be sorted by mnemonic, name, description or value, and the sorting value is remembered when selecting another artefact in the tree so you can easily compare values.
The table also tells you which Data Provider reported the metric and its status in the latest analysis, so you can determine if a metric was computed or has its default value from the analysis model. The possible status values are:
Default Value: This measure has the default value defined in the analysis model
Ok: A value was computed successfully for this measure
User-defined: The value was set by the user (either via a tag on the command line or in the Forms tab of the web UI)
Definition error: The value could be computed because of an error in the analysis model. Check the Model Validator to learn more.
Incomplete: The value could not be computed because of an error (maybe a division by zero?). The analysis model should probably be updated to avoid this in the future. This error is also available in the project's build.log.
Warning: The value could not be computed, but there is nothing wrong with the measure definition in the analysis model. Maybe you are trying to do a COUNT on descendants but there are no descendants? In such cases, the error is not serious, but you can improve your analysis model to handle the warning if needed.
-: This measure was not found in the project. It did not exist at the time of the analysis.
Unknown: An unexpected error happened computing the measure's status
In all error statuses above, the metric is assigned the default value defined in the analysis model.
Searching for issues in your applications can be a manual process, as explained in the section called “How do I understand and Improve My Ratings?”, but the analysis and decision models configured within Squore can automate this process by automatically suggesting items that require your attention after analysing the latest version of your code. This functionality can be accessed as part of the Explorer, in the Action Items tab. In this section, you will learn how to review Squore's suggestions and incorporate them into your own issue management tool.
Note that in order to change the status of action item, you must be working with the current draft version of a project. In order to follow the steps below, ensure that you select the current version of the Earth project, click on the Action Items tab. A list of action items suggested by Squore appears in a table, as shown in the picture below:

The action items table for the current version of the Earth project
You can filter action items if needed by using the filters above the table. The name given by Squore to the action item is the name defined in your analysis model for this alert. Priorities are also predefined, and your input is needed to validate or invalidate the reports based on your priorities.
In the action items list, 8101 is critical, therefore its
status should be changed to Todo.
If you are unsure about a report, you can click the action item ID to display the full details, which includes the location(s) in the source code that triggered the alert:

Action Item details for 8089
You can review the code in a popup window before you decide to fix or relax the action item.
Finally, you can export the action items generated by Squore and feed them into your own issue tracker: Select the export format you want to use (CSV, ClearQuest, Mantis, XML, or any other custom format you defined in your configuration) and click the Export button to download the list to a file. You can also add all artefacts that triggered an action item to your Review Set by clicking the appropriate button.
If the Export button is greyed out, your licence does not include the option to export data to CSV files.
The Capitalisation provides statistics aggregates, distribution graphics and correlation coefficients across a portfolio of projects. To begin using the Capitalisation to understand historical trends about your projects and find out if your analysis models are suited to your development style, click the Capitalisation menu item in the Squore toolbar.

The Capitalisation Projects tab
In the projects tab, choose the projects that will be used to aggregate statistics. In the example below, we will look at statistics for the Earth and Mars projects, which both use the same analysis model and have similar overall ratings. Select Earth and Mars from the list and click the Statistics Aggregates.
The Statistics Aggregates tab offers an overview of all your projects' data by providing minimum, maximum, average, number of occurrences, deviation, mod, sum and median results. Results are based on all the measures of an artefact type. This means that you have to specify an artefact type before any data is displayed.

The Capitalisation Base Statistics Aggregates at Application level
The Distribution tab
offers the possibility to display any kind of distribution. The distribution is based on
a measure of an artifact type. As a result, you have to select both an Artefact type and
a Measure before you see any results. Note that you can change the parameters of the distribution graph
by adjusting the number of bars, and the minimum and maximum values for the axes. The picture below shows the distribution
of lines of code (a measure called LC) across all artefacts of type FILE for Mars
and Earth.

The Capitalisation Base Distribution Graph for lines of code per file
The Correlation tab displays the matrix of correlation of any data stored in the Squore database. Correlations are computed between artefacts of the same type, so you have to select the artefact type before any data is displayed. Squore highlights cells in the table in which correlations are above the threshold defined by moving the slider or entering a correlation coefficient directly in the text box provided. You can choose to include derived data by checking the box above the matrix table.

The Capitalisation Base correlation table for files measures with a highlighting threshold of 0.8
Base measures are the ones directly reported by various tools included in the analysis. Derived measures are metrics computed based on these base measures or other derived measures.
You can choose to export the results of the correlation matrix to a CSV file. The resulting CSV file contains all metrics pairs for which a correlation exists.
If the Export button is greyed out, your licence does not include the option to export data to CSV files.
By clicking on Favourites in the main menu bar, you can view all the charts you marked as favourite in the dashboards across all of your projects. You can group charts into lists and reorder them as you see fit. The charts you mark as favourites are also the ones that are accessible to view on your mobile devices when away from your desk. This section covers everything you need to know about favourites and Squore's mobile interface: Squore Mobile.
Each of the chart thumbnails has a star ( ) icon that you can click to mark a chart as favourite.
Clicking a star icon opens the chart viewer on the Favourites tab, as shown below:

Adding a favourite in the chart viewer
The popup allows you to:
Type a custom title and description for your chart so that you can for example write down why you are monitoring it.
Select a list of favourites to add the chart to. By default, your charts are added to a list called Unsorted Favourites. You can create more lists and move charts between lists from the Favourites page.
Select a version of the chart to display. The latest version is selected by default (Last Version), but you can alternatively select the exact version you clicked on (Current Version), or the latest baseline(Last Baseline).
When you are satisfied with your choices, click on Save to add the chart to your favourites. You can add charts from any project you have access to.
Refer to the next section to learn how to view and manage the charts you saved as favourites.
All the charts you added from the Explorer were added to a list called Unsorted Favourites. You can delete this list and create other lists using the  and
and  icons.
When you have more than one list, you can drag and drop charts between lists.
In order to see the full size of a chart you marked as favourite, click its thumbnail on the left pane to open it in the right pane. The screenshot below shows an example of a list of favourites and a maximised chart. Note that the right pane contains links that allow you to go back to the project's or artefact's dashboard directly.

The full Favourites page
The list of charts you marked as favourites in Squore is the list of charts you can access via Squore Mobile
Squore Mobile is a touch-friendly interface for Squore that is accessible from http://localhost:8180/SQuORE_Server/Mobile.

Squore Mobile
When you log into Squore Mobile, you can swipe through all the charts you added to your favourite lists from your mobile device.
Table of Contents
Squore allows tracking your progress by setting milestones, which consist of a series of goals for specific metrics at certain dates in the life of your project. In this chapter, you will learn how to set up these goals and how to read dashboard charts that show deviations from these goals or changes in your project milestones.
Not all models support milestones, but if yours does, you will see a Milestones pane on the first page of the project wizard. The Milestones pane is where you can see the existing milestones for a project, with their associated goals and dates.

The Milestones pane in the project wizard
In the example above, our model defines 5 milestones (SPRINT1 to SPRINT5) for the lifecycle of our project.
Each milestone has a set date and defines goals for the following key performance indicators in our project:
Critical Issues
Self Descriptiveness
Coding Standard Compliance
Major Issues
Technical Debt
Blocker Issues
The Milestones pane allows you to change the dates and goals for your project. If a milestone is optional and is not relevant for your project, you can remove it by clicking the x next to its name. This is possible for all the milestones in our example above. By clicking the + icon to the right of the last milestone, you can create a new milestone for the project and define your own goals. You can also add a new goal for your project by selecting a metric from the list at the bottom of the table and clicking the + icon.
When you are satistied with the milestones set for your project, click the Next button to continue with the creation of the project.
Goals and dates can be modified every time you create a new version of the project if you decide that your schedule slips. Goals and dates are versioned, so your dashboard can always show you when in the timeline of your project you decided to change your milestones.
When you consult the dashboard of a project that uses milestones, the functionality allows you to:
Display the goals defined for each milestone in your project
Display the changes made to the goals defined for each milestone
Display the date changes for your milestones
Show markers for milestone dates and goals
The following is an example of a chart that mixes objectives, projected performance and milestone date changes:
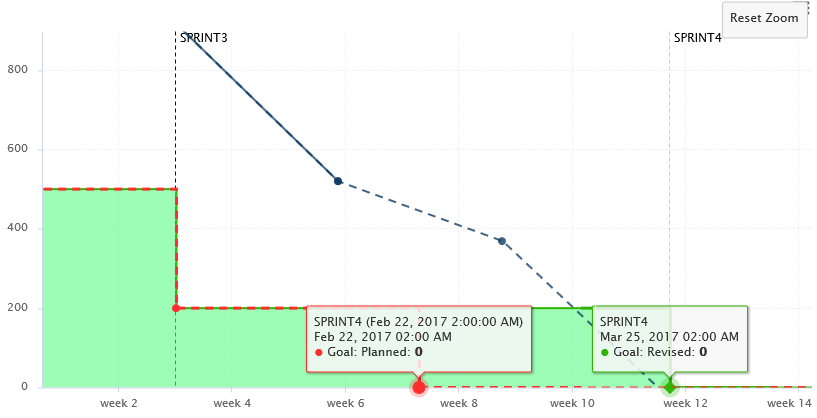
A chart tracking your technical debt progress, projected performance, goals and milestone date slips
Some action items on your model can also take advantage of this feature to warn you about poor performance:
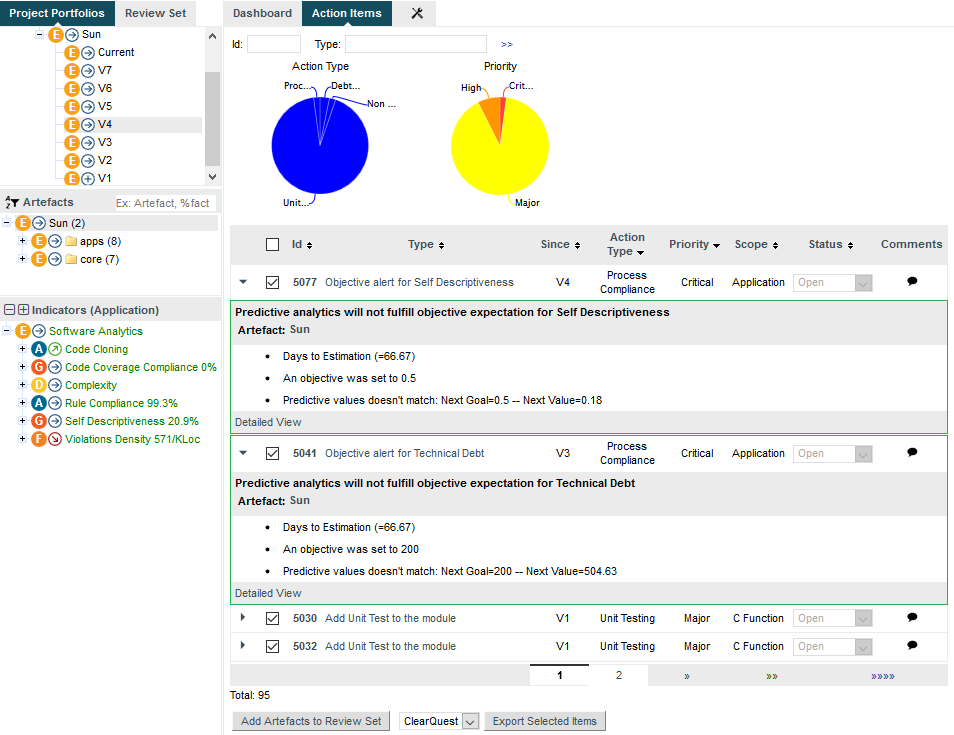
Action items based on milestone dates and goals
For more information on how you can improve your model with milestones and the above chart and action items, refer to Appendix B, Milestones Tutorial and the Configuration Guide.
Table of Contents
Squore allows posting comments about charts, artefacts, action items and findings. Users in a project team can view and reply to comments when they notice that a discussion thread has received new posts since their last visit. You can also choose when a discussion no longer accepts comments or is removed from the project. In this section, you will learn the basics of commenting all around the dashboard.
Every chart on your dashboard shows a speech bubble icon next to its title, as shown in the picture below:

A chart thumbnail showing a speech bubble icon
Clicking the icon brings up the chart viewer on the comment tab, in which you can confirm which chart you are commenting on and type your comment.

Typing a comment in the chart viewer
When you click Add, your comment is saved, and you can reply or add another comment.

The Comment pop-up after adding your first comment
When you close the pop-up, notice that the speech bubble icon next to the chart you commented changes to indicate that a discussion about this item has been started.

A chart thumbnail with a discussion indicator
In the Action Items tab, you bring up the comment pop up by clicking the speech bubble in the Comments column of the table. Links allow you to jump to the Action Item's detailed description, the application level dashboard or the artefact dashboard directly.

A comment thread initiated about an Action Item
On the Findings tab, each violation shows a comment icon that you can click to start a discussion.

A comment thread initiated about an finding
As on the Dashboard and Action Items tabs, the comment icon indicates whether a discussion has been started about a violation.

An ongoing discussion on the Findings tab
You can start discussions on artefacts by clicking Comment... item in the artefact action menu, as shown below:

The artefact context menu item to bring up the comment pop-up for artefacts
When you log in to Squore, you can find out which discussions have new comments by looking at the items that show the New Comment! icon:

You have unread comments in the discussion about this chart
In the discussion pop-up, new comments since your last visit are highlighted:

A reply to my comment appears in bold
You can also get an exhaustive view of all the discussions for the project by viewing them in the Comments tab in the Explorer:

Overview of discussions about a project in the Comments tab
From this view, discussions can be set to one the following statuses:
Open: New comments are accepted in this discussion
Closed: No new comments are accepted in this discussion, and it will be deleted in the next analysis
Locked: No new comments are accepted in this discussion, but the discussion thread will be saved for the next analyses
Any user in the project team can view and take part in all open conversations in the project.
While you review results and comments, you can add artefacts manually to your project as needed. To add an artefact, make sure you are on the Current version of the project and click the node to which you want to add a child artefact. If this node supports adding artefacts, the Add an Artefact option will be available in the menu:

The artefact context menu with the Add an Artefact option highlighted
Click the menu and choose an artefact type and an artefact name to add the artefact to the tree.
The type of artefact you can add depends on the model you are using. The model also defines where in the tree the new artefacts can be added.
Here is what the Artefact Tree looks like after manually building a test plan tree:

The artefact tree with manual artefacts not yet rated
When you run a new analysis of the project, the new artefacts will get rated according to what is defined in your model.
Artefacts that were added manually can also be deleted from the tree. Note that artefact edition is tied to a permission in a user's role within a project. To learn more about roles, refer to the section called “User Roles”
You can generate reports and export data to csv with Squore so you can communicate your progress to others.
In order to create a report, for the currently selected artefact in the tree, click the Reports tab in the Explorer. The Reports page opens as shown in the picture below:

The Reports page
The Reports tab offers a choice of report and export types in various output formats. Reports are primarily used to present information visually including charts and data about action items, findings and relaxed artefacts. The output formats currently supported are .pdf, .pptx, .docx.
Reports can be created in full or synthetic view. The synthetic view omits details about the exact location of violations in the code in the report, but provide a link to read the full details in the Squore web interface. The screenshots below show the difference between a synthetic report and a full report. The availability of the full report depends on your licence.

Details about action items in a synthetic report

Details about action items in a full report
Exports can be used to extract information in a CSV file in order to import it into another tool. Clicking the Create button generates and downloads the file in your browser. Note that the availability of the export feature depends on your licence.
The following is an example of CSV export file obtained by launching the Project Portfolio export at model-level to get details :

The Project Portfolio export lists all ratings for projects in a specific analysis model
Reports and Exports are highly customisable, consult your Squore administrator or refer to the Squore Configuration Guide to learn more about how to tweak the report contents or format.
When you create a project, you become its owner, and remain the only user who can view it in Squore by default. In order to make it visible to more users, the project owner has to create a project team of users and groups and assign them roles. This is done in the Manage page of a project in the Team tab, as shown below:
The Team tab
The project scope can be set directly from the command line when creating a new project, if you use the teamUser and teamGroup options. For more details, refer to the Command Line Interface manual.
In order to give visibility to the user admin over the projects created by the user demo, follow these steps:
Log in as the demo user and go to the Projects page.
Click the Manage icon ( ) for the project Earth
Click on the Team tab to view the project team.
Type admin in the Select a Group or a User. The list
will show all users ( )
and groups (
)
and groups ( )
available matching the search term.
)
available matching the search term.

The users and groups matching admin
Click the admin user to add it to the project team.
Now that admin is listed in the project team, you need to pick a role for the user within this project. Select Guest from the list.

The roles available for the user in this project
This predefined role allows a user to consult the results of baseline versions of a project without making any changes. For more information about roles, consult the section called “Understanding Profiles and Roles”.
Click Apply to apply your changes.
The admin user can now log in and will see the Earth project in their Explorer.
If you want to configure the rest of the sample projects the way you configured Earth, you can copy the project team to another project:
Click on Manage > Team for the project Mars
Select Earth from the Load from Project dropdown and click Load.
The users and their roles have now been copied as they were set up in the Earth project. You can make adjustments or click Apply to confirm your changes.
A Squore administrator may allow you browse a list of projects created by other users so you can contact them and request to be added to their project's team. When this feature is enabled, you can click the Ask access to Project Owners button on the Projects page to view a list of projects that other users have created, as shown below:

The list of available projects on the server and their owners
If you want to become a team member of one of the projects listed, click the project owner's e-mail address to send them a message and request to be added to their project's team.
If the Ask access to Project Owners button is not displayed on the Projects page, contact your Squore administrator to set up access following the instructions provided in the Installation and Administration Guide.
You can configure each project in Squore so that an e-mail notification is sent out after a new version is created. This functionality is available for users who can create and manage projects, either in the General Information section of the project wizard, or the in the Project Properties tab of the Manage Project page:

E-mail notification options in Manage Project
The conditions on which you can to trigger an e-mail are:
On draft: sends an e-mail every time a draft version is successfully analysed.
On baseline: sends an e-mail every time a baseline version is successfully analysed, or every time a draft version is baselined.
On error: sends an e-mail every time an analysis ends with the Warnings or Error status.
The e-mail contains a description of the version, the number of new artefacts, the number of action items, a list of the new action items and the number of new findings.
You can get information on how your collaborators are viewing the projects you manage or the models you develop by using the statistics features of Squore. This section describes the information available to project managers and model developers via Models > Statistics and the Manage Project page.
As a project manager, you can use project statistics to investigate the popularity of your project by going to Manage > Statistics.

When you select a reporting period, the following information is displayed:
The trend of the number of views for this project uses the colours from the scale of the root indicator as background to help you correlate the project rating with the number of visits.
The treemap helps you understand which of the dashboard tabs is the most visited for this project.
A table summarises the breakdown of views per user, as well as the number of comments left by each user.
You can learn more about the usage of particular features of a model by clicking Models > Statistics. For each analysis model, find out how many users consult results, which projects are the most popular and which regions and charts of the dashboard are the most useful for users.

The Users tab displays the information about the number of users and overall connections to the server for projects in this analysis model.

The Dashboard tab allows analysing the usage of each tab on the dashboard. Each tab is represented in a treemap according to how many views it receives. This information can be used to adjust the default display status of each tab or their availability to end users.
Table of Contents
You can delete or rename one or more of the last versions of a project if needed. This can be done from the Projects page if you are the project creator or are a member of a role that allows managing the project.
If you want to manage the previous analyses of the Earth project,
log in as the demo user and click Projects. Click the Manage icon
()
and open the Versions tab to view the list of versions created for this project:
The Versions of the Earth project
The most recent version always appears at the top of the list.
By clicking the pen icon next to the version name, you can rename this analysis. Your changes will immediately be reflected in the Project Portfolios.
In order to delete an analysis, check the box next to the version you want to delete. All versions created after the version you selected will also be checked. Click the Delete button to reach a summary page where you can confirm which versions will be deleted, and click Confirm to launch the delete process.
If you select to delete all the versions of a project, the entire project will be deleted.
Projects can be deleted by their creator or members of a role that allows to manage projects. In order to delete a project,
click Projects and click the
delete icon ( ) next to the project you want to delete. After confirming the operation, the project is deleted from
the Squore database and cannot be restored.
) next to the project you want to delete. After confirming the operation, the project is deleted from
the Squore database and cannot be restored.
A Squore Administrator can access functionality that does not involve working with projects directly. You can access the Administration menu if you need to perform any of the following tasks:
Create, update, remove and deactivate Squore users (Administration > Users)
Create, update, and remove groups (Administration > Groups)
Create, update, and remove profiles (Administration > Profiles)
Create, update, and remove roles (Administration > Roles)
Configure and monitor the Squore Server installation (Administration > System)
View and manage all projects created on Squore Server (Administration > Projects)
Reload the server configuration from disk (Administration > Reload Configuration)
download the server log (Administration > Server Log)
For more information about administration functionality, consult the Online Help.
Table of Contents
The simplest method to analyse source code in Squore is to provide a path to a folder contining your code.
Remember that the path supplied for the analysis is a path local to the machine running the analysis, which may be different from your
local machine. If you analyse source code on your local machine and then send results to the server, you will not be able to view the
source code directly in Squore, since it will not have access to the source code on the other machine. A common workaround to
this problem is to use UNC paths (\\Server\Share, smb://server/share...) or a mapped server drive
in Windows.
This Repository Connector allows you to upload a zip file containing your sources to analyse. Select a file to upload in the project wizard and it will be extracted and analysed on the server.
The contents of the zip file are extracted into Squore Server's temp folder. If you want to uploaded files to persist, contact your Squore administrator so that the uploaded zip files and extracted sources are moved to a location that is not deleted at each server restart.
The Concurrent Versions System (CVS), is a client-server free software revision control system in the field of software development.
For more details, refer to http://savannah.nongnu.org/projects/cvs.
The following is a list of commands used by the CSV to retrieve sources:
cvs -d $repository export [-r $branch] $project
cvs -d $repository co -r $artefactPath -d $tmpFolder
CVS has the following options:
Repository (repository, mandatory) Specify the location of the CVS Repository.
Project (project, mandatory) Specify the name of the project to get files from.
Tag or Branch (branch) Specify the tag or branch to get the files from.
The full command line syntax for CVS is:
-r "type=CVS,repository=[text],project=[text],branch=[text]"
IBM Rational ClearCase is a software configuration management solution that provides version control, workspace management, parallel development support, and build auditing. The command executed on the server to check out source code is: $cleartool $view_root_path $view $vob_root_path.
For more details, refer to http://www-03.ibm.com/software/products/en/clearcase.
The ClearCase tool is configured for Linux by default. It is possible to make it work for Windows by editing the configuration file
ClearCase has the following options:
View root path (view_root_path, mandatory, default: /view) Specify the absolute path of the ClearCase view.
Vob Root Path (vob_root_path, mandatory, default: /projets) Specify the absolute path of the ClearCase vob.
View (view) Specify the label of the view to analyse sources from. If no view is specified, the current ClearCase view will be used automatically, as retrieved by the command cleartool pwv -s.
Server Display View (server_display_view) When viewing source code from the Explorer after building the project, this parameter is used instead of the view parameter specified earlier. Leave this field empty to use the same value as for view.
Sources Path (sub_path) Specify a path in the view to restrict the scope of the source code to analyse. The value of this field must not contain the vob nor the view. Leave this field empty to analyse the code in the entire view. This parameter is only necessary if you want to restrict to a directory lower than root.
The full command line syntax for ClearCase is:
-r "type=ClearCase,view_root_path=[text],vob_root_path=[text],view=[text],server_display_view=[text],sub_path=[text]"
The Perforce server manages a central database and a master repository of file versions. Perforce supports both Git clients and clients that use Perforce's own protocol.
For more details, refer to http://www.perforce.com/.
The Perforce repository connector assumes that the specified depot exists on the specified Perforce server, that can access this depot and that the Perforce user defined has the right to access it. The host where the analysis takes place must have a Perforce command-line client (p4) installed and fully functional. The P4PORT environment variable is not read by . You have to set it in the form. The path to the p4 command can be configured in the perforce_conf.tcl file located in the configuration/repositoryConnectors/Perforce folder. The following is a list of commands used by the Perforce to retrieve sources:
p4 -p $p4port [-u username] [-P password] client -i <$tmpFolder/p4conf.txt
p4 -p $p4port [-u username] [-P password] -c $clientName sync "$depot/...@$label"
p4 -p $p4port [-u username] [-P password] client -d $clientName
p4 -p $p4port [-u username] [-P password] print -q -o $outputFile $artefactPath
The format of the p4conf.txt file is:
Client: $clientName
Root: $tmpFolder
Options: noallwrite noclobber nocompress unlocked nomodtime normdir
SubmitOptions: submitunchanged
view:
  $depot/... //$clientName/...
Perforce has the following options:
P4PORT (p4port, mandatory) Specify the value of P4PORT using the format [protocol:]host:port (the protocol is optional). This parameter is necessary even if you have specified an environment variable on the machine where the analysis is running.
Depot (depot, mandatory) Specify the name of the depot (and optionnally subforders) containing the sources to be analysed.
Revision (label) Specify a label, changelist or date to retrieve the corresponding revision of the sources. Leave this field empty to analyse the most recent revision fo the sources.
Authentication (useAccountCredentials, default: NO_CREDENTIALS)
Username (username)
Password (password)
The full command line syntax for Perforce is:
-r "type=Perforce,p4port=[text],depot=[text],label=[text],useAccountCredentials=[multipleChoice],username=[text],password=[password]"
Git is a free and open source distributed version control system designed to handle everything from small to very large projects with speed and efficiency.
For more details, refer to http://git-scm.com/.
The following is a list of commands used by the Git to retrieve sources:
git clone [$username:$password@]$url $tmpFolder
git checkout $commit
git log -1 "--format=%H"
git config --get remote.origin.url
git clone [$username:$password@]$url $tmpFolder
git checkout $commit
git fetch
git --git-dir=$gitRoot show $artefactPath
Git has the following options:
URL (url, mandatory) URL of the git repository to get files from. The local, HTTP(s), SSH and Git protocols are supported.
Branch or commit (commit) This field allows specifying the SHA1 of a commit or a branch name. If a SHA1 is specified, it will be retieved from the default branch. If a branch label is specified, then its latest commit is analysed. Leave this field empty to analyse the latest commit of the default branch.
Sub-directory (subDir) Specify a subfolder name if you want to restrict the analysis to a subpath of the repository root.
Authentication (useAccountCredentials, default: NO_CREDENTIALS)
Username (username)
Password (password)
The full command line syntax for Git is:
-r "type=Git,url=[text],commit=[text],subDir=[text],useAccountCredentials=[multipleChoice],username=[text],password=[password]"
This Repository Connector allows analysing sources hosted in PTC Integrity, a software system lifecycle management and application lifecycle management platform developed by PTC.
For more details, refer to http://www.ptc.com/products/integrity/.
You can modify some of the settings of this repository connector if the si.exe and mksAPIViewer.exe binaries are not in your path. For versions that do not support the --xmlapi option, you can also turn off this method of retrieving file information. These settings are available by editing mks_conf.tcl in the repository connector's configuration folder.
PTC Integrity has the following options:
Server Hostname (hostname, mandatory) Specify the name of the Integrity server. This value is passed to the command line using the parameter --hostname.
Port (port) Specify the port used to connect to the Integrity server. This value is passed to the command line using the parameter --port.
Project (project) Specify the name of the project containing the sources to be analysed. This value is passed to the command line using the --project parameter.
Revision (revision) Specify the revision number for the sources to be analysed. This value is passed to the command line using the --projectRevision parameter.
Scope (scope, default: name:*.c,name:*.h) Specifies the scope (filter) for the Integrity sandbox extraction. This value is passed to the command line using the --scope parameter.
Authentication (useAccountCredentials, default: NO_CREDENTIALS)
Username (username)
Password (password)
The full command line syntax for PTC Integrity is:
-r "type=MKS,hostname=[text],port=[text],project=[text],revision=[text],scope=[text],useAccountCredentials=[multipleChoice],username=[text],password=[password]"
Team Foundation Server (TFS) is a Microsoft product which provides source code management, reporting, requirements management, project management, automated builds, lab management, testing and release management capabilities. This Repository Connector provides access to the sources hosted in TFS's revision control system.
For more details, refer to https://www.visualstudio.com/products/tfs-overview-vs.
The TFS repository connector (Team Foundation Server - Team Foundation Version Control) assumes that a TFS command-line client (Visual Studio Client or Team Explorer Everywhere) is installed on the server and fully functional. The configuration of this client must be set up in the tfs_conf.tcl file. The repository connector form must be filled according to the TFS standard (eg. the Project Path must begin with the '$' character...). Note that this repository connector works with a temporary workspace that is deleted at the end of the analysis. The following is a list of commands used by the TFS to retrieve sources:
tf.exe workspace [/login:$username,$password] /server:$url /noprompt /new $workspace
tf.exe workfold [/login:$username,$password] /map $path $tempFolder /workspace:$workspace
tf.exe get [/login:$username,$password] /version:$version /recursive /force $path
tf.exe workspace [/login:$username,$password] /delete $workspace
tf.exe view [/login:$username,$password] /server:$artefactPath
When using the Java Team Explorer Everywhere client, / is replaced by - and the view command is replaced by print.
TFS has the following options:
URL (URL, mandatory) Specify the URL of the TFS server.
Path (path, mandatory) Path the project to be analysed. This path usually starts with $.
Version (version) Specify the version of the sources to analyse. This field accepts a changeset number, date, or label. Leave the field empty to analyse the most recent revision of the sources.
Authentication (useAccountCredentials, default: NO_CREDENTIALS)
Username: (username)
Password (password)
The full command line syntax for TFS is:
-r "type=TFS,URL=[text],path=[text],version=[text],useAccountCredentials=[multipleChoice],username=[text],password=[password]"
Rational Synergy is a software tool that provides software configuration management (SCM) capabilities for all artifacts related to software development including source code, documents and images as well as the final built software executable and libraries.
For more details, refer to http://www-03.ibm.com/software/products/en/ratisyne.
The Synergy repository connector assumes that a project already exists and that the Synergy user defined has the right to access it. The host where the analysis takes place must have Synergy installed and fully functional. Note that, as stated in IBM's documentation on http://pic.dhe.ibm.com/infocenter/synhelp/v7m2r0/index.jsp?topic=%2Fcom.ibm.rational.synergy.manage.doc%2Ftopics%2Fsc_t_h_start_cli_session.html, using credentials is only supported on Windows, so use the NO_CREDENTIALS option when Synergy runs on a Linux host. The following is a list of commands used by the Synergy to retrieve sources:
ccm start -d $db -nogui -m -q [-s $server] [-pw $password] [-n $user -pw password]
ccm prop "$path@$projectSpec"
ccm copy_to_file_system -path $tempFolder -recurse $projectSpec
ccm cat "$artefactPath@$projectSpec"
ccm stop
Synergy has the following options:
Server URL (server) Specify the Synergy server URL, if using a distant server. If specified, the value is used by the Synergy client via the -s parameter.
Database (db, mandatory) Specify the database path to analyse the sources it contains.
Project Specification (projectSpec, mandatory) Specify the project specification for the analysis. Source code contained in this project specification will be analysed recursively.
Subfolder (subFolder) Specify a subfolder name if you want to restrict the scope of the analysis to a particular folder.
Authentication: (useAccountCredentials, default: NO_CREDENTIALS) Note that, as stated in IBM's documentation, using credentials is only supported on Windows. The "No Credentials" must be used option when Synergy runs on a Linux host. For more information, consult http://pic.dhe.ibm.com/infocenter/synhelp/v7m2r0/index.jsp?topic=%2Fcom.ibm.rational.synergy.manage.doc%2Ftopics%2Fsc_t_h_start_cli_session.html.
(name)
Password (password)
The full command line syntax for Synergy is:
-r "type=Synergy,server=[text],db=[text],projectSpec=[text],subFolder=[text],useAccountCredentials=[multipleChoice],name=[text],password=[password]"
Connecting to an SVN server is supported using svn over ssh, or by using a username and password.
For more details, refer to https://subversion.apache.org/.
The following is a list of commands used by the SVN to retrieve sources (you can edit the common command base or the path to the executable in /repositoryConnectors/SVN/svn_conf.tcl if needed):
svn info --xml --non-interactive --trust-server-cert --no-auth-cache [--username $username] [--password $password] [-r $revision] $url
svn export --force --non-interactive --trust-server-cert --no-auth-cache [--username $username] [--password $password] [-r $revision] $url
SVN has the following options:
URL (url, mandatory) Specify the URL of the SVN repository to export and analyse. The following protocols are supported: svn://, svn+ssh://, http://, https://.
Revision (rev) Specify a revision number in this field, or leave it blank to analyse files at the HEAD revision.
External references (externals, default: exclude) Specify if when extracting sources from SVN the system should also extract external references.
Authentication (useAccountCredentials, default: NO_CREDENTIALS)
Username (username)
Password (password)
The full command line syntax for SVN is:
-r "type=SVN,url=[text],rev=[text],externals=[multipleChoice],useAccountCredentials=[multipleChoice],username=[text],password=[password]"
Squore allows using multiple repositories in the same analysis. If your project consists of some code that is spread over two distinct servers or SVN repositories, you can set up your project so that it includes both locations in the project analysis. This is done by labelling each source code node before specifying parameters, as shown below
-r "type=FROMPATH,alias=Node1,path=/home/projects/client-code"
-r "type=FROMPATH,alias=Node2,path=/home/projects/common/lib"
Note that only alpha-numeric characters are allowed to be used as labels. In the artefact tree, each node will appear as a separate top-level folder with the label provided at project creation.
Using multiple nodes, you can also analyse sources using different Repository Connectors in the same analysis:
-r "type=FROMPATH,alias=Node1,path=/home/projects/common-config"
-r "type=SVN,alias=Node2,url=svn+ssh://10.10.0.1/var/svn/project/src,rev=HEAD"
Input files for Squore's Data Providers, like source code, can be located in your version control system. When this is the case, you need to specify a variable in the input field for the Data Provider instead of an absolute path to the input file.

A Data Provider using an input file extracted from a remote repository
The variable to use varies depending on your scenario:
You have only one node of source code in your project
In this case, the variable to use is $src.
You have more than one node of source code in your project
In this case, you need to tell Squore in which node the input file is located. This is done using a variable that has the same name as the alias you defined for the source code node in the previous step of the wizard. For example, if your nodes are labelled Node1 and Node2 (the default names), then you can refer to them using the $Node1 and $Node2 variables.
When using these variables from the command line on a linux system, the $ symbol must be escaped:
-d "type=PMD,configFile=\$src/pmd_data.xml"
Table of Contents
This chapter describe the available Data Providers and the default parameters that they accept via the Command Line Interface.
AntiC is a part of the jlint static analysis suite and is launched to analyse C and C++ source code and produce findings.
For more details, refer to http://jlint.sourceforge.net/.
On Linux, the antiC executable must be compiled manually before you run it for the first time by running the command:
# cd /addons/tools/Antic_auto/bin/ && gcc antic.c -o antic
Automotive Coverage Import: generic import mechanism for coverage results at FUNCTION level
Automotive Coverage Import has the following options:
Enter the CSV file for coverage measures (csv) CSV File shall contain the following (PATH;NAME;TESTED_C1;OBJECT_C1;TESTED_MCC;OBJECT_MCC;TESTED_MCDC;OBJECT_MCDC)
The full command line syntax for Automotive Coverage Import is:
-d "type=Automotive_Coverage,csv=[text]"
BullseyeCoverage is a code coverage analyzer for C++ and C. The coverage report file is used to generate metrics.
For more details, refer to http://www.bullseye.com/.
CPD is an open source tool which generates Copy/Paste metrics. The dectection of duplicated blocks is set to 100 tokens. CPD provides an XML file which can be imported to generate metrics as well as findings.
For more details, refer to http://pmd.sourceforge.net/pmd-5.3.0/usage/cpd-usage.html.
Cppcheck is a static analysis tool for C/C++ applications. The tool provides an XML output which can be imported to generate findings.
For more details, refer to http://cppcheck.sourceforge.net/.
Cppcheck is a static analysis tool for C/C++ applications. The tool provides an XML output which can be imported to generate findings.
For more details, refer to http://cppcheck.sourceforge.net/.
On Windows, this data provider requires an extra download to extract the Cppcheck binary in /addons/tools/CPPCheck_auto/. On Linux, you can install the cppcheck application anywhere you want. The path to the Cppcheck binary for Linux can be configured in config.tcl.
Cppcheck (plugin) has the following options:
Source code folder (dir) Specify the folder containing the source files to analyse. If you want to analyse all of source repositories specified for the project, leave this field empty.
The full command line syntax for Cppcheck (plugin) is:
-d "type=CPPCheck_auto,dir=[text]"
Parasoft C/C++test is an integrated solution for automating a broad range of best practices proven to improve software development team productivity and software quality for C and C++. The tool provides an XML output file which can be imported to generate findings and metrics.
For more details, refer to http://www.parasoft.com/product/cpptest/.
Cantata is Test Coverage tools. It provides an XML output which can be imported to generate coverage metrics at function level.
For more details, refer to http://www.qa-systems.com/cantata.html.
CheckStyle is an open source tool that verifies that Java applications adhere to certain coding standards. It produces an XML file which can be imported to generate findings.
For more details, refer to http://checkstyle.sourceforge.net/.
CheckStyle is an open source tool that verifies that Java applications adhere to certain coding standards. It produces an XML file which can be imported to generate findings.
For more details, refer to http://checkstyle.sourceforge.net/.
This data provider requires an extra download to extract the CheckStyle binary in /addons/tools/CheckStyle_auto/.
CheckStyle (plugin) has the following options:
Configuration file (configFile) A Checkstyle configuration specifies which modules to plug in and apply to Java source files. Modules are structured in a tree whose root is the Checker module. Specify the name of the configuration file only, and the data provider will try to find it in the CheckStyle_auto folder of your custom configuration. If no custom configuration file is found, a default configuration will be used.
Xmx (xmx, default: 1024m) Maximum amount of memory allocated to the java process launching Checkstyle.
Excluded directory pattern (excludedDirectoryPattern) Java regular expression of directories to exclude from CheckStyle, for example: ^test|generated-sources|.*-report$ or ou ^lib$
The full command line syntax for CheckStyle (plugin) is:
-d "type=CheckStyle_auto,configFile=[text],xmx=[text],excludedDirectoryPattern=[text]"
CheckStyle is an open source tool that verifies that Java applications adhere to certain coding standards. It produces an XML file which can be imported to generate findings.
For more details, refer to http://checkstyle.sourceforge.net/.
This data provider requires an extra download to extract the CheckStyle binary in /addons/tools/CheckStyle_auto_for_SQALE/.
CheckStyle for SQALE (plugin) has the following options:
Configuration file (configFile, default: config_checkstyle_for_sqale.xml) A Checkstyle configuration specifies which modules to plug in and apply to Java source files. Modules are structured in a tree whose root is the Checker module. Specify the name of the configuration file only, and the data provider will try to find it in the CheckStyle_auto folder of your custom configuration. If no custom configuration file is found, a default configuration will be used.
Xmx (xmx, default: 1024m) Maximum amount of memory allocated to the java process launching Checkstyle.
The full command line syntax for CheckStyle for SQALE (plugin) is:
-d "type=CheckStyle_auto_for_SQALE,configFile=[text],xmx=[text]"
Cobertura is a free code coverage library for Java. Its XML report file can be imported to generate code coverage metrics for your Java project.
For more details, refer to http://cobertura.github.io/cobertura/.
Codesonar is a static analysis tool for C and C++ code designed for zero tolerance defect environments. It provides an XML output file which is imported to generate findings.
For more details, refer to http://www.grammatech.com/codesonar.
Compiler Warning impor allows to import information from compiler
For more details, refer to Compiler.
Coverity is a static analysis tool for C, C++, Java and C#. It provides an XML output which can be imported to generate findings.
For more details, refer to http://www.coverity.com/.
Findbugs is an open source tool that looks for bugs in Java code. It produces an XML result file which can be imported to generate findings.
For more details, refer to http://findbugs.sourceforge.net/.
Findbugs is an open source tool that looks for bugs in Java code. It produces an XML result file which can be imported to generate findings. Note that the data provider requires an extra download to extract the Findbugs binary in [INSTALLDIR]/addons/tools/Findbugs_auto/. You are free to use FindBugs 3.0 or FindBugs 2.0 depending on what your standard is. For more information, refer to the Installation and Administration Manual's "Third-Party Plugins and Applications" section.
For more details, refer to http://findbugs.sourceforge.net/.
This data provider requires an extra download to extract the Findbugs binary in /addons/tools/Findbugs_auto/.
FindBugs (plugin) has the following options:
Classes (class_dir, mandatory) Specify the folders and/or jar files for your project in classpath format, or point to a text file that contains one folder or jar file per line.
Auxiliary Class path (auxiliarypath) Specify a list of folders and/or jars in classpath format, or specify the path to a text file that contains one folder or jar per line. This information will be passed to FindBugs via the -auxclasspath parameter.
Memory Allocation (xmx, default: 1024m) Maximum amount of memory allocated to the java process launching FindBugs.
The full command line syntax for FindBugs (plugin) is:
-d "type=Findbugs_auto,class_dir=[text],auxiliarypath=[text],xmx=[text]"
FxCop is an application that analyzes managed code assemblies (code that targets the .NET Framework common language runtime) and reports information about the assemblies, such as possible design, localization, performance, and security improvements. FxCop generates an XML results file which can be imported to generate findings.
For more details, refer to https://msdn.microsoft.com/en-us/library/bb429476(v=vs.80).aspx.
GCov is a Code coverage program for C application. GCov generates raw text files which can be imported to generate metrics.
For more details, refer to http://gcc.gnu.org/onlinedocs/gcc/Gcov.html.
GCov has the following options:
Directory containing results files (dir) Specify the path of the root directory containing the GCov results files.
Results files extension (ext, default: *.c.gcov) Specify the file extension of GCov results files.
The full command line syntax for GCov is:
-d "type=GCov,dir=[text],ext=[text]"
GNATcheck is an extensible rule-based tool that allows developers to completely define a coding standard. The results are output to a log file that can be imported to generate findings.
For more details, refer to http://www.adacore.com/gnatpro/toolsuite/gnatcheck/.
GNATCompiler is a free-software compiler for the Ada programming language which forms part of the GNU Compiler Collection. It supports all versions of the language, i.e. Ada 2012, Ada 2005, Ada 95 and Ada 83. It creates a log file that can be imported to generate findings.
For more details, refer to http://www.adacore.com/gnatpro/toolsuite/compilation/.
JUnit is a simple framework to write repeatable tests. It is an instance of the xUnit architecture for unit testing frameworks. JUnit XML result files are imported to generate findings and the total number of tests is made available as a measure.
For more details, refer to http://junit.org/.
JUnit has the following options:
Results folder (resultDir, mandatory) Specify the path to the folder containing the JUnit results. The data provider will parse all available XML files. Note that the minimum support version of JUnit is 4.10.
The full command line syntax for JUnit is:
-d "type=JUnit,resultDir=[text]"
JaCoCo is a free code coverage library for Java. Its XML report file can be imported to generate code coverage metrics for your Java project.
For more details, refer to http://www.eclemma.org/jacoco/.
JaCoCo has the following options:
XML report (xml, mandatory) Specify the path to the XML report generated by JaCoCo. Note that the folder containing the XML file must also contain JaCoCo's report DTD file, available from http://www.eclemma.org/jacoco/trunk/coverage/report.dtd. XML report files are supported from version 0.6.5.
The full command line syntax for JaCoCo is:
-d "type=Jacoco,xml=[text]"
Klocwork is a static analysis tool. Its XML result file can be imported to generate findings.
For more details, refer to http://www.klocwork.com.
The Logiscope suite allows the evaluation of source code quality in order to reduce maintenance cost, error correction or test effort. It can be applied to verify C, C++, Java and Ada languages and produces a CSV results file that can be imported to generate findings.
For more details, refer to http://www.kalimetrix.com/en/logiscope.
NCover is a Code coverage program for C# application. NCover generates an XML results file which can be imported to generate metrics.
For more details, refer to http://www.ncover.com/.
This data provider reads an Oracle compiler log file and imports the warnings as findings. Findings extracted from the log file are filtered using a prefix parameter.
For more details, refer to http://www.oracle.com/.
Oracle PLSQL compiler Warning checker has the following options:
Compiler log file (log)
Prefixes (prefix) Prefixes and their replacements are specified as pairs using the syntax [prefix1|node1;prefix2|node2]. Leave this field empty to disable filtering. The parsing algorithm looks for lines fitting this pattern: [PATH;SCHEMA;ARTE_ID;ARTE_TYPE;LINE;COL;SEVERITY_TYPE;WARNING_ID;SEVERITY_ID;DESCR] and keeps lines where [PATH] begins with one of the input prefixes. In each kept [PATH], [prefix] is replaced by [node]. If [node] is empty, [prefix] is removed from [PATH], but not replaced. Some valid syntaxes for prefix: One prefix to remove: svn://aaaa:12345/valid/path/from/svn One prefix to replace: svn://aaaa:12345/valid/path/from/svn|node1 Two prefixes to remove: svn://aaaa:12345/valid/path/from/svn|;svn://bbbb:12345/valid/path/from/other_svn| Two prefixes to remove: svn://aaaa:12345/valid/path/from/svn;svn://bbbb:12345/valid/path/from/other_svn Two prefixes to replace: svn://aaaa:12345/valid/path/from/svn|node1;svn://bbbb:12345/valid/path/from/other_svn|node2
The full command line syntax for Oracle PLSQL compiler Warning checker is:
-d "type=Oracle_PLSQLCompiler,log=[text],prefix=[text]"
PC-lint is a static code analyser. The PC-lint data provider reads an PC-lint log file and imports MISRA violations as findings.
For more details, refer to http://www.gimpel.com/html/pcl.htm.
MISRA Rule Checking using PC-lint has the following options:
Log file folder (logDir) Specify the path to the folder containing the PC-lint log files.
Extensions to exclude (excludedExtensions, default: .h;.H) Specify the file extensions to exclude from the reported violations.
The full command line syntax for MISRA Rule Checking using PC-lint is:
-d "type=PC_Lint_MISRA,logDir=[text],excludedExtensions=[text]"
PMD scans Java source code and looks for potential problems like possible bugs, dead code, sub-optimal code, overcomplicated expressions, duplicate code... The XML results file it generates is read to create findings.
For more details, refer to http://pmd.sourceforge.net.
PMD scans Java source code and looks for potential problems like possible bugs, dead code, sub-optimal code, overcomplicated expressions, duplicate code ... The XML results file it generates is read to create findings.
For more details, refer to http://pmd.sourceforge.net.
This data provider requires an extra download to extract the PMD binary in /addons/tools/PMD_auto/.
PMD (plugin) has the following options:
Ruleset file (configFile) Specify the path to the PMD XML ruleset you want to use for this analysis. If you do not specify a ruleset, the default one from INSTALLDIR/addons/tools/PMD_autow ill be used.
The full command line syntax for PMD (plugin) is:
-d "type=PMD_auto,configFile=[text]"
Polyspace is a static analysis tool which includes a MISRA checker. It produces an XML output which can be imported to generate findings. Polyspace Verifier detects RTE (RunTime Error) such as Division by zero, Illegal Deferencement Pointer, Out of bound array index... Such information is turned into statistical measures at function level. Number of Red (justified/non-justified), Number of Grey (justified/non-justified), Number of Orange (justified/non-justified), Number of Green.
For more details, refer to http://www.mathworks.com/products/polyspace/index.html.
Polyspace MISRA has the following options:
Results folder (resultDir) Specify the folder containing the Polyspace results. The data provider will parse all sub-folders searching for XML result files called "MISRA-CPP-report.xml" or "MISRA-C-report.xml" located in a "Polyspace-Doc" folder and aggregate results.
Unit by Unit (unitByUnit, default: true) Check this box if the Polyspace verification was run unit by unit.
The full command line syntax for Polyspace MISRA is:
-d "type=Polyspace_MISRA,resultDir=[text],unitByUnit=[booleanChoice]"
Polyspace is a static analysis tool which includes a MISRA checker. It produces an binary output format which can be imported to generate findings. Polyspace Verifier detects RTE (RunTime Error) such as Division by zero, Illegal Deferencement Pointer, Out of bound array index... Such information is turned into statistical measures at function level. Number of Red (justified/non-justified), Number of Grey (justified/non-justified), Number of Orange (justified/non-justified), Number of Green. Note that this data provider requires an extra download to extract the Polyspace Export binary in [INSTALLDIR]/addons/tools/Polyspace_RTE/. For more information, refer to the Installation and Administration Manual's "Third-Party Plugins and Applications" section.
For more details, refer to http://www.mathworks.com/products/polyspace/index.html.
This data provider requires an extra download to extract the Polyspace Export binary in /addons/tools/Polyspace_RTE.
Polyspace (plugin) has the following options:
Results folder (resultDir) Specify the folder containing the Polyspace results. The data provider will run the polyspace-export binary on all sub-folders to export results to XML and aggregate them.
Unit by Unit (unitByUnit, default: true) Check this box if the Polyspace verification was run unit by unit.
The full command line syntax for Polyspace (plugin) is:
-d "type=Polyspace_RTE,resultDir=[text],unitByUnit=[booleanChoice]"
QAC identifies problems in C source code caused by language usage that is dangerous, overly complex, non-portable, difficult to maintain, or simply diverges from coding standards. Its CSV results file can be imported to generate findings.
For more details, refer to http://www.phaedsys.com/principals/programmingresearch/pr-qac.html.
MISRA Rule Checking with QAC has the following options:
Code Folder (logDir) Specify the path to the folder that contains the annotated files to process. For the findings to be successfully linked to their corresponding artefact, several requirements have to be met: - The annotated file name should be [Original source file name].txt e.g. The annotation of file "controller.c" should be called "controller.c.txt" - The annotated file location in the annotated directory should match the associated source file location in the source directory. e.g. The annotation for source file "[SOURCE_DIR]/subDir1/subDir2/controller.c" should be located in "[ANNOTATIONS_DIR]/subDir1/subDir2/controller.c.txt" The previous comment suggests that the source and annotated directory are different. However, these directories can of course be identical, which ensures that locations of source and annotated files are the same.
Extension (ext, default: html) Specify the extension used by QAC to create annotated files.
The full command line syntax for MISRA Rule Checking with QAC is:
-d "type=QAC_MISRA,logDir=[text],ext=[text]"
Rational Test RealTime is a cross-platform solution for component testing and runtime analysis of embedded software. Metrics are generated from its CSV results file.
For more details, refer to http://www-01.ibm.com/software/awdtools/test/realtime/.
Unit Test Code Coverage from Rational Test RealTime has the following options:
.xrd folder (logDir) Specify the path to the folder containing the .xrd files generated by RTRT.
Excluded file extensions (excludedExtensions, default: .h;.H)
The full command line syntax for Unit Test Code Coverage from Rational Test RealTime is:
-d "type=RTRT,logDir=[text],excludedExtensions=[text]"
RIF/ReqIF (Requirements Interchange Format) is an XML file format that can be used to exchange requirements, along with its associated metadata, between software tools from different vendors.
For more details, refer to http://www.omg.org/spec/ReqIF/.
ReqIF has the following options:
(dir)
Spec Object Type (objType, default: _AUTO_) Specify the SPEC_OBJECT_TYPE property LONG-NAME to be used to process the ReqIf file. Using the _AUTO_ value will let the Data Provider extract the value fro the ReqIf file, and assumes that there is only one such definition.
The full command line syntax for ReqIF is:
-d "type=ReqIf,dir=[text],objType=[text]"
SQL Code Guard is a free solution for SQL Server that provides fast and comprehensive static analysis for T-Sql code, shows code complexity and objects dependencies.
For more details, refer to http://www.sqlcodeguard.com.
Squan Sources provides basic-level analysis of your source code.
For more details, refer to http://www.squoring.com.
The analyser can output info and warning messages in the build logs. Recent additions to those logs include better handling of structures in C code, which will produce these messages:
[Analyzer] Unknown syntax declaration for function XXXXX at line yyy to indicate that we whould have found a function but, probably due to preprocessing directives, we are not able to parse it.
[Analyzer] Unbalanced () blocks found in the file. Probably due to preprocessing directives, parenthesis in the file are not well balanced.
[Analyzer] Unbalanced {} blocks found in the file. Probably due to preprocessing directives, curly brackets in the file are not well balanced.
You can specify the languages for your source code by passing pairs of language and extensions to the languages paramater. For example, a project mixing php and javascript files can be analysed with:
--dp "type=SQuORE,languages=php:.php;javascript:.js,.JS"
Squan Sources has the following options:
Languages (languages, default: abap;ada;c;cpp;mindc;csharp;cobol;java;javascript;fortran77;fortran90;php;sql;python;tsql;vbnet;xaml) Check the boxes for the languages used in the specified source repositories. Adjust the list of file extensions as necessary. Note that two languages cannot use the same file extension, and that the list of extensions is case-sensitive. Tip: Leave all the boxes unchecked and Squan Sources will auto-detect the language parser to use.
Force full analysis (rebuild_all, default: false) Analyses are incremental by default. Check this box if you want to force the source code parser to analyse all files instead of only the ones that have changed since the previous analysis. This is useful if you added new rule files or text parsing rules and you want to re-evaluate all files based on your modifications.
Generate control graphs (genCG, default: true) This option allows generating a control graph for every function in your code. The control graph is visible in the dashboard of the function when the analysis completes.
Use qualified names (qualified, default: false) Note: This option cannot be modified in subsequent runs after you create the first version of your project.
Limit analysis depth (depth, default: false) Use this option to limit the depth of the analysis to file-level only. This means that Squan Sources will not create any class or function artefacts for your project.
Add a 'Source Code' node (scnode, default: false) Using this options groups all source nodes under a common source code node instead of directly under the APPLICATION node. This is useful if other data providers group non-code artefacts like tests or requirements together under their own top-level node. This option can only be set when you create a new project and cannot be modified when creating a new version of your project.
'Source Code' node label (scnode_name, default: Source Code) Specify a custom label for your main source code node. Note: this option is not modifiable. It only applies to projects where you use the "Add a 'Source Code' node" option. When left blank, it defaults to "Source Code".
Compact folders (compact_folder, default: true) When using this option, folders with only one son are aggregates together. This avoids creating many unnecessary levels in the artefact tree to get to the first level of files in your project. This option cannot be changed after you have created the first version of your project.
Content exclusion via regexp (pattern) Specify a PERL regular expression to automatically exclude files from the analysis if their contents match the regular expression. Leave this field empty to disable content-based file exclusion.
File Filtering (files_choice, default: Exclude) Specify a pattern and an action to take for matching file names. Leave the pattern empty to disable file filtering.
pattern (pattern_files) Use a shell-like wildcard e.g. '*-test.c'. * Matches any sequence of characters in string, including a null string. ? Matches any single character in string. [chars] Matches any character in the set given by chars. If a sequence of the form x-y appears in chars, then any character between x and y, inclusive, will match. On Windows, this is used with the -nocase option, meaning that the end points of the range are converted to lower case first. Whereas {[A-z]} matches '_' when matching case-sensitively ('_' falls between the 'Z' and 'a'), with -nocase this is considered like {[A-Za-z]}. \x Matches the single character x. This provides a way of avoiding the special interpretation of the characters *?[] in pattern. Tip: Use ; to separate multiple patterns.
Folder Filtering (dir_choice, default: Exclude) Specify a pattern and an action to take for matching folder names. Leave the pattern empty to disable folder filtering.
pattern (pattern_dir) Use a shell-like wildcard e.g. 'Test_*'. * Matches any sequence of characters in string, including a null string. ? Matches any single character in string. [chars] Matches any character in the set given by chars. If a sequence of the form x-y appears in chars, then any character between x and y, inclusive, will match. On Windows, this is used with the -nocase option, meaning that the end points of the range are converted to lower case first. Whereas {[A-z]} matches '_' when matching case-sensitively ('_' falls between the 'Z' and 'a'), with -nocase this is considered like {[A-Za-z]}. \x Matches the single character x. This provides a way of avoiding the special interpretation of the characters *?[] in pattern. Tip: Use ; to separate multiple patterns.
Detect algorithmic cloning (clAlg, default: true) When checking this box, Squan Sources launches a cloning detection tool capable of finding algorithmic cloning in your code.
Detect text cloning (clTxt, default: true) When checking this box, Squan Sources launches a cloning detection tool capable of finding text duplication in your code.
Backwards-compatible cloning (clBw, default: false) When checking this box, the cloning detection tool is run in a way that produces metrics that are backwards-compatible with earlier versions of this product (2014-A): exact matching is used for algorithmic cloning and a 5% margin is used for text duplication. This legacy behaviour should only be used if you are using an old configuration that was developed before 2014-B.
Cloning fault ratio (clFR, default: 0.1) This threshold defines how much cloning between two artefacts is necessary for them to be considered as clones by the cloning detection tool. For example, a fault ratio of 0.1 means that two artefacts are considered clones if less than 10% of their contents differ. Note that this option is ignored if you are using backwards-compatible cloning.
Detect Open Source cloning (deprecated) (clOS, default: false) This option is no longer supported and should not be used anymore.
Compute Textual stability (genTs, default: true) This option allows keeping track of the stability of the code analysed for each version. The computed stability is available on the dashboard as a metric called and can be interpreted as 0% meaning completely changed and 100% meaning not changed at all.
Compute Algorithmic stability (genAs, default: true) This option allows keeping track of the stability of the code analysed for each version. The computed stability is available on the dashboard as a metric called Stability Index (SI) and can be interpreted as 0% meaning completely changed and 100% meaning not changed at all.
Detect artefact renaming (clRen, default: true) This option allows Squan Sources to detect artefacts that have been moved since the previous version, ensuring that the stability metrics of the previous artefact are passed to the new one. This is typically useful if you have moved a file to a different folder in your source tree and do not want to lose the previous metrics generated for this file. If you do not use this option, moved artefacts will be considered as new artefacts.
Additional parameters (additional_param) These additional parameters can be used to pass instructions to external processes started by this data provider. This value is generally left empty in most cases.
The full command line syntax for Squan Sources is:
-d "type=SQuORE,languages=[multipleChoice],rebuild_all=[booleanChoice],genCG=[booleanChoice],qualified=[booleanChoice],depth=[booleanChoice],scnode=[booleanChoice],scnode_name=[text],compact_folder=[booleanChoice],pattern=[text],files_choice=[multipleChoice],pattern_files=[text],dir_choice=[multipleChoice],pattern_dir=[text],clAlg=[booleanChoice],clTxt=[booleanChoice],clBw=[booleanChoice],clFR=[text],clOS=[booleanChoice],genTs=[booleanChoice],genAs=[booleanChoice],clRen=[booleanChoice],additional_param=[text]"
Squore Import is a data provider used to import the results of another data provider analysis. It is generally only used for debugging purposes.
For more details, refer to http://www.squoring.com.
Squore Virtual Project is a data provider that can use the output of several projects to compile metrics in a meta-project composed of the import sub-projects.
For more details, refer to http://www.squoring.com.
Squore Virtual Project has the following options:
Paths to output.xml files (output) Specify the paths to all the output.xml files you want to include in the virtual project. Separate paths using ';'.
The full command line syntax for Squore Virtual Project is:
-d "type=SQuOREVirtualProject,output=[text]"
StyleCop is a C# code analysis tool. Its XML output is imported to generate findings.
For more details, refer to https://stylecop.codeplex.com/.
StyleCop is a C# code analysis tool. Its XML output is imported to generate findings.
For more details, refer to https://stylecop.codeplex.com/.
Note that this data provider is not supported on Linux. On windows, this data provider requires an extra download to extract the StyleCop binary in /addons/tools/StyleCop_auto/.
Tessy is a tool automating module/unit testing of embedded software written in dialects of C/C++. Tessy generates an XML results file which can be imported to generate metrics. This data provider supports importing files that have a xml_version="1.0" attribute in their header.
For more details, refer to https://www.hitex.com/en/tools/tessy/.
Tessy has the following options:
Results folder (resultDir) Specify the top folder containing XML result files from Tessy. Note that this data provider will recursively scan sub-folders looking for index.xml files to aggregate results.
The full command line syntax for Tessy is:
-d "type=Tessy,resultDir=[text]"
CodeSniffer is a rulecker for PHP and Javascript
For more details, refer to http://www.squizlabs.com/php-codesniffer.
Use this tool to check for duplicated files or XML Elements between a custom configuration and the standard configuration.
Csv Coverage Import has the following options:
Enter the CSV file for coverage measures (csv) CSV File shall contain the following (PATH;NAME;TESTED_C1;OBJECT_C1;TESTED_MCC;OBJECT_MCC;TESTED_MCDC;OBJECT_MCDC;TCOV_MCC;TCOV_MCDC;TCOV_C1)
The full command line syntax for Csv Coverage Import is:
-d "type=csv_coverage,csv=[text]"
CSV Findings has the following options:
CSV File (FILE;FUNCTION;RULE_ID;MESSAGE;LINE;COL;STATUS;STATUS_MESSAGE;TOOL) (csv) Your CSV file shoul use include the following as a header: FILE;FUNCTION;RULE_ID;MESSAGE;LINE;COL;STATUS;STATUS_MESSAGE;TOOL. CSV files in other formats are not supported.
The full command line syntax for CSV Findings is:
-d "type=csv_findings,csv=[text]"
OSLC-CM allows retrieving information from Change Management systems following the OSLC standard. Metrics and artefacts are created by connecting to the OSLC system and retrieving issues with the specified query.
For more details, refer to http://open-services.net/.
OSLC has the following options:
Change Server (server) Specify the URL of the project you want to query on the OSLC server. Typically the URL will look like this: http://myserver:8600/change/oslc/db/3454a67f-656ddd4348e5/role/User/
Query (query) Specify the query to send to the OSLC server (e.g.: release="9TDE/TDE_00_01_00_00"). It is passed to the request URL via the ?oslc_cm.query= parameter.
Query Properties (properties, default: request_type,problem_number,crstatus,severity,submission_area,functionality,mb_code,professional_line,ir_submitted_time,ir_conclude_time,product_version,release,dc:identifier,dc:type,change:resolver,change:layer,change:est_appl_effort,change:est_ctrl_effort,change:est_sw_effort,change:est_ana_effort,change:effort,change:configuration,change:create_time,change:crstatus,change:origine_type,change:severity) Specify the properties to add to the query. They are passed to the OSLC query URL using the ?oslc_cm.properties= parameter.
Login (login)
Password (password)
The full command line syntax for OSLC is:
-d "type=oslc_cm,server=[text],query=[text],properties=[text],login=[text],password=[password]"
pep8 is a tool to check your Python code against some of the style conventions in PEP 88. Its CSV report file is imported to generate findings.
For more details, refer to https://pypi.python.org/pypi/pep8.
Style Guide for Python Code. Pep8 results are imported to produce findings on Python code. This data provider requires having pep8 installed on the machine running the analysis and the pep8 command to be available in the path. It is compatible with pep8 1.4.6 and may also work with older versions.
PHP Code Coverage
For more details, refer to https://github.com/sebastianbergmann/php-code-coverage.
Pylint is a Python source code analyzer which looks for programming errors, helps enforcing a coding standard and sniffs for some code smells (as defined in Martin Fowler's Refactoring book). Pylint results are imported to generate findings for Python code.
For more details, refer to http://www.pylint.org/.
Coding Guide for Python Code. Pylint results are imported to produce findings on Python code. This data provider requires having pylint installed on the machine running the analysis and the pylint command to be available in the path. It is known to work with pylint 1.7.0 and may also work with older versions.
QA-C is a static analysis tool for MISRA checking.
For more details, refer to http://www.programmingresearch.com/static-analysis-software/qac-qacpp-static-analyzers/.
By default, Squan Sources generates artefacts for all PROGRAMs in COBOL source files. It is possible to configure the parser to also generate artefacts for all SECTIONs and PARAGRAPHs in your source code. This feature can be enabled with the following steps:
Open <SQUORE_HOME>/configuration/tools/SQuORE/Analyzer/artifacts/cobol/ArtifactsList.txt
Edit the list of artefacts to generate and add the section and paragraph types:
program
section
paragraph
Save your changes
If you create a new project, you will see the new artefacts straight away. For already-existing projects, make sure to launch a new analysis and check Squan Sources's Force full analysis option to parse the entire code again and generate the new artefacts.
You can create your own Data Providers by using the built-in frameworks included in Squore. Each solution uses a different approach, but the overall goal is to produce one or more CSV files that your Data Provider will send to Squore to associate metrics, findings, textual information or links to artefacts in your project.
This section helps you choose the right framework for your custom Data Provider and covers the basics of creating a custom configuration folder to extend Squore. If you need more flexibility than is offered by the default frameworks, this chapter also documents the XML format you can write so that Squore imports your data directly.
The following is a list of the available Data Provider frameworks:
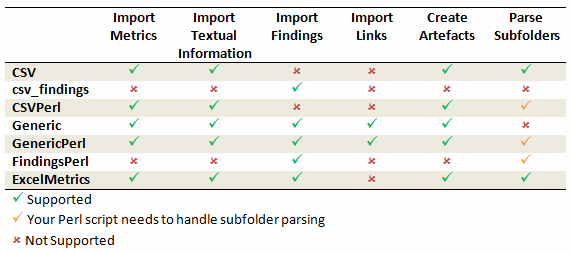
Data Provider frameworks and their capabilities
Csv
The Csv framework is used to import metrics or textual information and attach them to artefacts of type Application or File. While parsing one or more input CSV files, if it finds the same metric for the same artefact several times, it will only use the last occurrence of the metric and ignore the previous ones. Note that the type of artefacts you can attach metrics to is limited to Application and File artefacts. If you are working with File artefacts, you can let the Data Provider create the artefacts by itself if they do not exist already. Refer to the full Csv Reference for more information.
csv_findings
The csv_findings framework is used to import findings in a project and attach them to artefacts of type Application, File or Function. It takes a single CSV file as input and is the only framework that allows you to import relaxed findings directly. Refer to the full csv_findings Reference for more information.
CsvPerl
The CsvPerl framework offers the same functionality as Csv, but instead of dealing with the raw input files directly, it allows you to run a perl script to modify them and produce a CSV file with the expected input format for the Csv framework. Refer to the full CsvPerl Reference for more information.
FindingsPerl
The FindingsPerl framework is used to import findings and attach them to existing artefacts. Optionally, if an artefact cannot be found in your project, the finding can be attached to the root node of the project instead. When launching a Data Provider based on the FindingsPerl framework, a perl script is run first. This perl script is used to generate a CSV file with the expected format which will then be parsed by the framework. Refer to the full FindingsPerl Reference for more information.
Generic
The Generic framework is the most flexible Data Provider framework, since it allows attaching metrics, findings, textual information and links to artefacts. If the artefacts do not exist in your project, they will be created automatically. It takes one or more CSV files as input (one per type of information you want to import) and works with any type of artefact. Refer to the full Generic Reference for more information.
GenericPerl
The GenericPerl framework is an extension of the Generic framework that starts by running a perl script in order to generate the metrics, findings, information and links files. It is useful if you have an input file whose format needs to be converted to match the one expected by the Generic framework, or if you need to retrieve and modify information exported from a web service on your network. Refer to the full GenericPerl Reference for more information.
ExcelMetrics
The ExcelMetrics framework is used to extract information from one or more Microsoft Excel files (.xls or .xslx). A detailed configuration file allows defining how the Excel document should be read and what information should be extracted. This framework allows importing metrics, findings and textual information to existing artefacts or artefacts that will be created by the Data Provider. Refer to the full ExcelMetrics Reference for more information.
The Data Providers that are not based on these frameworks can do a lot more than just import information from CSV files. Here is a non-exhaustive list of what some of them do:
Use XSLT files to transform XML files
Read information from microsoft Word Files
Parse HTML test result files
Query web services
Export data from OSLC systems
Launch external processes
If you are interested in developping Data Providers that go beyond the scope of what is described in the open frameworks, you can write your own scripts to produce data in a format that Squore can import directly, or consult Squoring Technologies to learn more about the available training courses in writing Data Providers.
After you choose the framework to extend, you should follow these steps to make your custom Data Provider known to Squore:
Create a new configuration tools folder to save your work in your
custom configuration folder: MyConfiguration/configuration/tools.
Create a new folder for your data provider inside the new tools
folder: CustomDP. This folder needs to contain the following files:
form.xml defines the input parameters for the Data Provider, and the base framework to use
form_en.properties contains the strings displayed in the web interface for this Data Provider
config.tcl contains the parameters for your custom Data Provider that are specific to the selected framework
CustomDP.pl is the perl script that is executed automatically if your custom Data Provider uses one of the *Perl frameworks.
Edit Squore Server's configuration file to register your new configuration path, as described in the Installation and Administration Guide.
Log into the web interface as a Squore administrator and reload the configuration.
Your new Data Provider is now known to Squore and can be triggered in analyses. Note that you may have to modify your Squore configuration to make your wizard aware of the new Data Provider and your model aware of the new metrics it provides. Refer to the relevant sections of the Configuration Guide for more information.
Instead of using one of the Data Provider frameworks, you can directly produce your results in an XML format that can read and import. The syntax to use is as follows:
input-data.xml:
<bundle version="2.0">
	<artifact [local-key=""] [local-parent=""|parent=""]>
        <artifact [id="<guid-stable-in-time-also-a-key>"] name="Component" type="REQ" [location=""]>
			<info name|n="DESCR" value="The description of the object"/>
			<key value="3452-e89b-ff82"/>
			<metric name="TEST_KO" value="2"/>
			<finding name="AR120" loc="xxx" p0="The message" />
			<link name="TEST" local-dst=""|dst="" />
				<artifact id="" name="SubComponent" type="REQ">
				...
				</artifact>
		</artifact>
	</artifact>

	<artifact id="" local-key="" name="" type="" local-parent=""|parent="" [location=""] />
	...

	<link name="" local-src=""|src="" local-dst=""|dst="" />
	...

	<info local-ref=""|ref="" name="" value=""/>
	...

	<metric local-ref=""|ref="" name="" value=""/>
	...

	<finding local-ref=""|ref="" [location=""] p0="" />
	<finding local-ref=""|ref="" [location=""] p0="">
		<location local-ref=""|ref="" [location=""] />
		...
		<relax status="RELAXED_DEROGATION|RELAXED_LEGACY|RELAXED_FALSE_POSITIVE"><![CDATA[My Comment]]></relax>
	</finding>
	...
</bundle>A Data Provider's parameters are defined in a file called form.xml. The following is an example of form.xml for a Data Provider extending the GenericPerl framework:
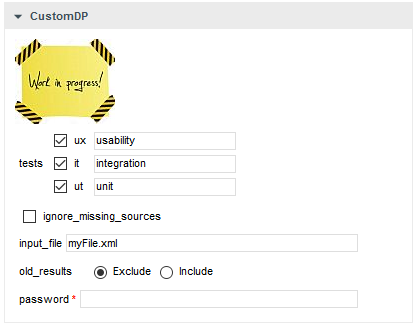
<?xml version="1.0" encoding="UTF-8"?>
<tags baseName="GenericPerl" needSources="true" image="CustomDP.png" projectStatusOnFailure="ERROR">
	<tag type="multipleChoice" displayType="checkbox" optionTitle=" " key="tests">
		<value key="ux" option="usability" />
		<value key="it" option="integration" />
		<value key="ut" option="unit" />
	</tag>
	<tag type="booleanChoice" key="ignore_missing_sources" defaultValue="false" />
	<tag type="text" key="input_file" defaultValue="myFile.xml" changeable="false" />
	<tag type="multipleChoice" key="old_results" style="margin-left:10px" displayType="radioButton" defaultValue="Exclude">
		<value key="Exclude" />
		<value key="Include" />
	</tag>
	<tag type="text" key="java_path" defaultValue="/usr/bin/java" hide="true" />
	<tag type="password" required="true" key="password" />
</tags>
The
tags
element accepts the following attributes:
baseName
(mandatory) indicates which framework you are basing this Data Provider on
needSources
(optional, default: false) allows specifying whether the Data Provider requires sources or not. When set to true, an error will be displayed if you try to select this Data Provider without adding any Repository Connector to your project.
image
(optional, default: none) allows displaying a logo in the web UI for the Data Provider
projectStatusOnFailure
(optional, default: ERROR) defines what status the project ends in when this Data Provider produces an error. The following values are allowed:
IGNORE
WARNING
ERROR
projectStatusOnWarning
(optional, default: WARNING) defines what status the project ends in when this Data Provider produces a warning. The following values are allowed:
IGNORE
WARNING
ERROR
Each
tag
element is a Data Provider option and allows the following attributes:
key
(mandatory) is the option's key that will be passed to the perl script, or can be used to specify the parameter's value from the command line
type
(mandatory) defines the type of the parameter.
The following values are accepted:
text for free text entry
password for password fields
booleanChoice for a boolean
multipleChoice for offering a selection of predefined values
displayType
(optional) allows specifying how
to display a multipleChoice
parameter by using one of:
comboBox
radioButton
checkbox
defaultValue
(optional, default: empty) is the value used for the parameter when not specified
hide
(optional, default: false) allows hiding a parameter from the web UI, which is useful when combining it with a default value
changeable
(optional, default: true) allows making a parameter configurable only when creating the project but read-only for following analyses when set to true
style
(optional, default: empty) allows setting basic css for the attribute in the web UI
required
(optional, default: false) allows showing a red asterisk next to the field in the web UI to make it visibly required. Note that this is only a visual aid at the moment and cannot be used to force users to enter a value for the parameter.
In order to display your Data Provider parameters in different languages in the web UI, yout Data Provider's form.xml does not
contain any hard-coded strings. Instead, Squore uses each parameter's key
attribute to dynamically
retrieve a translation from a form_xx.properties file located next to form.xml.
When you create a Data Provider, it is mandatory to include at least an English version of the strings in a file called form_en.properties. You are free to add other languages as needed. Here is a sample .properties for for the CustomDP you created in the previous section:
FORM.GENERAL.NAME  = CustomDP
FORM.DASHBOARD.NAME  = Test Status
FORM.GENERAL.DESCR = CustomDP imports test results for my project
FORM.GENERAL.URL   = http://example.com/CustomDP

TAG.tests.NAME  = Test Types
TAG.tests.DESCR = Check the boxes next to the types of test results contained in the results

TAG.ignore_missing_sources.NAME = Ignore Missing Sources

TAG.input_file.NAME = Test Results
TAG.input_file.DESCR = Specify the absolute path to the file containing the test results

TAG.old_results.NAME = Old Test Results
TAG.old_results.DESCR = If the previous analysis contained results that are not in this results file, what do you want to do with the old results?
OPT.Exclude.NAME = discard
OPT.Include.NAME = keep

TAG.password.NAME = File Password
TAG.password.DESCR = Specify the password to decrypt the test results file
The syntax for the .properties file is as follows:
FORM.GENERAL.NAME is the display name of the Data Provider in the project wizard
FORM.DASHBOARD.NAME is the display name of the Data Provider in the Explorer
FORM.GENERAL.DESCR is the description displayed in the Data Provider's tooltip in the web UI
FORM.GENERAL.URL is a reference URL for the Data Provider. Note that it is not displayed in ther web UI yet.
TAG.tag_name.NAME allows setting the display name of a parameter
TAG.tag_name.DESCR is a help text displayed in a tooltip next to the Data Provider option in the web UI
OPT.option_name.NAME allows setting the display name of an option
Using the form_en.properties above for CustomDP results in the following being displayed in the web UI when launching an analysis:
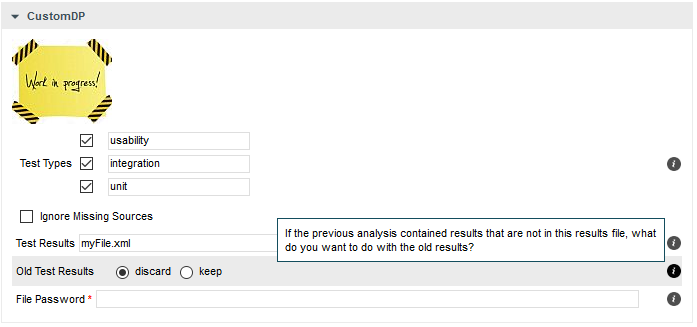
.properties fileTable of Contents
=======
= Csv =
=======

The Csv framework is used to import metrics or textual information and attach them to artefacts of type Application, File or Function. While parsing one or more input CSV files, if it finds the same metric for the same artefact several times, it will only use the last occurrence of the metric and ignore the previous ones. Note that the type of artefacts you can attach metrics to is limited to Application, File and Function artefacts. If you are working with File artefacts, you can let the Data Provider create the artefacts by itself if they do not exist already.

============
= form.xml =
============

You can customise form.xml to either:
- specify the path to a single CSV file to import
- specify a pattern to import all csv files matching this pattern in a directory

In order to import a single CSV file:
=====================================
<?xml version="1.0" encoding="UTF-8"?>
<tags baseName="Csv" needSources="true">
	<tag type="text" key="csv" defaultValue="/path/to/mydata.csv" />
</tags>

Notes:
- The csv key is mandatory.
- Since Csv-based data providers commonly rely on artefacts created by Squan Sources, you can set the needSources attribute to force users to specify at least one repository connector when creating a project.

In order to import all files matching a pattern in a folder:
===========================================================
<?xml version="1.0" encoding="UTF-8"?>
<tags baseName="Csv" needSources="true">
	<!-- Root directory containing Csv files to import-->
	<tag type="text" key="dir" defaultValue="/path/to/mydata" />
	<!-- Pattern that needs to be matched by a file name in order to import it-->
	<tag type="text" key="ext" defaultValue="*.csv" />
	<!-- search for files in sub-folders -->
	<tag type="booleanChoice" defaultValue="true" key="sub" />
</tags>

Notes:
- The dir and ext keys are mandatory
- The sub key is optional (and its value set to false if not specified)


==============
= config.tcl =
==============

Sample config.tcl file:
=======================
# The separator used in the input CSV file
# Usually \t or ;
set Separator "\t"

# The delimiter used in the input CSV file
# This is normally left empty, except when you know that some of the values in the CSV file
# contain the separator itself, for example:
# "A text containing ; the separator";no problem;end
# In this case, you need to set the delimiter to \" in order for the data provider to find 3 values instead of 4.
# To include the delimiter itself in a value, you need to escape it by duplicating it, for example:
# "A text containing "" the delimiter";no problemo;end
# Default: none
set Delimiter \"

# ArtefactLevel is one of:
#      Application: to import data at application level
#      File: to import data at file level. In this case ArtefactKey has to be set
#             to the value of the header (key) of the column containing the file path
#			  in the input CSV file.
#      Function : to import data at function level, in this case:
#                 ArtefactKey has to be set to the value of the header (key) of the column containing the path of the file
#                 FunctionKey has to be set to the value of the header (key) of the column containing the name and signature of the function
# Note that the values are case-sensitive.
set ArtefactLevel File
set ArtefactKey File

# Should the File paths be case-insensitive?
# true or false (default)
# This is used when searching for a matching artefact in already-existing artefacts.
set PathsAreCaseInsensitive "false"

# Should file artefacts declared in the input CSV file be created automatically?
# true (default) or false
set CreateMissingFile "true"

# FileOrganisation defines the layout of the input CSV file and is one of:
#     header::column: values are referenced from the column header
#     header::line: NOT AVAILABLE
#     alternate::line: lines are a sequence of {Key Value}
#     alternate::column: columns are a sequence of {Key Value}
# There are more examples of possible CSV layouts later in this document
set FileOrganisation header::column

# Metric2Key contains a case-sensitive list of paired metric IDs:
#     {MeasureID KeyName [Format]}
# where:
#   - MeasureID is the id of the measure as defined in your analysis model
#   - KeyName, depending on the FileOrganisation, is either the name of the column or the name
#      in the cell preceding the value to import as found in the input CSV file
#   - Format is the optional format of the data, the only accepted format
#      is "text" to attach textual information to an artefact, for normal metrics omit this field
set Metric2Key {
	{BRANCHES Branchs}
	{VERSIONS Versions}
	{CREATED Created}
	{IDENTICAL Identical}
	{ADDED Added}
	{REMOV Removed}
	{MODIF Modified}
	{COMMENT Comment text}
}


==========================
= Sample CSV Input Files =
==========================

Example 1:
==========
 FileOrganisation : header::column
 ArtefactLevel : File
 ArtefactKey   : Path

Path	Branchs	Versions
./foo.c	15		105
./bar.c	12		58

Example 2:
==========
 FileOrganisation : alternate::line
 ArtefactLevel : File
 ArtefactKey   : Path

Path	./foo.c	Branchs	15	Versions	105
Path	./bar.c	Branchs	12	Versions	58

Example 3:
==========
 FileOrganisation : header::column
 ArtefactLevel : Application

ChangeRequest	Corrected	Open
27				15			11

Example 4:
==========
 FileOrganisation : alternate::column
 ArtefactLevel : Application

ChangeRequest	15
Corrected		11

Example 5:
==========
 FileOrganisation : alternate::column
 ArtefactLevel : File
 ArtefactKey   : Path

Path	./foo.c
Branchs	15
Versions	105
Path	./bar.c
Branchs	12
Versions	58

Example 6:
==========
 FileOrganisation : header::column
 ArtefactLevel : Function
 ArtefactKey   : Path
 FunctionKey   : Name

Path	Name	Decisions Tested
./foo.c	end_game(int*,int*)	15		3
./bar.c	bar(char)	12		6

Working With Paths:
===================

- Path seperators are unified: you do not need to worry about handling differences between Windows and Linux
- With the option PathsAreCaseInsensitive, case is ignored when searching for files in the Squore internal data
- Paths known by Squore are relative paths starting at the root of what was specified in the repository connector durign the analysis. This relative path is the one used to match with a path in a csv file.

Here is a valid example of file matching:
  1. You provide C:\A\B\C\D as the root folder in a repository connector
  2. C:\A\B\C\D contains E\e.c then Squore will know E/e.c as a file

  3. You provide a csv file produced on linux and containing
    /tmp/X/Y/E/e.c as path, then Squore will be able to match it with the known file.

Squore uses the longest possible match.
In case of conflict, no file is found and a message is sent to the log.
================
= csv_findings =
================

The csv_findings data provider is used to import findings (rule violations) and attach them to artefacts of type Application, File or Function.
The format of the csv file given as parameter has to be:

FILE;FUNCTION;RULE_ID;MESSAGE;LINE;COL;STATUS;STATUS_MESSAGE;TOOL

where:
=====
FILE : is the full path of the file where the finding is located
FUNCTION : is the name of the function where the finding is located
RULE_ID : is the Squore ID of the rule which is violated
MESSAGE : is the specific message of the violation
LINE: is the line number where the violation occurs
COL: (optional, leave empty if not provided) is the column number where the violation occurs
STATUS: (optional, leave empty if not provided) is the staus of the relaxation if the violation has to be relaxed (DEROGATION, FALSE_POSITIVE, LEGACY)
STATUS_MSG: (optional, leave empty if not provided) is the message for the relaxation when relaxed
TOOL: is the tool providing the violation

The header line is read and ignored (it has to be there)
The separator (semicolon by default) can be changed in the config.tcl file (see below)
The delimiter (no delimiter by default) can be changed in the config.tcl (see below)

==============
= config.tcl =
==============

Sample config.tcl file:
=======================
# The separator used in the input CSV file
# Usually ; or \t
set Separator \;

# The delimiter used in the CSV input file
# This is normally left empty, except when you know that some of the values in the CSV file
# contain the separator itself, for example:
# "A text containing ; the separator";no problem;end
# In this case, you need to set the delimiter to \" in order for the data provider to find 3 values instead of 4.
# To include the delimiter itself in a value, you need to escape it by duplicating it, for example:
# "A text containing "" the delimiter";no problemo;end
# Default: none
set Delimiter \"
===========
= CsvPerl =
===========

The CsvPerl framework offers the same functionality as Csv, but instead of dealing with the raw input files directly, it allows you to run a perl script to modify them and produce a CSV file with the expected input format for the Csv framework.


============
= form.xml =
============

In your form.xml, specify the input parameters you need for your Data Provider.
Our example will use two parameters: a path to a CSV file and another text parameter:

<?xml version="1.0" encoding="UTF-8"?>
<tags baseName="CsvPerl" needSources="true">
	<tag type="text" key="csv" defaultValue="/path/to/csv" />
	<tag type="text" key="param" defaultValue="MyValue" />
</tags>

- Since Csv-based data providers commonly rely on artefacts created by Squan Sources, you can set the needSources attribute to force users to specify at least one repository connector when creating a project.


==============
= config.tcl =
==============

Refer to the description of config.tcl for the Csv framework.

For CsvPerl one more option is possible:

# The variable NeedSources is used to request the perl script to be executed once for each
# repository node of the project. In that case an additional parameter is sent to the
# perl script (see below for its position)
#set ::NeedSources 1


==========================
= Sample CSV Input Files =
==========================

Refer to the examples for the Csv framework.


===============
= Perl Script =
===============

The perl scipt will receive as arguments:
 - all parameters defined in form.xml (as -${key} $value)
 - the input directory to process (only if ::NeedSources is set to 1 in the config.tcl file)
 - the location of the output directory where temporary files can be generated
 - the full path of the csv file to be generated

For the form.xml we created earlier in this document, the command line will be:
 perl <configuration_folder>/tools/CustomDP/CustomDP.pl -csv /path/to/csv -param MyValue <output_folder> <output_folder>/CustomDP.csv

Example of perl script:
======================
#!/usr/bin/perl
use strict;
use warnings;
$|=1 ;

($csvKey, $csvValue, $paramKey, $paramValue, $output_folder, $output_csv) = @ARGV;

	# Parse input CSV file
	# ...

	# Write results to CSV
	open(CSVFILE, ">" . ${output_csv}) || die "perl: can not write: $!\n";
	binmode(CSVFILE, ":utf8");
	print CSVFILE  "ChangeRequest;15";
	close CSVFILE;

exit 0;
===========
= Generic =
===========
The Generic framework is the most flexible Data Provider framework, since it allows attaching metrics, findings, textual information and links to artefacts. If the artefacts do not exist in your project, they will be created automatically. It takes one or more CSV files as input (one per type of information you want to import) and works with any type of artefact.
============
= form.xml =
============
In form.xml, allow users to specify the path to a CSV file for each type of data you want to import.
You can set needSources to true or false, depending on whether or not you want to require the use of a repository connector when your custom Data Provider is used.
Example of form.xml file:
=========================
<?xml version="1.0" encoding="UTF-8"?>
<tags baseName="Generic" needSources="false">
<!-- Path to CSV file containing Metrics data -->
<tag type="text" key="csv" defaultValue="mydata.csv" />
<!-- Path to CSV file containing Findings data: -->
<tag type="text" key="fdg" defaultValue="mydata_fdg.csv" />
<!-- Path to CSV file containing Information data: -->
<tag type="text" key="inf" defaultValue="mydata_inf.csv" />
<!-- Path to CSV file containing Links data: -->
<tag type="text" key="lnk" defaultValue="mydata_lnk.csv" />
</tags>
Note: All tags are optional. You only need to specify the tag element for the type of data you want to import with your custom Data Provider.
==============
= config.tcl =
==============
Sample config.tcl file:
=======================
# The separator used in the input csv files
# Usually \t or ; or ,
# In our example below, a space is used.
set Separator " "
# The delimiter used in the input CSV file
# This is normally left empty, except when you know that some of the values in the CSV file
# contain the separator itself, for example:
# "A text containing ; the separator";no problem;end
# In this case, you need to set the delimiter to \" in order for the data provider to find 3 values instead of 4.
# To include the delimiter itself in a value, you need to escape it by duplicating it, for example:
# "A text containing "" the delimiter";no problemo;end
# Default: none
set Delimiter \"
# The path separator in an artefact's path
# in the input CSV file.
# Note that artefact is spellt with an "i"
# and not an "e" in this option.
set ArtifactPathSeparator "/"
# If the data provider needs to specify a different toolName (optional)
set SpecifyToolName 1
# Metric2Key contains a case-sensitive list of paired metric IDs:
# {MeasureID KeyName [Format]}
# where:
# - MeasureID is the id of the measure as defined in your analysis model
# - KeyName is the name in the cell preceding the value to import as found in the input CSV file
# - Format is the optional format of the data, the only accepted format
# is "text" to attach textual information to an artefact. Note that the same result can also
# be achieved with Info2Key (see below). For normal metrics omit this field.
set Metric2Key {
{CHANGES Changed}
}
# Finding2Key contains a case-sensitive list of paired rule IDs:
# {FindingID KeyName}
# where:
# - FindingID is the id of the rule as defined in your analysis model
# - KeyName is the name in the finding name in the input CSV file
set Finding2Key {
{R_NOTLINKED NotLinked}
}
# Info2Key contains a case-sensitive list of paired info IDs:
# {InfoID KeyName}
# where:
# - InfoID is the id of the textual information as defiend in your analysis model
# - KeyName is the name of the information name in the input CSV file
set Info2Key
{SPECIAL_LABEL Label}
}
# Ignore findings for artefacts that are not part of the project (orphan findings)
# When set to 1, the findings are ignored
# When set to 0, the findings are imported and attached to the APPLICATION node
# (default: 1)
set IgnoreIfArtefactNotFound 1
# For findings of a type that is not in your ruleset, set a default rule ID.
# The value for this parameter must be a valid rule ID from your analysys model.
# (default: empty)
set UnknownRuleId UNKNOWN_RULE
# Save the total count of orphan findings as a metric at application level
# Specify the ID of the metric to use in your analysys model
# to store the information
# (default: empty)
set OrphanArteCountId NB_ORPHANS
# Save the total count of unknown rules as a metric at application level
# Specify the ID of the metric to use in your analysys model
# to store the information
# (default: empty)
set OrphanRulesCountId NB_UNKNOWN_RULES
# Save the list of unknown rule IDs as textual information at application level
# Specify the ID of the metric to use in your analysys model
# to store the information
# (default: empty)
set OrphanRulesListId UNKNOWN_RULES_INFO
====================
= CSV File Format =
====================
All the examples listed below assume the use of the following config.tcl:
set Separator ","
set ArtifactPathSeparator "/"
set Metric2Key {
{CHANGES Changed}
}
set Finding2Key {
{R_NOTLINKED NotLinked}
}
set Info2Key
{SPECIAL_LABEL Label}
}
Layout for Metrics File:
========================
==> artefact_type artefact_path (Key Value)*
When the parent artefact type is not given it defaults to <artefact_type>_FOLDER.
Example:
REQ_MODULE,Requirements/Module
REQUIREMENT,Requirements/Module/My_Req,Changed,1
will produce the following artefact tree:
Application
Requirements (type: REQ_MODULE_FOLDER)
Module (type: REQ_MODULE)
My_Req : (type: REQUIREMENT) with 1 metric CHANGES = 1
Note: the key "Changed" is mapped to the metric "CHANGES", as specified by the Metric2Key parameter, so that it matches what is expected by the model.
Layout for Findings File:
=========================
==> artefact_type artefact_path key message
When the parent artefact type is not given it defaults to <artefact_type>_FOLDER.
Example:
REQ_MODULE,Requirements/Module
REQUIREMENT,Requirements/Module/My_Req,NotLinked,A Requiremement should always been linked
will produce the following artefact tree:
Application
Requirements (type: REQ_MODULE_FOLDER)
Module (type: REQ_MODULE)
My_Req (type: REQUIREMENT) with 1 finding R_NOTLINKED whose description is "A Requiremement should always been linked"
Note: the key "NotLinked" is mapped to the finding "R_NOTLINKED", as specified by the Finding2Key parameter, so that it matches what is expected by the model.
Layout for Textual Information File:
====================================
==> artefact_type artefact_path label value
When the parent artefact type is not given it defaults to <artefact_type>_FOLDER.
Example:
REQ_MODULE,Requirements/Module
REQUIREMENT,Requirements/Module/My_Req,Label,This is the label of the req
will produce the following artefact tree:
Application
Requirements (type: REQ_MODULE_FOLDER)
Module (type: REQ_MODULE)
My_Req (type: REQUIREMENT) with 1 information of type SPECIAL_LABEL whose content is "This is the label of the req"
Note: the label "Label" is mapped to the finding "SPECIAL_LABEL", as specified by the Info2Key parameter, so that it matches what is expected by the model.
Layout for Links File:
======================
==> artefact_type artefact_path dest_artefact_type dest_artefact_path link_type
When the parent artefact type is not given it defaults to <artefact_type>_FOLDER
Example:
REQ_MODULE Requirements/Module
TEST_MODULE Tests/Module
REQUIREMENT Requirements/Module/My_Req TEST Tests/Module/My_test TESTED_BY
will produce the following artefact tree:
Application
Requirements (type: REQ_MODULE_FOLDER)
Module (type: REQ_MODULE)
My_Req (type: REQUIREMENT) ------>
Tests (type: TEST_MODULE_FOLDER) |
Module (type: TEST_MODULE) |
My_Test (type: TEST) <------------+ link (type: TESTED_BY)
The TESTED_BY relationship is created with My_Req as source of the link and My_test as the destination
CSV file organisation when SpecifyToolName is set to 1
======================================================
When the variable SpecifyToolName is set to 1 (or true) a column has to be added
at the beginning of each line in each csv file. This column can be empty or filled with a different toolName.
Example:
,REQ_MODULE,Requirements/Module
MyReqChecker,REQUIREMENT,Requirements/Module/My_Req Label,This is the label of the req
The finding of type Label will be set as reported by the tool "MyReqChecker".===============
= GenericPerl =
===============
The GenericPerl framework is an extension of the Generic framework that starts by running a perl script in order to generate the metrics, findings, information and links files. It is useful if you have an input file whose format needs to be converted to match the one expected by the Generic framework, or if you need to retrieve and modify information exported from a web service on your network.
============
= form.xml =
============
In your form.xml, specify the input parameters you need for your Data Provider.
Our example will use two parameters: a path to a CSV file and another text parameter:
<?xml version="1.0" encoding="UTF-8"?>
<tags baseName="CsvPerl" needSources="false">
<tag type="text" key="csv" defaultValue="/path/to/csv" />
<tag type="text" key="param" defaultValue="MyValue" />
</tags>
==============
= config.tcl =
==============
Refer to the description of config.tcl for the Generic framework for the basic options.
Additionally, the following options are available for the GenericPerl framework, in order to know which type of information your custom Data Provider should try to import.
# If the data provider needs to specify a different toolName (optional)
#set SpecifyToolName 1
# Set to 1 to import metrics csv file, 0 otherwise
# ImportMetrics
# When set to 1, your custom Data Provider (CustomDP) will try to import
# metrics from a file called CustomDP.mtr.csv that your perl script
# should generate according to the expected format described in the
# documentation of the Generic framework.
set ImportMetrics 1
# ImportInfos
# When set to 1, your custom Data Provider (CustomDP) will try to import
# textual information from a file called CustomDP.inf.csv that your perl script
# should generate according to the expected format described in the
# documentation of the Generic framework.
set ImportInfos 0
# ImportFindings
# When set to 1, your custom Data Provider (CustomDP) will try to import
# findings from a file called CustomDP.fdg.csv that your perl script
# should generate according to the expected format described in the
# documentation of the Generic framework.
set ImportFindings 1
# ImportLinks
# When set to 1, your custom Data Provider (CustomDP) will try to import
# artefact links from a file called CustomDP.lnk.csv that your perl script
# should generate according to the expected format described in the
# documentation of the Generic framework.
set ImportLinks 0
# Ignore findings for artefacts that are not part of the project (orphan findings)
# When set to 1, the findings are ignored
# When set to 0, the findings are imported and attached to the APPLICATION node
# (default: 1)
set IgnoreIfArtefactNotFound 1
# For findings of a type that is not in your ruleset, set a default rule ID.
# The value for this parameter must be a valid rule ID from your analysys model.
# (default: empty)
set UnknownRuleId UNKNOWN_RULE
# Save the total count of orphan findings as a metric at application level
# Specify the ID of the metric to use in your analysys model
# to store the information
# (default: empty)
set OrphanArteCountId NB_ORPHANS
# Save the total count of unknown rules as a metric at application level
# Specify the ID of the metric to use in your analysys model
# to store the information
# (default: empty)
set OrphanRulesCountId NB_UNKNOWN_RULES
# Save the list of unknown rule IDs as textual information at application level
# Specify the ID of the metric to use in your analysys model
# to store the information
# (default: empty)
set OrphanRulesListId UNKNOWN_RULES_INFO
====================
= CSV File Format =
====================
Refer to the examples in the Generic framework.
===============
= Perl Script =
===============
The perl scipt will receive as arguments:
- all parameters defined in form.xml (as -${key} $value)
- the location of the output directory where temporary files can be generated
- the full path of the metric csv file to be generated (if ImportMetrics is set to 1 in config.tcl)
- the full path of the findings csv file to be generated (if ImportFindings is set to 1 in config.tcl)
- the full path of the textual information csv file to be generated (if ImportInfos is set to 1 in config.tcl)
- the full path of the links csv file to be generated (if ImportLinks is set to 1 in config.tcl)
- the full path to the output directory used by this data provider in the previous analysis
For the form.xml and config.tcl we created earlier in this document, the command line will be:
perl <configuration_folder>/tools/CustomDP/CustomDP.pl -csv /path/to/csv -param MyValue <output_folder> <output_folder>/CustomDP.mtr.csv <output_folder>/CustomDP.fdg.csv <previous_output_folder>
The following perl functions are made available in the perl environment so you can use them in your script:
- get_tag_value(key) (returns the value for $key parameter from your form.xml)
- get_output_metric()
- get_output_finding()
- get_output_info()
- get_output_link()
- get_output_dir()
- get_input_dir() (returns the folder containing sources if needSources is set to 1)
- get_previous_dir()
Example of perl script:
======================
#!/usr/bin/perl
use strict;
use warnings;
$|=1 ;
# Parse input CSV file
my $csvFile = get_tag_value("csv");
my $param = get_tag_value("param");
# ...
# Write metrics to CSV
open(METRICS_FILE, ">" . get_output_metric()) || die "perl: can not write: $!\n";
binmode(METRICS_FILE, ":utf8");
print METRICS_FILE "REQUIREMENTS;Requirements/All_Requirements;NB_REQ;15";
close METRICS_FILE;
# Write findings to CSV
open(FINDINGS_FILE, ">" . get_output_findings()) || die "perl: can not write: $!\n";
binmode(FINDINGS_FILE, ":utf8");
print FINDINGS_FILE "REQUIREMENTS;Requirements/All_Requirements;R_LOW_REQS;\"The minimum number of requirement should be at least 25.\"";
close FINDINGS_FILE;
exit 0;================
= FindingsPerl =
================
The FindingsPerl framework is used to import findings and attach them to existing artefacts. Optionally, if an artefact cannot be found in your project, the finding can be attached to the root node of the project instead. When launching a Data Provider based on the FindingsPerl framework, a perl script is run first. This perl script is used to generate a CSV file with the expected format which will then be parsed by the framework.
============
= form.xml =
============
In your form.xml, specify the input parameters you need for your Data Provider.
Our example will use two parameters: a path to a CSV file and another text parameter:
<?xml version="1.0" encoding="UTF-8"?>
<tags baseName="CsvPerl" needSources="true">
<tag type="text" key="csv" defaultValue="/path/to/csv" />
<tag type="text" key="param" defaultValue="MyValue" />
</tags>
- Since FindingsPerl-based data providers commonly rely on artefacts created by Squan Sources, you can set the needSources attribute to force users to specify at least one repository connector when creating a project.
==============
= config.tcl =
==============
Sample config.tcl file:
=======================
# The separator to be used in the generated CSV file
# Usually \t or ;
set Separator ";"
# The delimiter used in the input CSV file
# This is normally left empty, except when you know that some of the values in the CSV file
# contain the separator itself, for example:
# "A text containing ; the separator";no problem;end
# In this case, you need to set the delimiter to \" in order for the data provider to find 3 values instead of 4.
# To include the delimiter itself in a value, you need to escape it by duplicating it, for example:
# "A text containing "" the delimiter";no problemo;end
# Default: none
set Delimiter \"
# Should the perl script execcuted once for each repository node of the project ?
# 1 or 0 (default)
# If true an additional parameter is sent to the
# perl script (see below for its position)
set ::NeedSources 0
# Should the violated rules definitions be generated?
# true or false (default)
# This creates a ruleset file with rules that are not already
# part of your analysis model so you can review it and add
# the rules manually if needed.
set generateRulesDefinitions false
# Should the File paths be case-insensitive?
# true or false (default)
# This is used when searching for a matching artefact in already-existing artefacts.
set PathsAreCaseInsensitive false
# Should file artefacts declared in the input CSV file be created automatically?
# true (default) or false
set CreateMissingFile true
# Ignore findings for artefacts that are not part of the project (orphan findings)
# When set to 0, the findings are imported and attached to the APPLICATION node instead of the real artefact
# When set to 1, the findings are not imported at all
# (default: 0)
set IgnoreIfArtefactNotFound 0
# For findings of a type that is not in your ruleset, set a default rule ID.
# The value for this parameter must be a valid rule ID from your analysis model.
# (default: empty)
set UnknownRuleId UNKNOWN_RULE
# Save the total count of orphan findings as a metric at application level
# Specify the ID of the metric to use in your analysys model
# to store the information
# (default: empty)
set OrphanArteCountId NB_ORPHANS
# Save the total count of unknown rules as a metric at application level
# Specify the ID of the metric to use in your analysys model
# to store the information
# (default: empty)
set OrphanRulesCountId NB_UNKNOWN_RULES
# Save the list of unknown rule IDs as textual information at application level
# Specify the ID of the metric to use in your analysys model
# to store the information
# (default: empty)
set OrphanRulesListId UNKNOWN_RULES_INFO
# The tool version to specify in the generated rules definitions
# The default value is ""
# Note that the toolName is the name of the folder you created
# for your custom Data Provider
set ToolVersion ""
# FileOrganisation defines the layout of the CSV file that is produced by your perl script:
# header::column: values are referenced from the column header
# header::line: NOT AVAILABLE
# alternate::line: NOT AVAILABLE
# alternate::column: NOT AVAILABLE
set FileOrganisation header::column
# In order to attach a finding to an artefact of type FILE:
# - Tool (optional) if present it overrides the name of the tool providing the finding
# - Path has to be the path of the file
# - Type has to be set to FILE
# - Line can be either empty or the line in the file where the finding is located
# Rule is the rule identifier, can be used as is or translated using Rule2Key
# Descr is the description message, which can be empty
#
# In order to attach a finding to an artefact of type FUNCTION:
# - Tool (optional) if present it overrides the name of the tool providing the finding
# - Path has to be the path of the file containing the function
# - Type has to be FUNCTION
# - If line is an integer, the system will try to find an artefact function
# at the given line of the file
# - If no Line or Line is not an integer, Name is used to find an artefact in
# the given file having name and signature as found in this column.
# (Line and Name are optional columns)
# Rule2Key contains a case-sensitive list of paired rule IDs:
# {RuleID KeyName}
# where:
# - RuleID is the id of the rule as defined in your analysis model
# - KeyName is the rule ID as written by your perl script in the produced CSV file
# Note: Rules that are not mapped keep their original name. The list of unmapped rules is in the log file generated by your Data Provider.
set Rule2Key {
{ ExtractedRuleID_1 MappedRuleId_1 }
{ ExtractedRuleID_2 MappedRuleId_2 }
}
====================
= CSV File Format =
====================
According to the options defined earlier in config.tcl, a valid csv file would be:
Path;Type;Line;Name;Rule;Descr
/src/project/module1/f1.c;FILE;12;;R1;Rule R1 is violated because variable v1
/src/project/module1/f1.c;FUNCTION;202;;R4;Rule R4 is violated because function f1
/src/project/module2/f2.c;FUNCTION;42;;R1;Rule R1 is violated because variable v2
/src/project/module2/f2.c;FUNCTION;;skip_line(int);R1;Rule R1 is violated because variable v2
Working With Paths:
===================
- Path seperators are unified: you do not need to worry about handling differences between Windows and Linux
- With the option PathsAreCaseInsensitive, case is ignored when searching for files in the Squore internal data
- Paths known by Squore are relative paths starting at the root of what was specified in the repository connector durign the analysis. This relative path is the one used to match with a path in a csv file.
Here is a valid example of file matching:
1. You provide C:\A\B\C\D as the root folder in a repository connector
2. C:\A\B\C\D contains E\e.c then Squore will know E/e.c as a file
3. You provide a csv file produced on linux and containing
/tmp/X/Y/E/e.c as path, then Squore will be able to match it with the known file.
Squore uses the longest possible match.
In case of conflict, no file is found and a message is sent to the log.
===============
= Perl Script =
===============
The perl scipt will receive as arguments:
- all parameters defined in form.xml (as -${key} $value)
- the input directory to process (only if ::NeedSources is set to 1)
- the location of the output directory where temporary files can be generated
- the full path of the findings csv file to be generated
For the form.xml and config.tcl we created earlier in this document, the command line will be:
perl <configuration_folder>/tools/CustomDP/CustomDP.pl -csv /path/to/csv -param MyValue <output_folder> <output_folder>/CustomDP.fdg.csv <output_folder>/CustomDP.fdg.csv
Example of perl script:
======================
#!/usr/bin/perl
use strict;
use warnings;
$|=1 ;
($csvKey, $csvValue, $paramKey, $paramValue, $output_folder, $output_csv) = @ARGV;
# Parse input CSV file
# ...
# Write results to CSV
open(CSVFILE, ">" . ${output_csv}) || die "perl: can not write: $!\n";
binmode(CSVFILE, ":utf8");
print CSVFILE "Path;Type;Line;Name;Rule;Descr";
print CSVFILE "/src/project/module1/f1.c;FILE;12;;R1;Rule R1 is violated because variable v1";
close CSVFILE;
exit 0;================
= ExcelMetrics =
================
The ExcelMetrics framework is used to extract information from one or more Microsoft Excel files (.xls or .xslx). A detailed configuration file allows defining how the Excel document should be read and what information should be extracted. This framework allows importing metrics, findings and textual information to existing artefacts or artefacts that will be created by the Data Provider.
============
= form.xml =
============
You can customise form.xml to either:
- specify the path to a single Excel file to import
- specify a pattern to import all Excel files matching this pattern in a directory
In order to import a single Excel file:
=====================================
<?xml version="1.0" encoding="UTF-8"?>
<tags baseName="ExcelMetrics" needSources="false">
<tag type="text" key="excel" defaultValue="/path/to/mydata.xslx" />
</tags>
Notes:
- The excel key is mandatory.
In order to import all files matching a patter in a folder:
===========================================================
<?xml version="1.0" encoding="UTF-8"?>
<tags baseName="ExcelMetrics" needSources="false">
<!-- Root directory containing Excel files to import-->
<tag type="text" key="dir" defaultValue="/path/to/mydata" />
<!-- Pattern that needs to be matched by a file name in order to import it-->
<tag type="text" key="ext" defaultValue="*.xlsx" />
<!-- search for files in sub-folders -->
<tag type="booleanChoice" defaultValue="true" key="sub" />
</tags>
Notes:
- The dir and ext keys are mandatory
- The sub key is optional (and its value set to false if not specified)
==============
= config.tcl =
==============
Sample config.tcl file:
=======================
# The separator to be used in the generated csv file
# Usually \t or ; or ,
set Separator ";"
# The delimiter used in the input CSV file
# This is normally left empty, except when you know that some of the values in the CSV file
# contain the separator itself, for example:
# "A text containing ; the separator";no problem;end
# In this case, you need to set the delimiter to \" in order for the data provider to find 3 values instead of 4.
# To include the delimiter itself in a value, you need to escape it by duplicating it, for example:
# "A text containing "" the delimiter";no problemo;end
# Default: none
set Delimiter \"
# The path separator in an artefact's path
# in the generated CSV file.
set ArtefactPathSeparator "/"
# Ignore findings for artefacts that are not part of the project (orphan findings)
# When set to 1, the findings are ignored
# When set to 0, the findings are imported and attached to the APPLICATION node
# (default: 1)
set IgnoreIfArtefactNotFound 1
# For findings of a type that is not in your ruleset, set a default rule ID.
# The value for this parameter must be a valid rule ID from your analysys model.
# (default: empty)
set UnknownRuleId UNKNOWN_RULE
# Save the total count of orphan findings as a metric at application level
# Specify the ID of the metric to use in your analysys model
# to store the information
# (default: empty)
set OrphanArteCountId NB_ORPHANS
# Save the total count of unknown rules as a metric at application level
# Specify the ID of the metric to use in your analysys model
# to store the information
# (default: empty)
set OrphanRulesCountId NB_UNKNOWN_RULES
# Save the list of unknown rule IDs as textual information at application level
# Specify the ID of the metric to use in your analysys model
# to store the information
# (default: empty)
set OrphanRulesListId UNKNOWN_RULES_INFO
# The list of the Excel sheets to read, each sheet has the number of the first line to read
# A Perl regexp pattern can be used instead of the name of the sheet (the first sheet matching
# the pattern will be considered)
set Sheets {{Baselines 5} {ChangeNotes 5}}
# ######################
# # COMMON DEFINITIONS #
# ######################
#
# - <value> is a list of column specifications whose values will be concatened. When no column name is present, the
# text is taken as it appears. Optional sheet name can be added (with ! char to separate from the column name)
# Examples:
# - {C:} the value will be the value in column C on the current row
# - {C: B:} the value will be the concatenation of values found in column C and B of the current row
# - {Deliveries} the value will be Deliveries
# - {BJ: " - " BL:} the value will be the concatenation of value found in column BJ,
# string " - " and the value found in column BL fo the current row
# - {OtherSheet!C:} the value will be the value in column C from the sheet OtherSheet on the current row
#
# - <condition> is a list of conditions. An empty condition is always true. A condition is a column name followed by colon,
# optionally followed by a perl regexp. Optional sheet name can be added (with ! char to separate from the column name)
# Examples:
# - {B:} the value in column B must be empty on the current row
# - {B:.+} the value in column B can not be empty on the current row
# - {B:R_.+} the value in column B is a word starting by R_ on the current row
# - {A: B:.+ C:R_.+} the value in column A must be empty and the value in column B must contain something and
# the column C contains a word starting with R_ on the current row
# - {OtherSheet!B:.+} the value in column B from sheet OtherSheet on the current row can not be empty.
# #############
# # ARTEFACTS #
# #############
# The variable is a list of artefact hierarchy specification:
# {ArtefactHierarchySpec1 ArtefactHierarchySpec2 ... ArtefactHierarchySpecN}
# where each ArtefactHierarchySpecx is a list of ArtefactSpec
#
# An ArtefactSpec is a list of items, each item being:
# {<(sheetName!)?artefactType> <conditions> <name> <parentType>? <parentName>?}
# where:
# - <(sheetName!)?artefactType>: allows specifying the type. Optional sheetName can be added (with ! char to separate from the type) to limit
# the artefact search in one specific sheet. When Sheets are given with regexp, the same regexp has to be used
# for the sheetName.
# If the type is followed by a question mark (?), this level of artefact is optional.
# If the type is followed by a plus char (+), this level is repeatable on the next row
# - <condition>: see COMMON DEFINITIONS
# - <value>: the name of the artefact to build, see COMMON DEFINITIONS
#
# - <parentType>: This element is optional. When present, it means that the current element will be attached to a parent having this type
# - <parentValue>: This is a list like <value> to build the name of the artefact of type <parentType>. If such artefact is not found,
# the current artefact does not match
#
# Note: to add metrics at application level, specify an APPLICATION artefact which will match only one line:
# e.g. {APPLICATION {A:.+} {}} will recognize as application the line having column A not empty.
set ArtefactsSpecs {
{
{DELIVERY {} {Deliveries}}
{RELEASE {E:.+} {E:}}
{SPRINT {O:SW_Software} {Q:}}
}
{
{DELIVERY {} {Deliveries}}
{RELEASE {O:SY_System} {Q:}}
}
{
{WP {BL:.+ AF:.+} {BJ: " - " BL:} SPRINT {AF:}}
{ChangeNotes!TASK {D:(added|changed|unchanged) T:imes} {W: AD:}}
}
{
{WP {} {{Unplanned imes}} SPRINT {AF:}}
{TASK {BL: D:(added|changed|unchanged) T:imes W:.+} {W: AD:}}
}
}
# ###########
# # METRICS #
# ###########
# Specification of metrics to be retreived
# This is a list where each element is:
# {<artefactTypeList> <metricId> <condition> <value> <format>}
# Where:
# - <artefactTypeList>: the list of artefact types for which the metric has to be used
# each element of the list is (sheetName!)?artefactType where sheetName is used
# to restrict search to only one sheet. sheetName is optional.
# - <metricId>: the name of the MeasureId to be injected into Squore, as defined in your analysis model
# - <confition>: see COMMON DEFINITIONS above. This is the condition for the metric to be generated.
# - <value> : see COMMON DEFINITIONS above. This is the value for the metric (can be built from multi column)
# - <format> : optional, defaults to NUMBER
# Possible format are:
# * DATE_FR, DATE_EN for date stored as string
# * DATE for cell formatted as date
# * NUMBER_FR, NUMBER_EN for number stored as string
# * NUMBER for cell formatted as number
# * LINES for counting the number of text lines in a cell
# - <formatPattern> : optional
# Only used by the LINES format.
# This is a pattern (can contain perl regexp) used to filter lines to count
set MetricsSpecs {
{{RELEASE SPRINT} TIMESTAMP {} {A:} DATE_EN}
{{RELEASE SPRINT} DATE_ACTUAL_RELEASE {} {S:} DATE_EN}
{{RELEASE SPRINT} DATE_FINISH {} {T:} DATE_EN}
{{RELEASE SPRINT} DELIVERY_STATUS {} {U:}}
{{WP} WP_STATUS {} {BO:}}
{{ChangeNotes!TASK} IS_UNPLAN {} {BL:}}
{{TASK WP} DATE_LABEL {} {BP:} DATE_EN}
{{TASK WP} DATE_INTEG_PLAN {} {BD:} DATE_EN}
{{TASK} TASK_STATUS {} {AE:}}
{{TASK} TASK_TYPE {} {AB:}}
}
# ############
# # FINDINGS #
# ############
# This is a list where each element is:
# {<artefactTypeList> <findingId> <condition> <value> <localisation>}
# Where:
# - <artefactTypeList>: the list of artefact type for which the metric has to be used
# each element of the list is (sheetName!)?artefactType where sheetName is used
# to restrict search to only one sheet. sheetName is optional.
# - <findingId>: the name of the FindingId to be injected into Squore, as defined in your analysis model
# - <confition>: see COMMON DEFINITIONS above. This is the condition for the finding to be triggered.
# - <value>: see COMMON DEFINITIONS above. This is the value for the message of the finding (can be built from multi column)
# - <localisation>: this a <value> representing the localisation of the finding (free text)
set FindingsSpecs {
{{WP} {BAD_WP} {BL:.+ AF:.+} {{This WP is not in a correct state } AF:.+} {A:}}
}
# #######################
# # TEXTUAL INFORMATION #
# #######################
# This is a list where each element is:
# {<artefactTypeList> <infoId> <condition> <value>}
# Where:
# - <artefactTypeList> the list of artefact types for which the info has to be used
# each element of the list is (sheetName!)?artefactType where sheetName is used
# to restrict search to only one sheet. sheetName is optional.
# - <infoId> : is the name of the Information to be attached to the artefact, as defined in your analysis model
# - <confition> : see COMMON DEFINITIONS above. This is the condition for the info to be generated.
# - <value> : see COMMON DEFINITIONS above. This is the value for the info (can be built from multi column)
set InfosSpecs {
{{TASK} ASSIGN_TO {} {XB:}}
}
# ########################
# # LABEL TRANSFORMATION #
# ########################
# This is a list value specification for MeasureId or InfoId:
# <MeasureId|InfoId> { {<LABEL1> <value1>} ... {<LABELn> <valuen>}}
# Where:
# - <MeasureId|InfoId> : is either a MeasureId, an InfoId, or * if it is available for every measureid/infoid
# - <LABELx> : is the label to macth (can contain perl regexp)
# - <valuex> : is the value to replace the label by, it has to match the correct format for the metrics (no format for infoid)
#
# Note: only metrics which are labels in the excel file or information which need to be rewriten, need to be described here.
set Label2ValueSpec {
{
STATUS {
{OPENED 0}
{ANALYZED 1}
{CLOSED 2}
{.* -1}
}
}
{
* {
{FATAL 0}
{ERROR 1}
{WARNING 2}
{{LEVEL:\s*0} 1}
{{LEVEL:\s*1} 2}
{{LEVEL:\s*[2-9]+} 3}
}
}
}
Note that a sample Excel file with its associated config.tcl is available in $SQUORE_HOME/addons/tools/ExcelMetrics in order to further explain available configuration options.With the introduction milestones in your project, Squore offers new ways to measure your objectives and detect deviations from your goals early. Milestones are a series of goals for specific metrics at certain dates in the life of your project and add the following to your process management:
You are alerted early if your current performance shows that you will not meet your goals and can react before it is too late
You keep track of your various goals and communicate any change to the rest of your team
You can reflect on a project's history and learn from it
This example focuses on a project that is slipping, and shows how the team reacts along the course of the development process. Our team is tracking several objectives around issue management, technical debt and self-descriptiveness over the lifetime of the project, which includes milestones for 5 sprints labelled SPRINT1 to SPRINT5.
Here is where they stand in the fourth sprint and try to assess whether they will meet their Technical Debt objective for the release date at the end of Sprint 5:
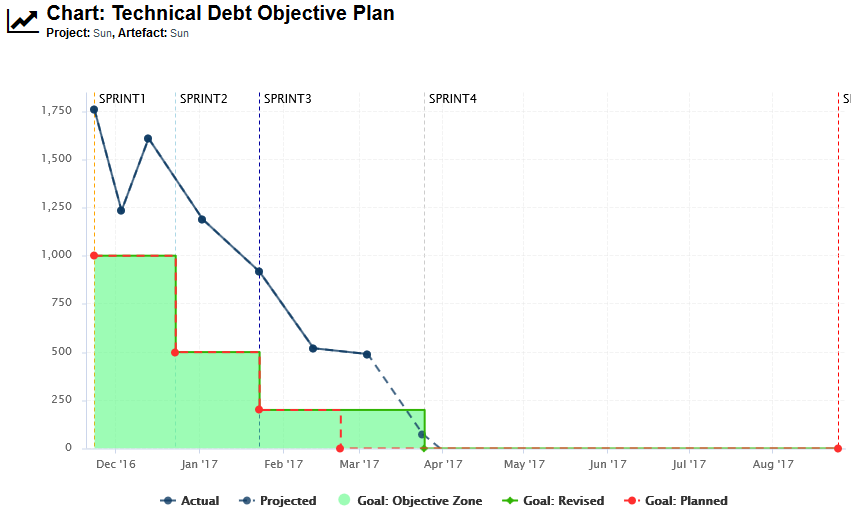
The chart shows the following information:
Vertical dotted lines (markers) on the x-axis for each milestone in the project at the predefined date
A solid dark-blue line showing the technical debt value for each version of the project so far
A dotted dark-blue line showing estimations for technical debt for future versions absed on the progress so far
A dotted red line showing the goals set at the beginning of the project for each sprint for the technical debt metric
A solid green line showing the goals as they were revised as time went on (the date for Sprint 4 was moved back).
A turquoise area highlighting the acceptable range for the tehnical debt for each sprint, making it clear that the technical debt has never been under control so far, but that projections show that the goal should be met by the end of Sprint 3
In order to understand why changes were made to the goals, let's go back to V4 and look at the Technical Debt Objective Plan again. The end of Sprint4 still has its original date, and projections aready show that technical debt will not be under control by the end of the sprint.
Our chart is configured to show the projected value for the next 5 analyses (based on the rate of previous analyses), and the firth projection meeting the expectations for SPRINT4 appear well after the original date for SPRINT4.
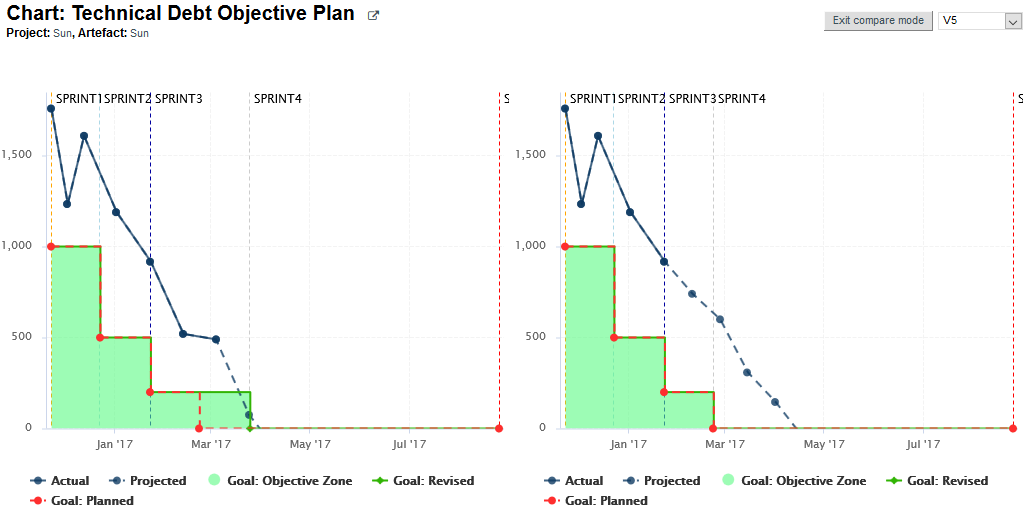
The team knew this at the time: a Objective alert for Technical Debt action item was opened on as early as V3 to inform them that the current performance could cause problems for their objective set 50 days later.
After a team meeting, it is decided that the best course of action is to keep the goal for the SPRINT4 milestone, but move its date back by one month. The next analysis confirms this on the Technical Debt Objective plan chart, where you see the first deviation between the planned goal (red) and the actual goal (green). The progress objective will be now met:
In order to add support for milestones to your model, configure your wizard to allow users to create milestones and goals:
<Bundle xmlns:xi="http://www.w3.org/2001/XInclude">
	<wizard wizardId="ANALYTICS" versionPattern="v#N1#" img="../../Shared/Wizards/squore_logo.png" hideRulesEdition="FALSE">
		<milestones canCreateMilestone="TRUE" canCreateGoal="TRUE">
			<goals displayableFamilies="ANALYTICS_GOALS" />
		</milestones>
	</wizard>
</Bundle>
The
milestones
element allows users to create milestones in
the project wizard (canCreateMilestone="TRUE") and also set goals (canCreateGoal="TRUE").
The goals can be set for metrics of the GOALS family only in this example (displayableFamilies="ANALYTICS_GOALS").
The result in the web UI is the following:

A wizard allowing users to create milestones freely during an analysis
When creating a new project, a user decides to create a Sprint 1 milestone with one objective of 500 for the Technical Debt indicator. Other goals can be set, for the other metrics in the project that belong to the ANALYTICS_GOALS family listed in the dropdown list at the bottom of the table.
If you have company-wide milestones and objectives that need to be set for every project created with the wizard, you can specify the goals directly. Milestones can also be marked as mandatory or optional:
<Bundle xmlns:xi="http://www.w3.org/2001/XInclude">
	<wizard wizardId="ANALYTICS_WITH_MILESTONES" versionPattern="v#N1#" img="../../Shared/Wizards/squore_logo.png" hideRulesEdition="FALSE">
		<milestones canCreateMilestone="TRUE" canCreateGoal="TRUE">
			<goals displayableFamilies="GOALS">
				<goal measureId="TECH_DEBT" mandatory="TRUE" highestIsBest="FALSE" />
				<goal measureId="ISSUE_BLOCKER" mandatory="TRUE" highestIsBest="TRUE" />
				<goal measureId="ISSUE_CRITICAL" mandatory="TRUE" highestIsBest="TRUE" />
				<goal measureId="ROKR_SUBSET" mandatory="TRUE" highestIsBest="FALSE" />
			</goals>
			<milestone id="REQUIREMENT_FREEZE" mandatory="TRUE">
				<defaultGoal measureId="TECH_DEBT" value="0" />
				<defaultGoal measureId="ISSUE_BLOCKER" value="1" />
				<defaultGoal measureId="ISSUE_CRITICAL" value="30" />
				<defaultGoal measureId="ROKR_SUBSET" value="1" />
			</milestone>
			<milestone id="INFRASTRUCTURE_FREEZE" mandatory="TRUE">
				<defaultGoal measureId="TECH_DEBT" value="0" />
				<defaultGoal measureId="ISSUE_BLOCKER" value="1" />
				<defaultGoal measureId="ISSUE_CRITICAL" value="50" />
				<defaultGoal measureId="ROKR_SUBSET" value="1" />
			</milestone>
			<milestone id="CODE_FREEZE" mandatory="TRUE">
				<defaultGoal measureId="TECH_DEBT" value="0" />
				<defaultGoal measureId="ISSUE_BLOCKER" value="1" />
				<defaultGoal measureId="ISSUE_CRITICAL" value="90" />
				<defaultGoal measureId="ROKR_SUBSET" value="0.5" />
			</milestone>
			<milestone id="BETA_RELEASE" mandatory="FALSE">
				<defaultGoal measureId="TECH_DEBT" value="1" />
				<defaultGoal measureId="ISSUE_BLOCKER" value="1" />
				<defaultGoal measureId="ISSUE_CRITICAL" value="95" />
				<defaultGoal measureId="ROKR_SUBSET" value="0.3" />
			</milestone>
			<milestone id="RELEASE" mandatory="TRUE">
				<defaultGoal measureId="TECH_DEBT" value="1" />
				<defaultGoal measureId="ISSUE_BLOCKER" value="1" />
				<defaultGoal measureId="ISSUE_CRITICAL" value="100" />
				<defaultGoal measureId="ROKR_SUBSET" value="0" />
			</milestone>
		</milestones>
	</wizard>
</Bundle>
When creating a new project, the predefined goals are filled in in the web interface, and you can still add a Beta Release milestone (using the default values specified in the wizard bundle) if needed by using the + icon:
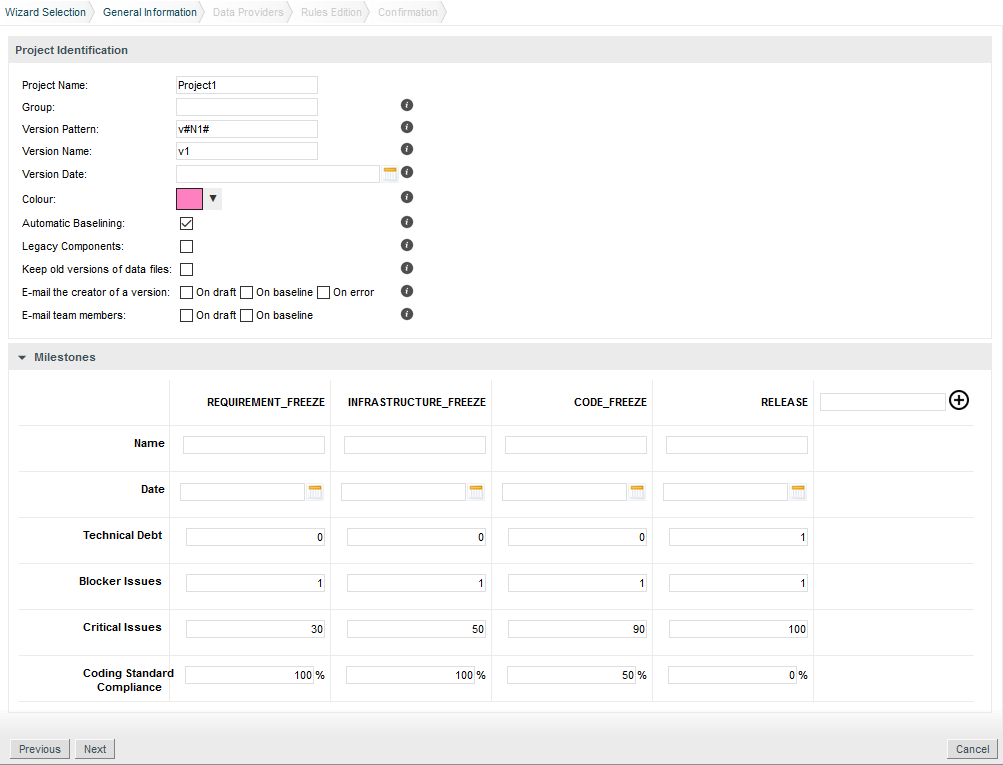
A project wizard with preconfigured milestones and goals
If you create projects using the command line interface, you can specify settings for your milestones with the -M parameter:
-M "id=BETA_RELEASE,date=2017/05/31,ISSUE_CRITICAL=95"
or with a project config file:
<SquoreProjectSettings>
	<Wizard>
		<Milestones>
			<Milestone id="BETA_RELEASE" date="2017-05-31">
				<Goal id="ISSUE_CRITICAL" value="95" />
			</Milestone>
		</Milestones>
	</Wizard>
</SquoreProjectSettings>
In your analysis model, new functions are available to work with milestones and projections:
HAS_MILESTONE([milestoneId or keyword] [, date])
checks if
a milestone with the specified milestoneId exists in the project.
The function returns 0 if no milestone is found, 1 if a milestone is found.
DATE_MILESTONE([milestoneId or keyword] [, date])
returns the date associated to a milestone.
GOAL(measureId [, milestoneId or keyword] [, date])
returns the goal for a metric at a milestone.
You can use keywords instead of using a milestone ID. You can retrieve information about the next, previous, first or last milestones in the project by using:
NEXT
NEXT+STEP
where STEP is a number indicating how many milestones to jump ahead
PREVIOUS
PREVIOUS-STEP
where STEP is a number indicating how many milestones to jump backward
FIRST
LAST
Consut the Configuration Guide for more details.
On your charts, you are now able to:
Display the goals defined for each milestone in your project
Display the changes made to the goals defined for each milestone
Display the date changes for your milestones
Show markers for milestone dates and goals
You can also compute metrics with functions like LEAST_SQUARE_FIT(), which lets you calculate projections. This is how the Task Completion chart used in this example was created. You can find its full definition below:
<chart id="OBJECTIVE_TECH_DEBT" type="TE"  byTime="true" dateFormat="MM/yy" yMin="0" displayOnlyIf="HAD_GOAL_TECH_DEBT">
	<dataset renderer="LINE">
		<measure dataBounds="[0;[" color="#0B3861" stroke="SOLID" shape="CIRCLE" alpha="200" label="Actual">TECH_DEBT</measure>
		<measure color="#0B3861" stroke="DOTTED" shape="CIRCLE" alpha="200" label="Projected">TECH_DEBT
			<forecast>
				<estimatedVersion timeValue="CUR_BUILD_DATE+1*DELTA_MEAN"/>
				<estimatedVersion timeValue="CUR_BUILD_DATE+2*DELTA_MEAN"/>
				<estimatedVersion timeValue="CUR_BUILD_DATE+3*DELTA_MEAN"/>
				<estimatedVersion timeValue="CUR_BUILD_DATE+4*DELTA_MEAN"/>
				<estimatedVersion timeValue="CUR_BUILD_DATE+5*DELTA_MEAN"/>
			</forecast>
		</measure>
	</dataset>

	<dataset renderer="AREA_STEP">
		<goal dataBounds="[0;[" color="88,250,130" stroke="SOLID" shape="DIAMOND" alpha="150" label="Objective Zone">TECH_DEBT</goal>
	</dataset>

	<dataset renderer="STEP">
		<goal dataBounds="[0;[" color="#31B404" stroke="SOLID" shape="DIAMOND" alpha="255" label="Revised">TECH_DEBT</goal>
		<goal dataBounds="[0;[" color="#FE2E2E" stroke="DOTTED" shape="CIRCLE" alpha="255" label="Planned" versionDate="FIRST_BUILD_DATE">TECH_DEBT</goal>
	</dataset>

	<markers>
		<marker alpha="150" color="189,189,189" isVertical="false" endValue="0"/>
		<marker fromMilestones="true" alpha="150" isVertical="true" stroke="DOTTED" />
	</markers>
</chart>
The action items monitoring the project's progress also make use of the new GOAL() function and were defined as follows:
<?xml version="1.0" encoding="utf-8" standalone="yes"?>
<Bundle>
	<DecisionCriteria>
		(...)
		<DecisionCriterion dcId="AI_OBJECTIVE_IN_FUTURE_TECH_DEBT" categories="SCALE_PRIORITY.CRITICAL;SCALE_AI_TYPE.PROCESS_IMPROVEMENT" targetArtefactTypes="APPLICATION">
			<Triggers>
				<Trigger>
					<Test expr="GOAL_ESTIMATED_TECH_DEBT-ESTIMATED_TECH_DEBT" bounds="];0[" descrId="GOAL_WILL_NOT_BE_REACHED" p0="#{MEASURE.GOAL_ESTIMATED_TECH_DEBT}" p1="#{MEASURE.ESTIMATED_TECH_DEBT}" />
					<Test expr="GOAL_TECH_DEBT" bounds="[1;1]" descrId="GOAL_IS_ACTIVATED" p0="#{MEASURE.GOAL_ESTIMATED_TECH_DEBT}" />
					<Test expr="DAY_TO_ESTIMATION" bounds="];[" descrId="DAY_TO_ESTIMATION" p0="#{MEASURE.DAY_TO_ESTIMATION}" />
				</Trigger>
			</Triggers>
		</DecisionCriterion>
	</DecisionCriteria>
</Bundle>
Check out the Getting Started Guide and the Configuration Guide to learn everything about milestones in Squore.


