| Installation and Administration | Getting Started | Command Line | Configuration | Eclipse Plugin | Reference Manual |
| Show on single page Show on multiple pages |
|
|
|
|
The Text Values chart is used to display one or more metrics as a large clickable element in your dashboard. The chart also optionally displays the trend for the displayed metrics.
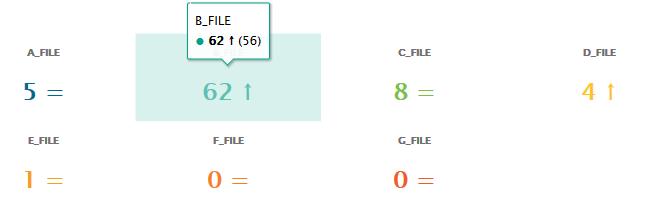
Text Values
<chart type="TEXTVALUES"
  id="TEXTVALUES_EXAMPLE"
  layout="4x3"
  displayEvolution="true">
	<measure color="#006893">A_FILE</measure>
	<measure color="#00a38a">B_FILE</measure>
	<measure color="#79c142">C_FILE</measure>
	<measure color="#fec422">D_FILE</measure>
	<measure color="#f6a01b">E_FILE</measure>
	<measure color="#f48026">F_FILE</measure>
	<measure color="#f25b21">G_FILE</measure>
</chart>
The chart
accepts the following attributes:
layout
(optional, default: 1x1) defines how to display the metrics on the chart in terms of rows and columns.
titleColor
(optional, default: #707070) is the color of the label for chart's title.
displayEvolution
(optional, default: false) allows displaying trends next to the metric's value on the chart.
The Control Flow Chart is a graphical representation of the logical structure of a function using different-coloured shapes reflecting the type of logical break (if, while, switch...) in the code.
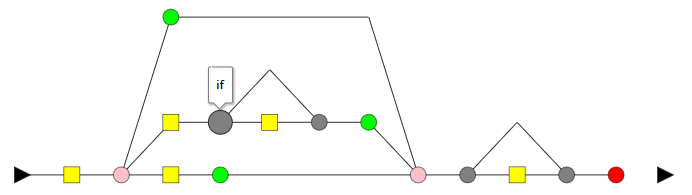
Control Flow Chart
<chart type="CONTROLGRAPH" id="CONTROL_FLOW_GRAPH_EXAMPLE"/>
The chart
for a Control Flow Chart does not have any specific attributes.
The Source Code Viewer is a special chart-like placeholder on a dashboard that allows users to click it to view the source code of the current artefact.
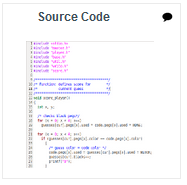
Source Code Viewer
<chart type="SOURCECODE" id="SOURCE_CODE_EXAMPLE"</chart>
The chart
for the Source Code Viewer does not have any specific attributes.
A more flexible version of this chart exists to display scrumboards of child artefacts. For more information, consult Artefact Scrumboard.
The Scrumboard offers a graphical representation of the completion of your tasks for project monitoring. Each task is represented as a sticky note that displays the task ID and provides a link to the issue tracker to review the task.
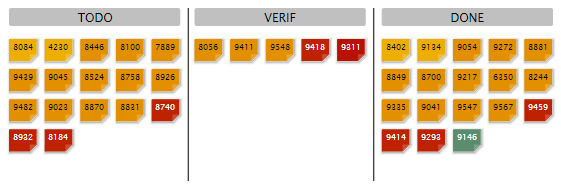
Scrumboard
<chart type="ScrumBoard" postitByColumn="3"
  header="SCALE_PARKING_LOT"
  prefixTaskLink="http://support.example.com/view.php?taskId=" >
	<rule color="255,0,0">EVO_TODO</rule>
	<rule>BUG_TODO</rule>
	<rule>BUG_INT_TODO</rule>
	<rule>EVO_VERIF</rule>
	<rule>BUG_VERIF</rule>
	<rule>BUG_INT_VERIF</rule>
	<rule>EVO_DONE</rule>
	<rule>BUG_DONE</rule>
	<rule>BUG_INT_DONE</rule>
</chart>
The chart
tag accepts the following attributes:
The Scrumboard requires the following elements:
The Artefact Scrumboard offers a graphical representation of child artefacts organised into categories (levels on a scale). Each artefact is represented as a sticky note and is clickable so you can reach the artefact's dashboard directly from the scrumboard.
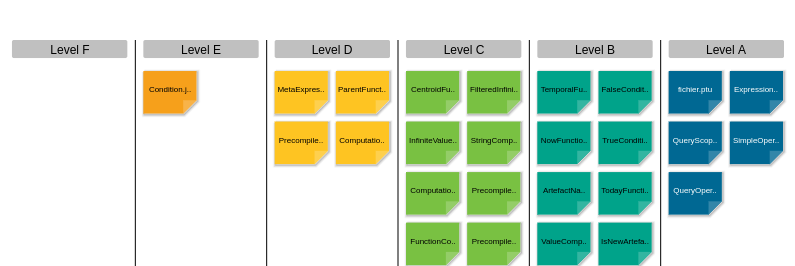
Artefact Scrumboard
<chart type="ARTEFACTSCRUMBOARD"
  id="ARTEFACT_SCRUMBOARD_EXAMPLE"
  targetArtefactTypes="FILE"
  postitByColumn="2"
  displayEmptyData="true"
  orderByMeasure="SLOC"
  invertedLevels="true">
	<indicator excludeLevels="UNKNOWN;LEVELG">ROOT</indicator>
</chart>
The chart
tag accepts the following attributes:
targetArtefactTypes
allows to filter descendants according to their type.
You can use one or more types. Concrete and abstract types are supported, so it is possible to use an alias,
as described in the section called “Artefact Types”.
For Stacked Bar Chart, Simple Temporal Evolution Stacked Bar Chart, Simple Pie, Simple Bar and Distribution Table, the measure and scale associated to the indicator must be the same for all types
onlyDirectChildren
(optional, default: false) includes artefacts that are direct children of the current artefact
when set to true, or all descendants of the current artefact when set to false.
colorFromIndicator
(optional, default: none) uses the specified indicator's colour scale to assign a colour to each item drawn on the chart.
invertedLevels
(optional, default: false) reverses the order of the scale levels on the board when set to true.
postitByColumn
(optional, default: 3) specifies the minimum number of sticky notes to display per line in each category.
maxPostitWidth
(optional, default: dynamic) specifies the maximum width to draw sticky notes. This setting may override the value of postitByColumn in some cases.
displayEmptyData
(optional, default: false) forces the dislay of categories with no sticky notes on the board when set to true.
orderByMeasure
(optional) allows ordering sticky notes in a category according to a specific measure.
inverted
(optional, default: false) reverses the order of sticky notes in each category when set to true (still using the measure defined by orderByMeasure
).
The Artefact Scrumboard requires exactly one indicator
elements to use its scale levels as scrumboard categories.