| > Show on single page > Show on multiple pages |
When you consult the dashboard of a project that uses milestones, the functionality allows you to:
Display the goals defined for each milestone in your project
Display the changes made to the goals defined for each milestone
Display the date changes for your milestones
Show markers for milestone dates and goals
The following is an example of a chart that mixes objectives, projected performance and milestone date changes:
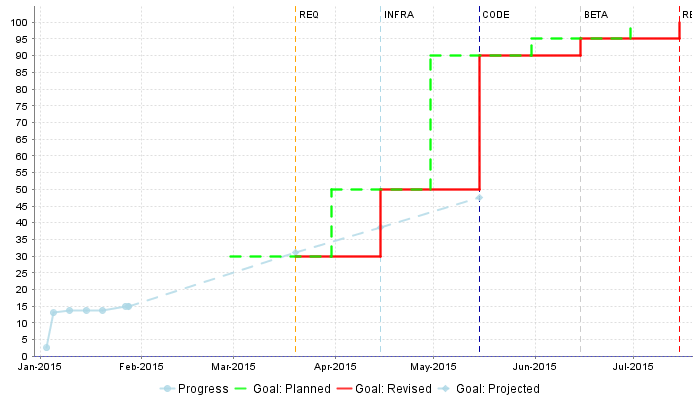
A chart tracking your progress, projected performance, goals and milestone date slips
Some action items on your model can also take advantage of this feature to warn you about poor performance:
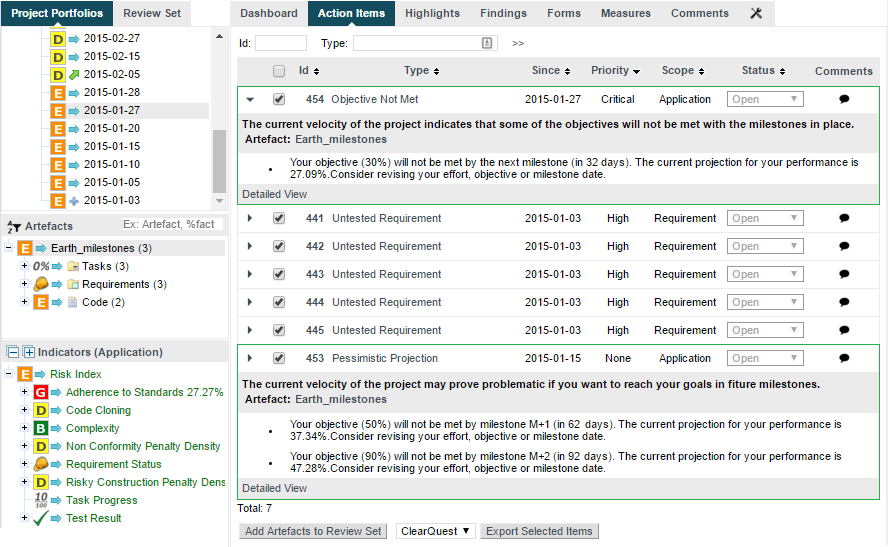
Action items based on milestone dates and goals
For more information on how you can improve your model with milestones and the above chart and action items, refer to Appendix B, Milestones Tutorial and the Configuration Guide.