| > Show on single page > Show on multiple pages |
The Capitalisation Base provides statistics aggregates, distribution graphics and correlation coefficients across a portfolio of projects. To begin using the Capitalisation Base to understand historical trends about your projects and find out if your analysis models are suited to your development style, click the Capitalisation Base menu item in the Squore toolbar.
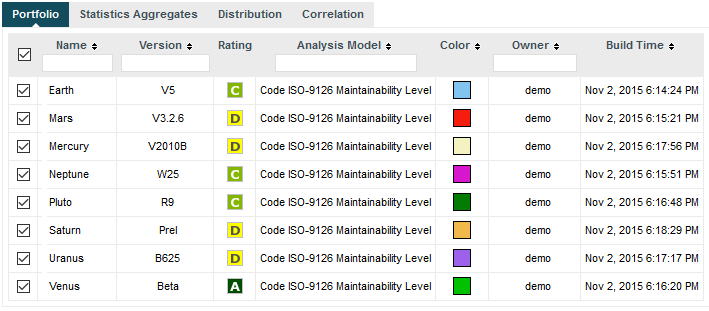
The Capitalisation Base Projects tab
In the projects tab, choose the projects that will be used to aggregate statistics. In the example below, we will look at statistics for the Earth and Mars projects, which both use the same analysis model and have similar overall ratings. Select Earth and Mars from the list and click the Statistics Aggregates.
The Statistics Aggregates tab offers an overview of all your projects' data by providing minimum, maximum, average, number of occurrences, deviation, mod, sum and median results. Results are based on all the measures of an artefact type. This means that you have to specify an artefact type before any data is displayed.
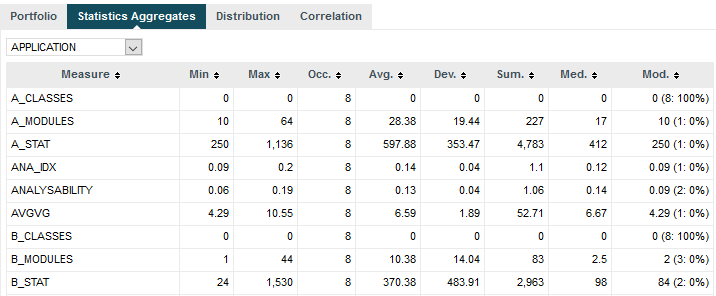
The Capitalisation Base Statistics Aggregates at Application level
The Distribution tab
offers the possibility to display any kind of distribution. The distribution is based on
a measure of an artifact type. As a result, you have to select both an Artefact type and
a Measure before you see any results. Note that you can change the parameters of the distribution graph
by adjusting the number of bars, and the minimum and maximum values for the axes. The picture below shows the distribution
of lines of code (a measure called LC) across all artefacts of type FILE for Mars
and Earth.
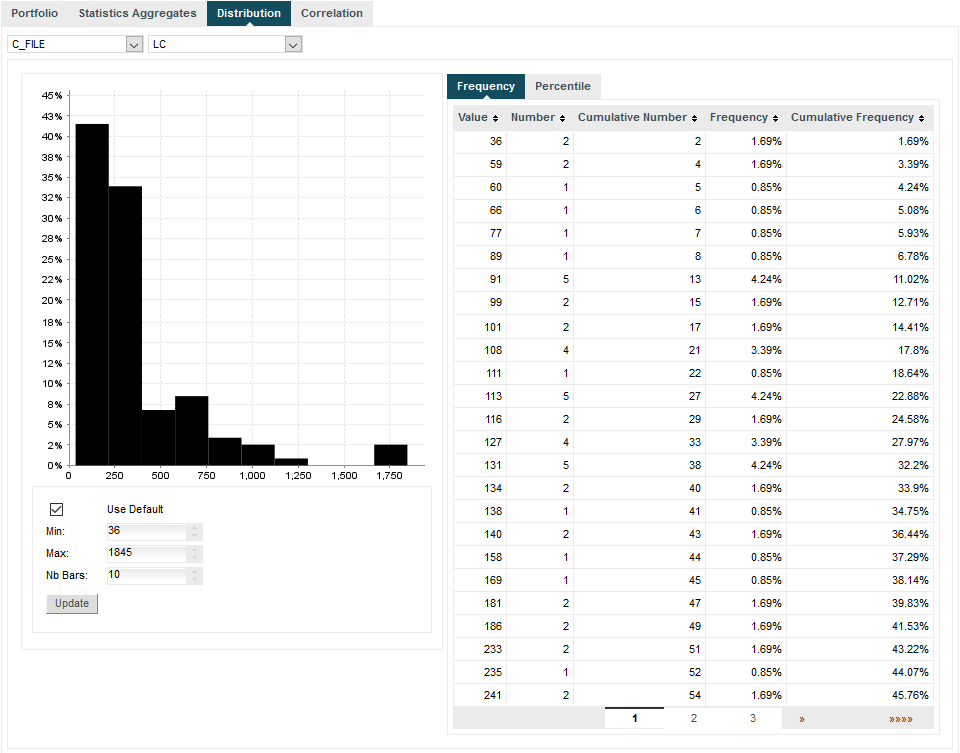
The Capitalisation Base Distribution Graph for lines of code per file
The Correlation tab displays the matrix of correlation of any data stored in the Squore database. Correlations are computed between artefacts of the same type, so you have to select the artefact type before any data is displayed. Squore highlights cells in the table in which correlations are above the threshold defined by moving the slider or entering a correlation coefficient directly in the text box provided. You can choose to include derived data by checking the box above the matrix table.
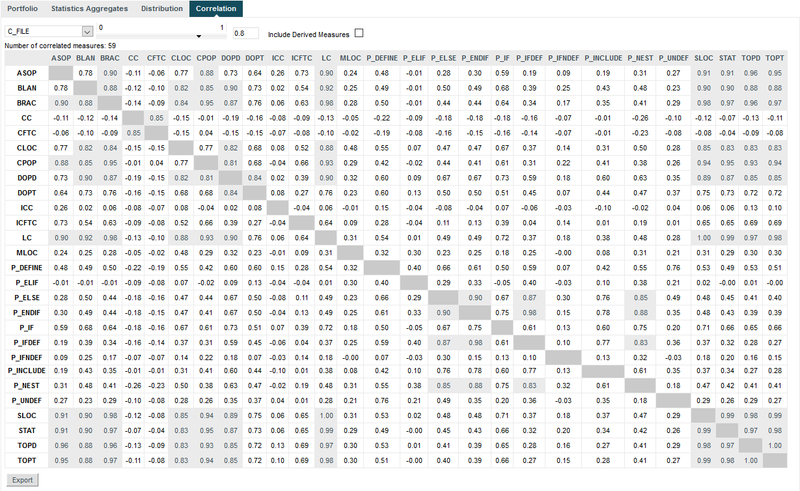
The Capitalisation Base correlation table for files measures with a highlighting threshold of 0.8
Base measures are the ones directly reported by various tools included in the analysis. Derived measures are metrics computed based on these base measures or other derived measures.
You can choose to export the results of the correlation matrix to a CSV file. The resulting CSV file contains all metrics pairs for which a correlation exists.
If the Export button is greyed out, your licence does not include the option to export data to CSV files.