| > Show on single page > Show on multiple pages |
Some charts (Simple Pie and Simple Bar) support dynamically grouping target artefacts according to textual information
in a measure. In order to use this information, you do not use an indicator
or
measure
element but an info
element with the measure holding the
text information.
Here is a sample definition for a Simple Bar chart where each bar is labelled according to the textual information
held in the ASSIGNEE metric.
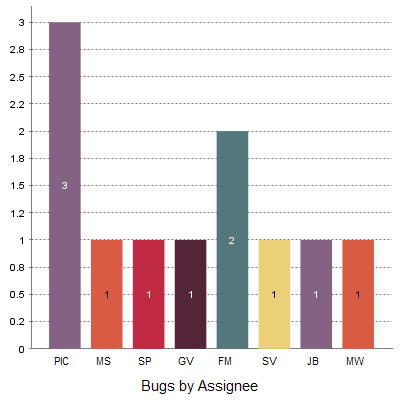
A Simple Bar chart using textual information from ISSUE child artefacts to dynamically display its bars.
You can also display textual information in tables, using the following syntax for example:
<table id="CR_INFO">
  (...)
  <line indicatorId="ASSIGNEE" displayType="TEXT" />
  (...)
</table>
For more information about tables, consult the section called “Scorecard Tables” or the section called “Analysis Model Dashboards”.