| > Show on single page > Show on multiple pages |
This section defines how you can integrate information about your project milestones into your charts. When you define milestones in your project (i.e. a series of goals for specific metrics at certain dates in the life of your project), you will be able to:
Display the goals defined for each milestone in your project
Display the changes made to the goals defined for each milestone
Display the date changes for your milestones
Show markers for milestone dates and goals
For more information about adding milestone management to your project, consult the section called “Project Milestones”.
If your project uses milestones, you can use the goal
element to display
all the expected values for a metric for each milestone in the project. In this case, you simply use the name of the metric whose goals
you want to display:
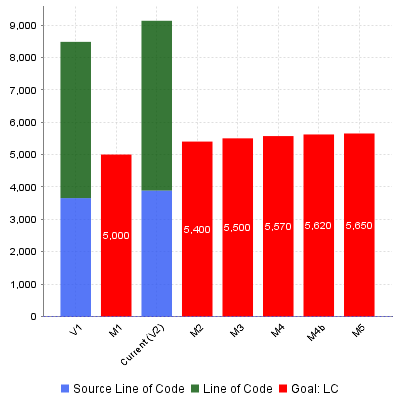
Temporal Evolution Chart displaying the goals for the metric LC for all milestones of the project
<chart type="TemporalEvolution" id="TEMPORAL_EVOLUTION_STACKEDBAR_BAR" timeInterval="WEEK">
  <dataset renderer="STACKEDBAR">
    <measure color="40,81,245" alpha="200" label="Source Line of Code">SLOC</measure>
    <measure color="0,81,0" alpha="200" label="Line of Code">LC</measure>
  </dataset>
  <dataset renderer="BAR">
    <goal color="#ff0000">LC</goal>
  </dataset>
</chart>
In the example above, compare the blue bars with the red bars to compare actual analyses (V1, V2) against the goals for each milestone in the project (M1, M2, M3, M4, M4b and M5) for the metric LC.
You can also request the goals as they were at a certain date with the versionDate
attribute and assign a weight
to the goal, allowing you to draw other lines based on a goal:
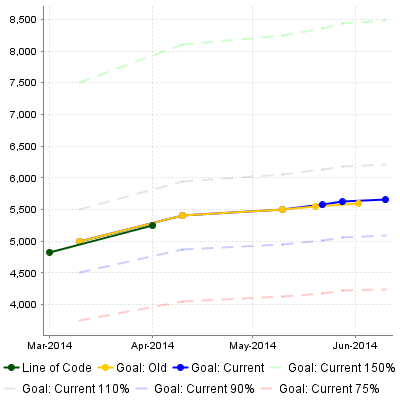
<chart type="TE"
    id="TE_LINE_GOALS_ADVANCED" byTime="true">
  <dataset renderer="LINE">
    <measure color="0,81,0" label="Line of Code">LC</measure>

    <goal color="ORANGE" versionDate="DATE(2014,03,01)" label="Old">LC</goal>
    <goal color="BLUE" versionDate="DATE(2014,05,01)" label="Current">LC</goal>

    <goal color="GREEN" shape="NONE" stroke="DOTTED" alpha="50" weight="1.5" label="Current 150%">LC</goal>
    <goal color="GRAY" shape="NONE" stroke="DOTTED" alpha="50" weight="1.1" label="Current 110%">LC</goal>
    <goal color="BLUE" shape="NONE" stroke="DOTTED" alpha="50" weight=".9" label="Current 90%">LC</goal>
    <goal color="RED" shape="NONE" stroke="DOTTED" alpha="50" weight=".75" label="Current 75%">LC</goal>
  </dataset>
</chart>
In the chart above, you notice how the last 3 milestones have slipped and understand that the goals have been revised with higher expectations by observing the yellow and blue solid lines. The dotted lines can be used as guides to give you an idea of where 75%, 90%, 110% or 150% of your goal lies on the chart.
You can use the goalHistory
element in a chart if you want to track the changes made to your goals.
This is useful in a post mortem when you review deviations from your original goals.
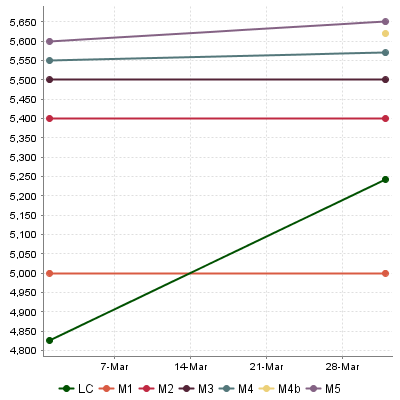
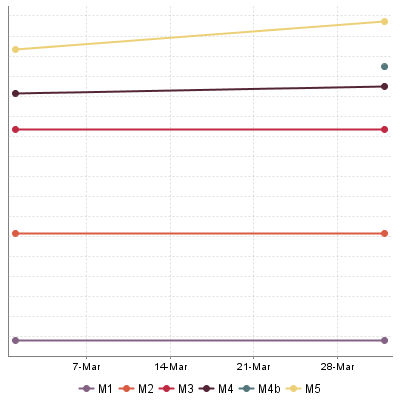
Temporal Evolution Chart displaying the evolution of goals for each milestone of the project
<chart type="TE" id="TE_MILESTONES_GOAL_HISTORY" byTime="true">
  <goalHistory>LC</goalHistory>
  <measure color="#005100">LC</measure>
</chart>
The chart in the example above follows the LC metric and also displays the goals for the metric for each milestone in the project. By the second analysis, you can see that the goals for M4 and M5 have been revised, and that a new milestone called M4b has been introduced.
An optional milestone
attribute allows displaying information about one milestone instead of all milestones, as shown below:
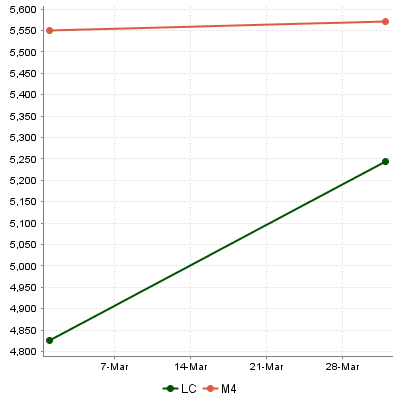
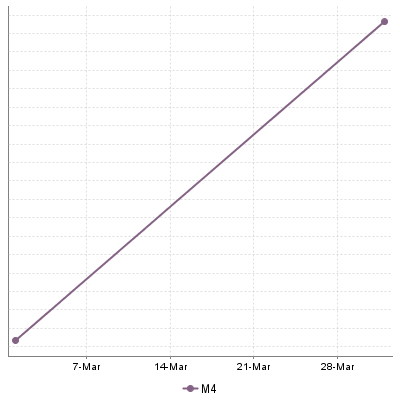
Temporal Evolution Chart displaying the evolution of the goal the M4 milestone
<chart type="TE" id="TE_MILESTONES_GOAL_HISTORY_SINGLE" byTime="true">
  <goalHistory milestone="M4">LC</goalHistory>
  <measure color="#005100">LC</measure>
</chart>
You can use keywords instead of using a milestone ID. You can retrieve information about the next, previous, first or last milestones in the project by using:
NEXT
NEXT+STEP
where STEP is a number indicating how many milestones to jump ahead
PREVIOUS
PREVIOUS-STEP
where STEP is a number indicating how many milestones to jump backward
FIRST
LAST
You can use the milestoneHistory
element in a chart if you want to track the date changes made
to your milestones.
Temporal Evolution Chart displaying changes in milestone dates for the project
<chart type="TE" id="TE_MILESTONES_HISTORY" byTime="true">
  <dataset renderer="LINE" rangeAxisId="HIDDEN">
    <milestoneHistory />
  </dataset>
  <rangeAxis id="HIDDEN" hideTickLabels="true" />
</chart>
The chart in the example above shows the addition of a new M4b milestone and date changes for milestones M4 and M5 in the project, by the time of the second analysis.
An optional milestone
attribute allows displaying information about one milestone instead of all milestones, as shown below:
Temporal Evolution Chart displaying the date slip for the M4 milestone
<chart type="TE" id="TE_MILESTONES_HISTORY_SINGLE" byTime="true">
  <milestoneHistory milestone="M4" />
  <measure color="#005100">LC</measure>
</chart>
You can use keywords instead of using a milestone ID. You can retrieve information about the next, previous, first or last milestones in the project by using:
NEXT
NEXT+STEP
where STEP is a number indicating how many milestones to jump ahead
PREVIOUS
PREVIOUS-STEP
where STEP is a number indicating how many milestones to jump backward
FIRST
LAST
You can use markers based on your milestones in your charts. The type of information you can display is:
Horizontal markers based on the value of the current goal for a specific metric
with
fromMilestonesGoal
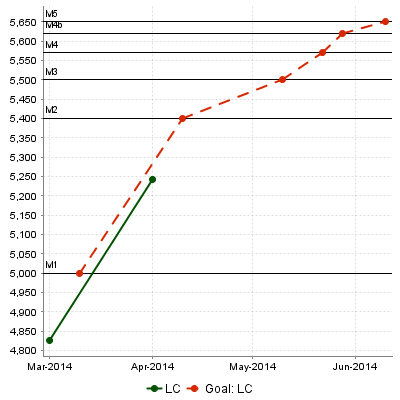
Temporal Evolution Chart displaying markers for the goals for the metric LC for each milestone
<chart type="TE" id="TE_MILESTONES_HORIZONTAL_MARKER" byTime="true">
  <goal color="#D62700" stroke="DOTTED">LC</goal>
  <measure color="#005100">LC</measure>
  <markers>
    <marker fromMilestonesGoal="LC" alpha="150" isVertical="false" />
  </markers>
</chart>
Vertical markers based on the dates of milestones in the project
with
fromMilestones
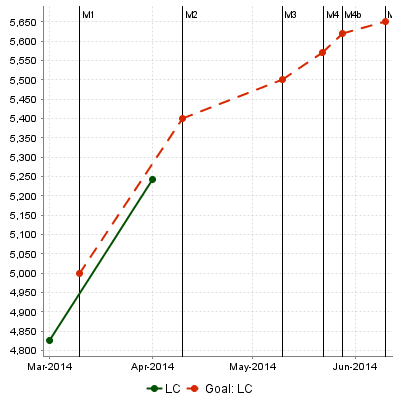
Temporal Evolution Chart displaying markers for the dates of all milestones in the project
<chart type="TE" id="TE_MILESTONES_VERTICAL_MARKER" byTime="true">
  <goal color="#D62700" stroke="DOTTED">LC</goal>
  <measure color="#005100">LC</measure>
  <markers>
    <marker fromMilestones="true" alpha="150" isVertical="true" />
  </markers>
</chart>
For more information about markers, consult the section called “Using Markers”. Note that in both cases, the marker labels are automatically set to the milestone names.