| > Show on single page > Show on multiple pages |
You can get information on how your collaborators are viewing the projects you manage or the models you develop by using the statistics features of Squore. This section describes the information available to project managers and model developers via Models > Statistics and the Manage Project page.
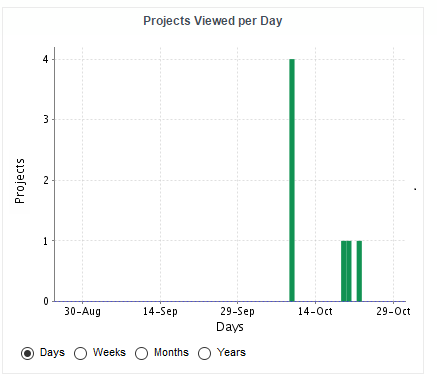
As a project manager, you can use project statistics to investigate the popularity of your project by going to Manage > Statistics.
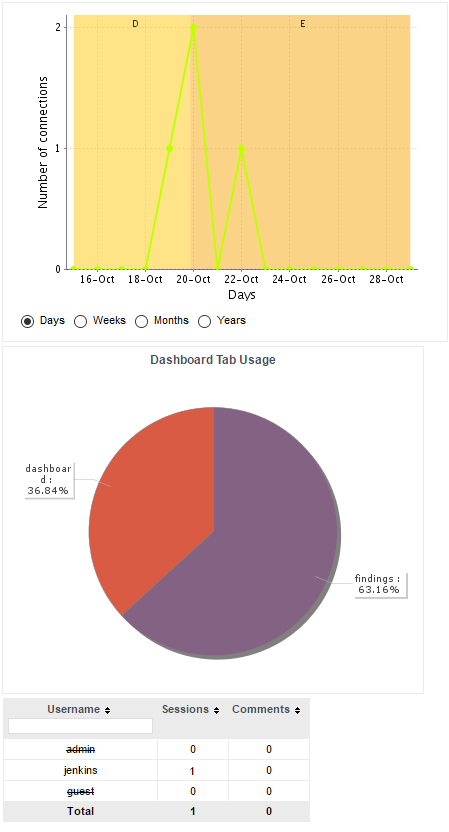
When you select a reporting period, the following information is displayed:
The trend of the number of views for this project uses the colours from the scale of the root indicator as background to help you correlate the project rating with the number of visits.
The pie chart helps you understand which of the dashboard tabs is the most visited for this project.
A table summarises the breakdown of views per user, as well as the number of comments left by each user.
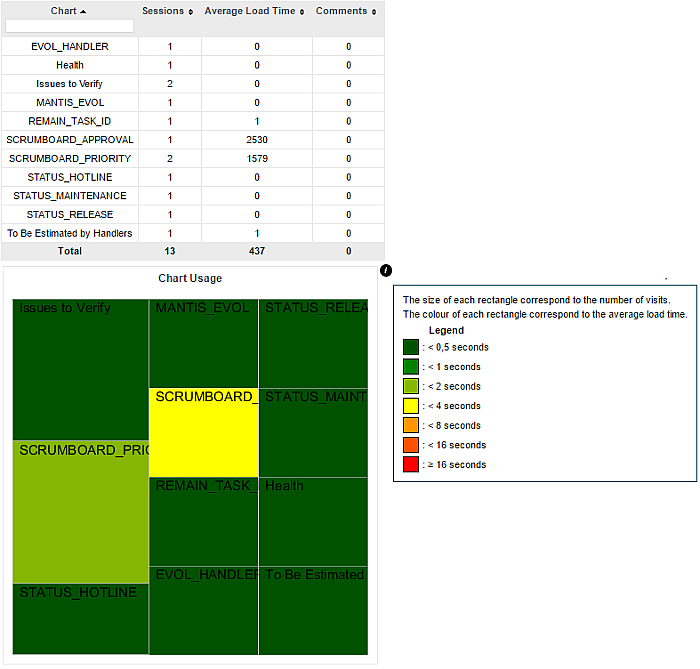
You can learn more about the usage of particular features of a model by clicking Models > Statistics. For each analysis model, find out how many users consult results, which projects are the most popular and which regions and charts of the dashboard are the most useful for users.
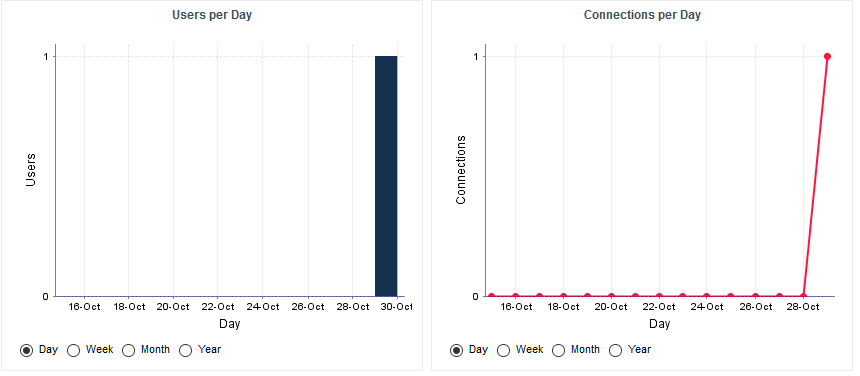
The Users tab displays the information about the number of users and overall connections to the server for projects in this analysis model.
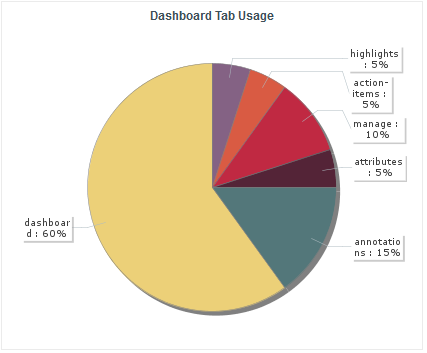
The Dashboard tab allows analysing the usage of each tab on the dashboard. Each tab is represented in a pie chart according to how many views it receives. This information can be used to adjust the default display status of each tab or their availability to end users.