| > Show on single page > Show on multiple pages |
The Control Flow Chart is a graphical representation of the logical structure of a function using different-coloured shapes reflecting the type of logical break (if, while, switch...) in the code.
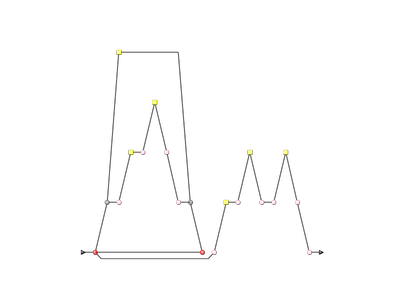
Control Flow Chart
<chart id="CONTROL_ID" type="ControlGraph"</chart>
The chart
for a Control Flow Chart does not accept any elements or attributes apart from the common ones.
The Source Code Viewer is a special chart-like placeholder on a dashboard that allows users to click it to view the source code of the current artefact.
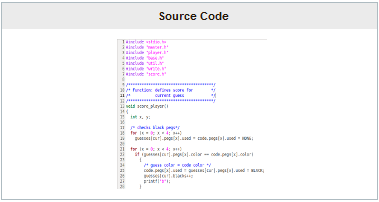
Source Code Viewer
<chart id="SOURCE_CODE_ID" type="SourceCode"</chart>
The chart
for the Source Code Viewer does not accept any elements or attributes apart from the common ones.
The Scrum Board offers a graphical representation of the completion of your tasks for project monitoring. Each task is represented as a sticky note that displays the task ID and provides a link to the issue tracker to review the task.
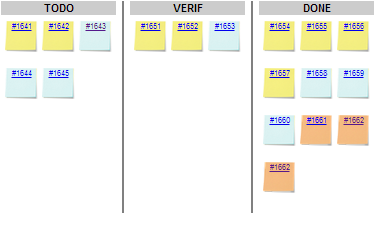
Scrum Board
<chart type="ScrumBoard"   postitByColumn="3"
			  header="SCALE_PARKING_LOT"
			  prefixTaskLink="http://support.example.com/view.php?taskId=" >
  <rule color="255,0,0">EVO_TODO</rule>
  <rule>BUG_TODO</rule>
  <rule>BUG_INT_TODO</rule>
  <rule>EVO_VERIF</rule>
  <rule>BUG_VERIF</rule>
  <rule>BUG_INT_VERIF</rule>
  <rule>EVO_DONE</rule>
  <rule>BUG_DONE</rule>
  <rule>BUG_INT_DONE</rule>
</chart>
The chart
tag accepts the following attributes:
The Scrum Board requires the following elements: