| Installation and Administration | Getting Started | Command Line | Configuration | Eclipse Plugin | Reference Manual |
| Show on single page Show on multiple pages |
|
|
|
|
Some charts (Simple Pie and Simple Bar) support dynamically grouping target artefacts according to textual information
in a measure. In order to use this information, you do not use an indicator
or
measure
element but an info
element with the measure holding the
text information.
You can hide or exclude unwanted textual information from charts with:
excludeInfos
(optional, default: empty) to completely ignore information. The specified
strings will not be shown on the chart and will not be included in any calculations on the chart.
hideInfos
(optional, default: empty) to hide information on the chart but make it appear
in the legend so users can manually click to activate it.
Here is a sample definition for a Simple Bar chart where each bar is labelled according to the textual information
held in the ASSIGNEE metric.
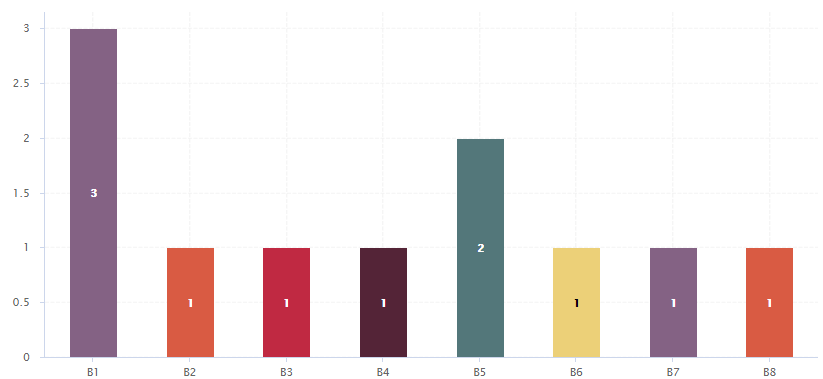
A Simple Bar chart using the CODE_TYPE textual information from CODE artefacts.
<chart type="SimpleBar" id="INFO_EXAMPLE" targetArtefactTypes="CODE">
	<info hideInfos="UNKNOWN;UNSURE;N/A" excludeInfos="INVALID_DATA">CODE_TYPE</info>
</chart>
You can also display textual information in tables, using the following syntax for example:
<table id="INFO_TABLE_EXAMPLE">
	<line indicatorId="CODE_TYPE" displayType="TEXT" />
</table>
For more information about tables, consult the section called “Scorecard Tables” or the section called “Analysis Model Dashboards”.