| > Show on single page > Show on multiple pages |
If at any moment you have doubts about how a feature works, Squore offers help in HTML and PDF formats. A Wiki and support site are also available.
The Squore online help can be accessed from anywhere in Squore by clicking on the ? > Help menu entry.
The online help is contextual and provides information in a popup window about the page that you are currently viewing in Squore.
The Squore user guides are available in PDF and HTML format by clicking the ? > User Guides menu entry in Squore. You can download a copy for offline use.
The Squoring Technologies Support Wiki provides release notes, known issues and hints and tips for current and past Squore versions. Visit http://openwiki.squoring.com for more information.
Every owner or Project Manager of a project can retrieve the analysis log files for their projects without the need to consult an administrator. This is done by accessing the Manage page for a particular project and viewing the Versions tab (My Projects page > Manage icon > Versions tab) as shown below:
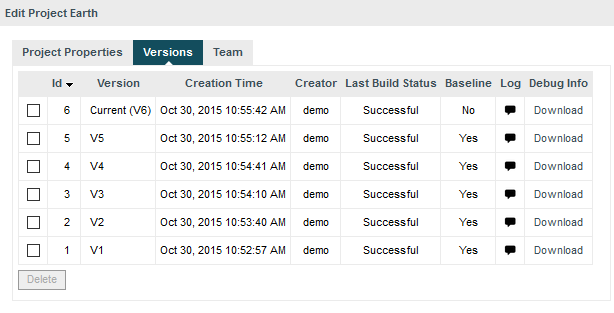
Clicking the Log icon opens a page showing the project's client and server logs, as well as configuration and output files will open in a new browser tab.
Clicking the Download link in the Debug info column downloads a zip file of the logs and project data that can be further analysed to understand problems during problem creation.
In order to investigate application failures (rather than project analysis errors), Squore administrators have the possibility to extract the latest log file created by the application. You can access the log if you have administrator privileges by clicking Administration > Server Log in the toolbar after logging in. The log file opens in a new browser window or tab.
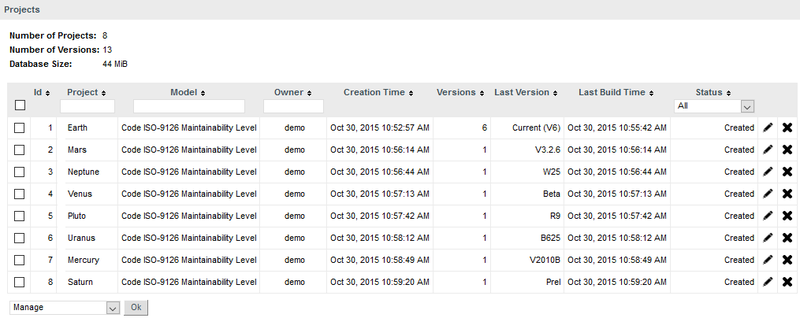
Administrators can also get debug information and manage any project created on the server by clicking Administration > Projects, which provides a detailed view of all projects created on Squore Server, on a summary page shown below.
A debug info package contains the following items:
A DataProviders folder containing the output files generated by
each Data Provider run during the analysis.
A [DataProviderName].log file for each Data Provider included in the analysis.
A [projectId]_conf.xml file summarising the project parameters used for the analysis.
A [projectId]_output.xml file containing the output information requested with the --filter parameter during the analysis.
A build.log file containing the information relative to actions carried out on the server during the analysis.
A build_client.log file containing the information relative to actions carried out on the client during the analysis.
A excluded.log file containing the list of all files not included in the analysis and the reason for their exclusion. Note that this file is only generated if some files were excluded.
A table.md5 file containing state information about the analysed source code, if any.
A storage folder containing information about the analysed source code, if any.
If you do not want to download the entire debug package, note that the main log files can also be downloaded individually from the Projects page by clicking on the project status label.